Temperature Model Performance Summary
Average metrics from selected validation images per section. Cell colours reflect performance thresholds (see legends). Refer to Chapter 5.3 for methods used to compute error in each assessment polygon.
Mean Absolute Error (°C)
| Section | 2013 | 2015 | 2020 | 2021 | 2022 | 2023 |
|---|---|---|---|---|---|---|
| North (Gage Roads) | 0.117 | 0.103 | 0.126 | 0.174 | 0.232 | 0.062 |
| Owen Anchorage | — | — | — | 0.082 | 0.164 | 0.103 |
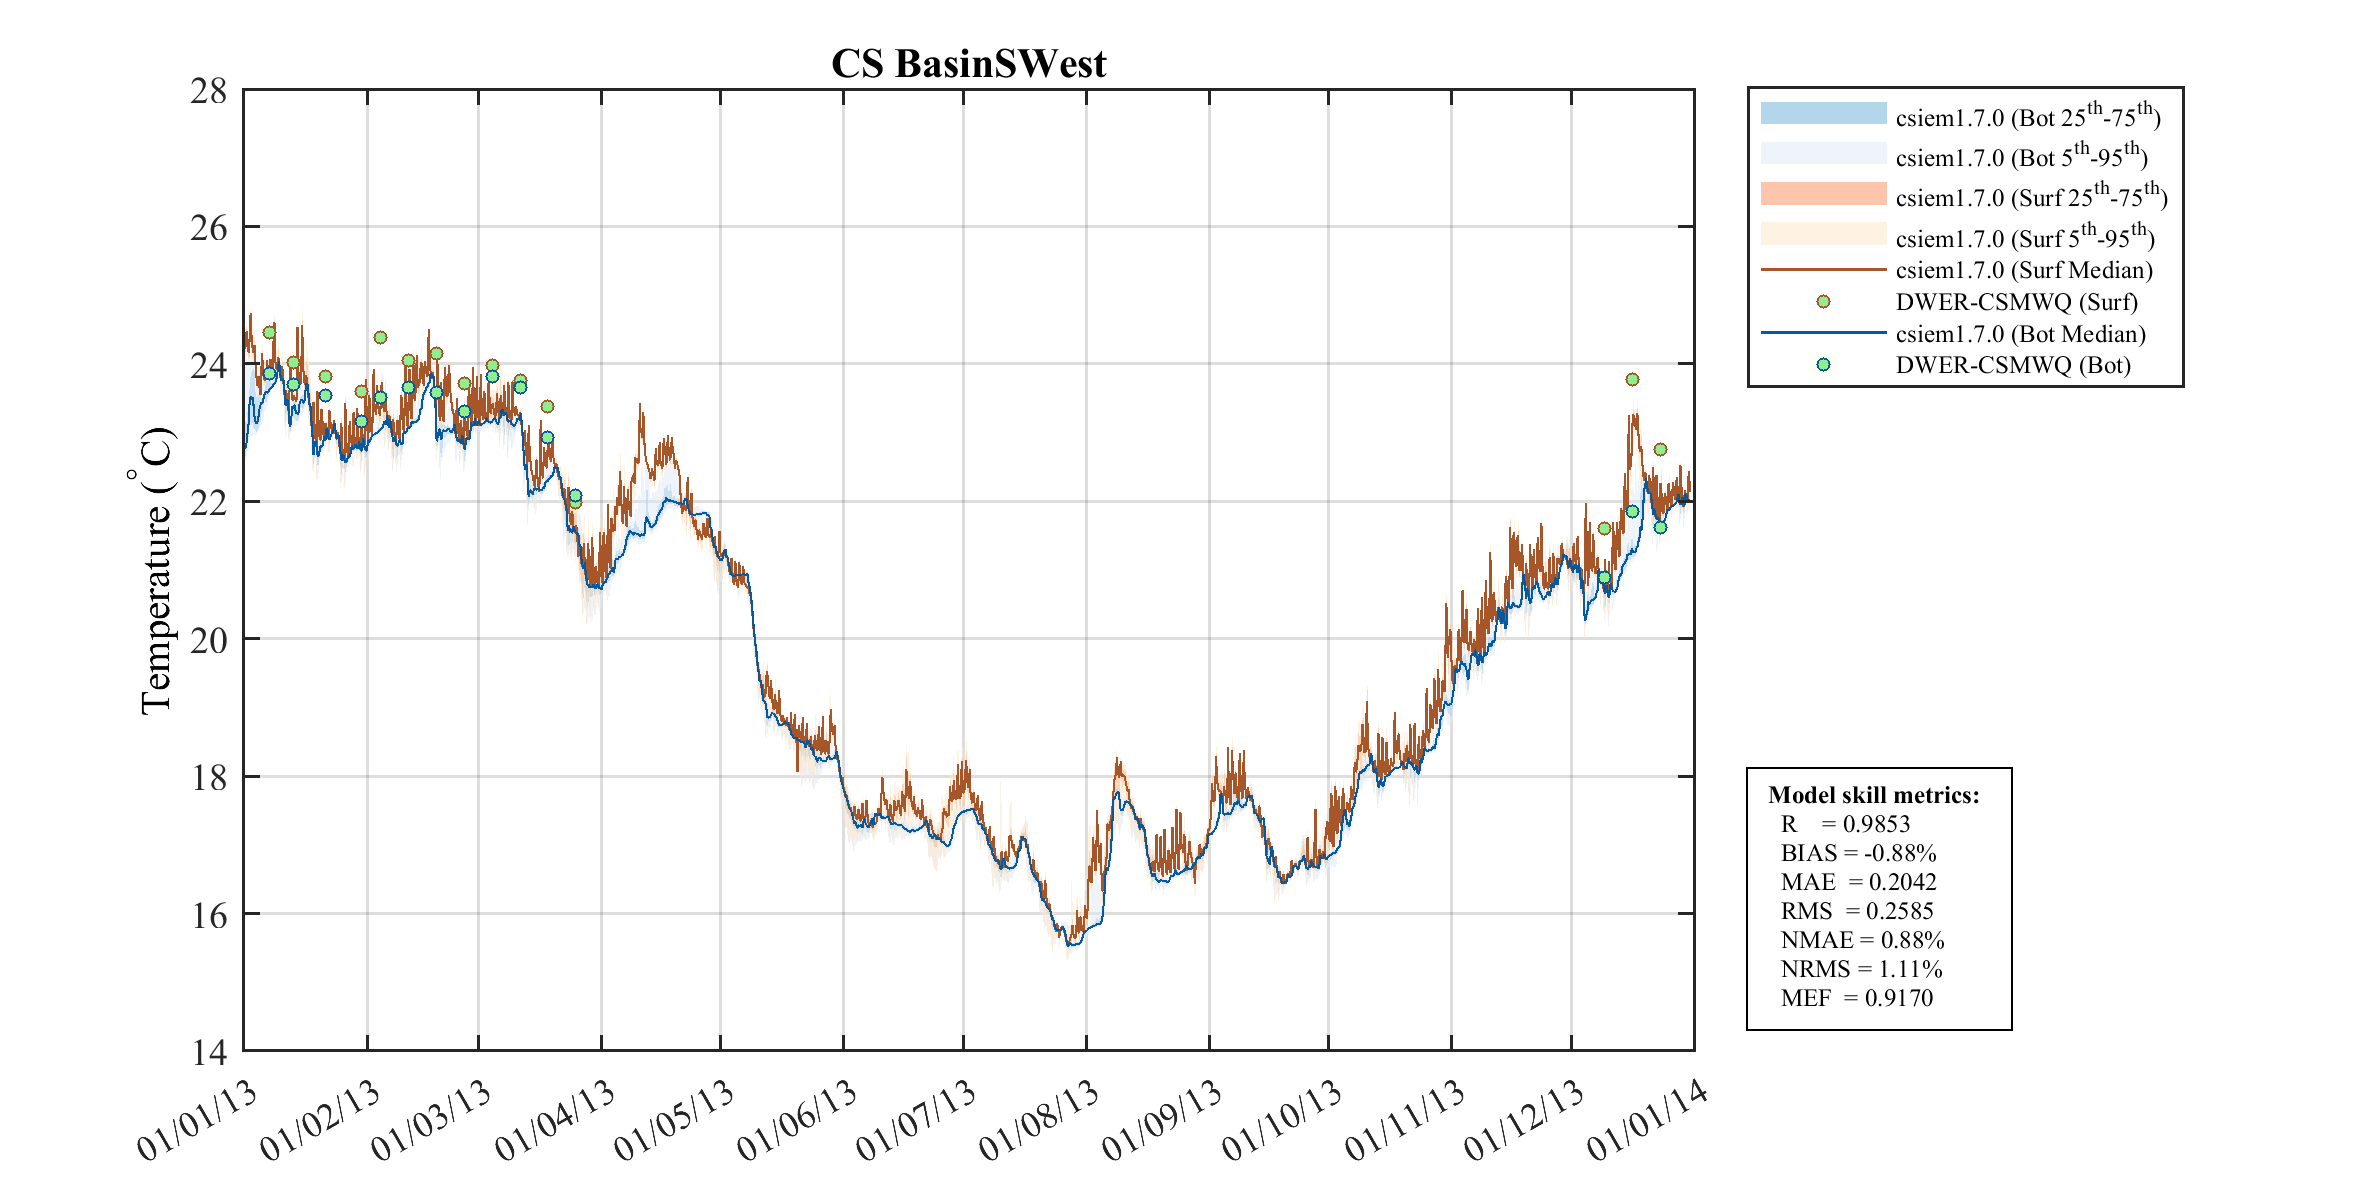
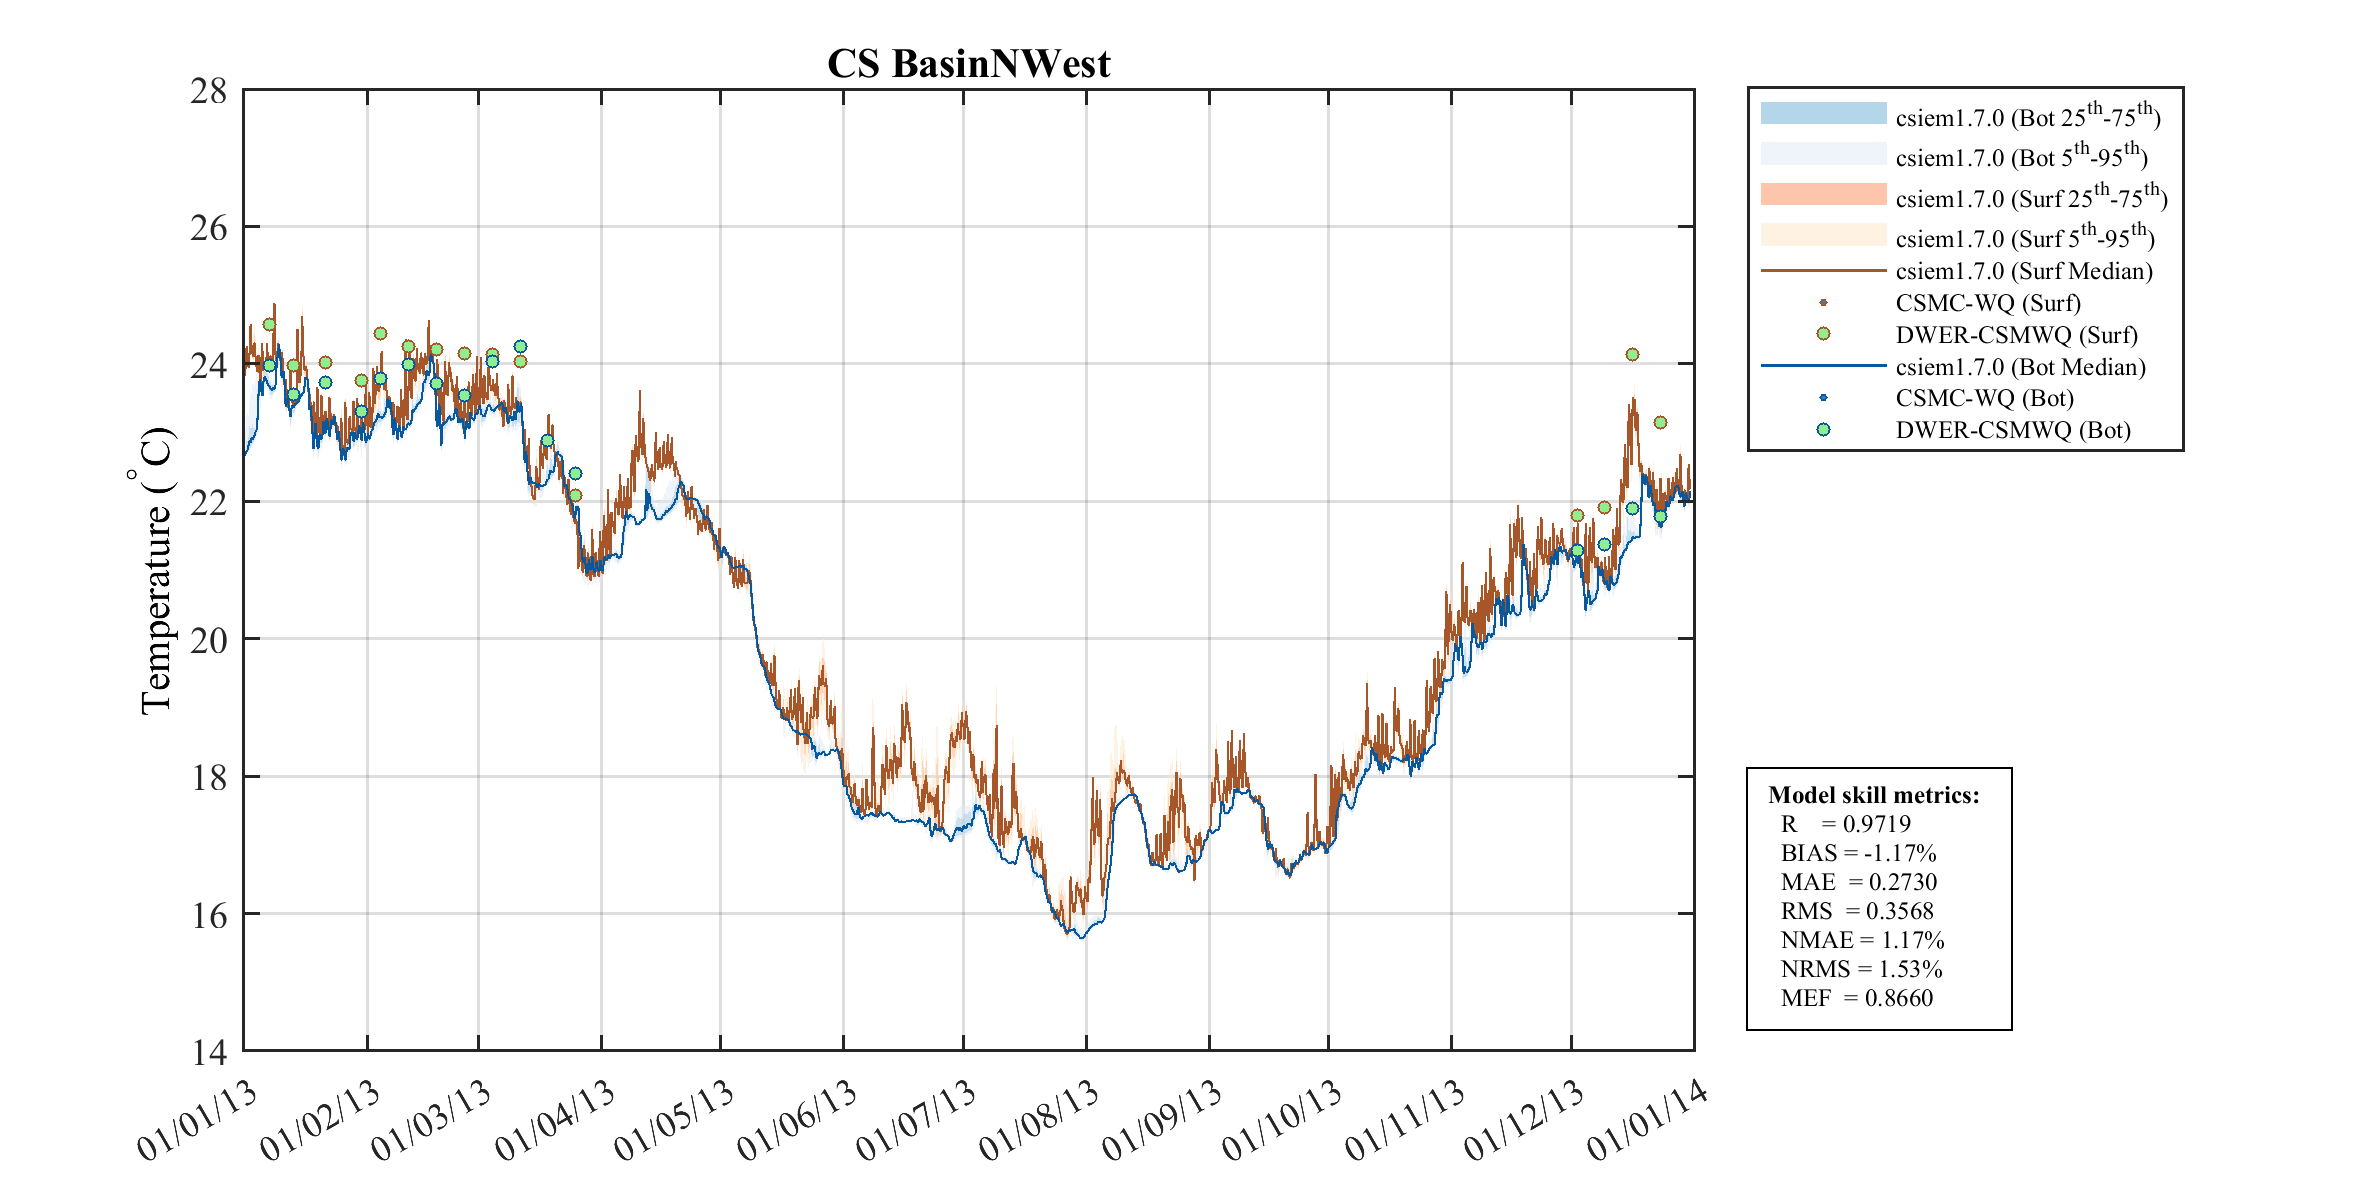
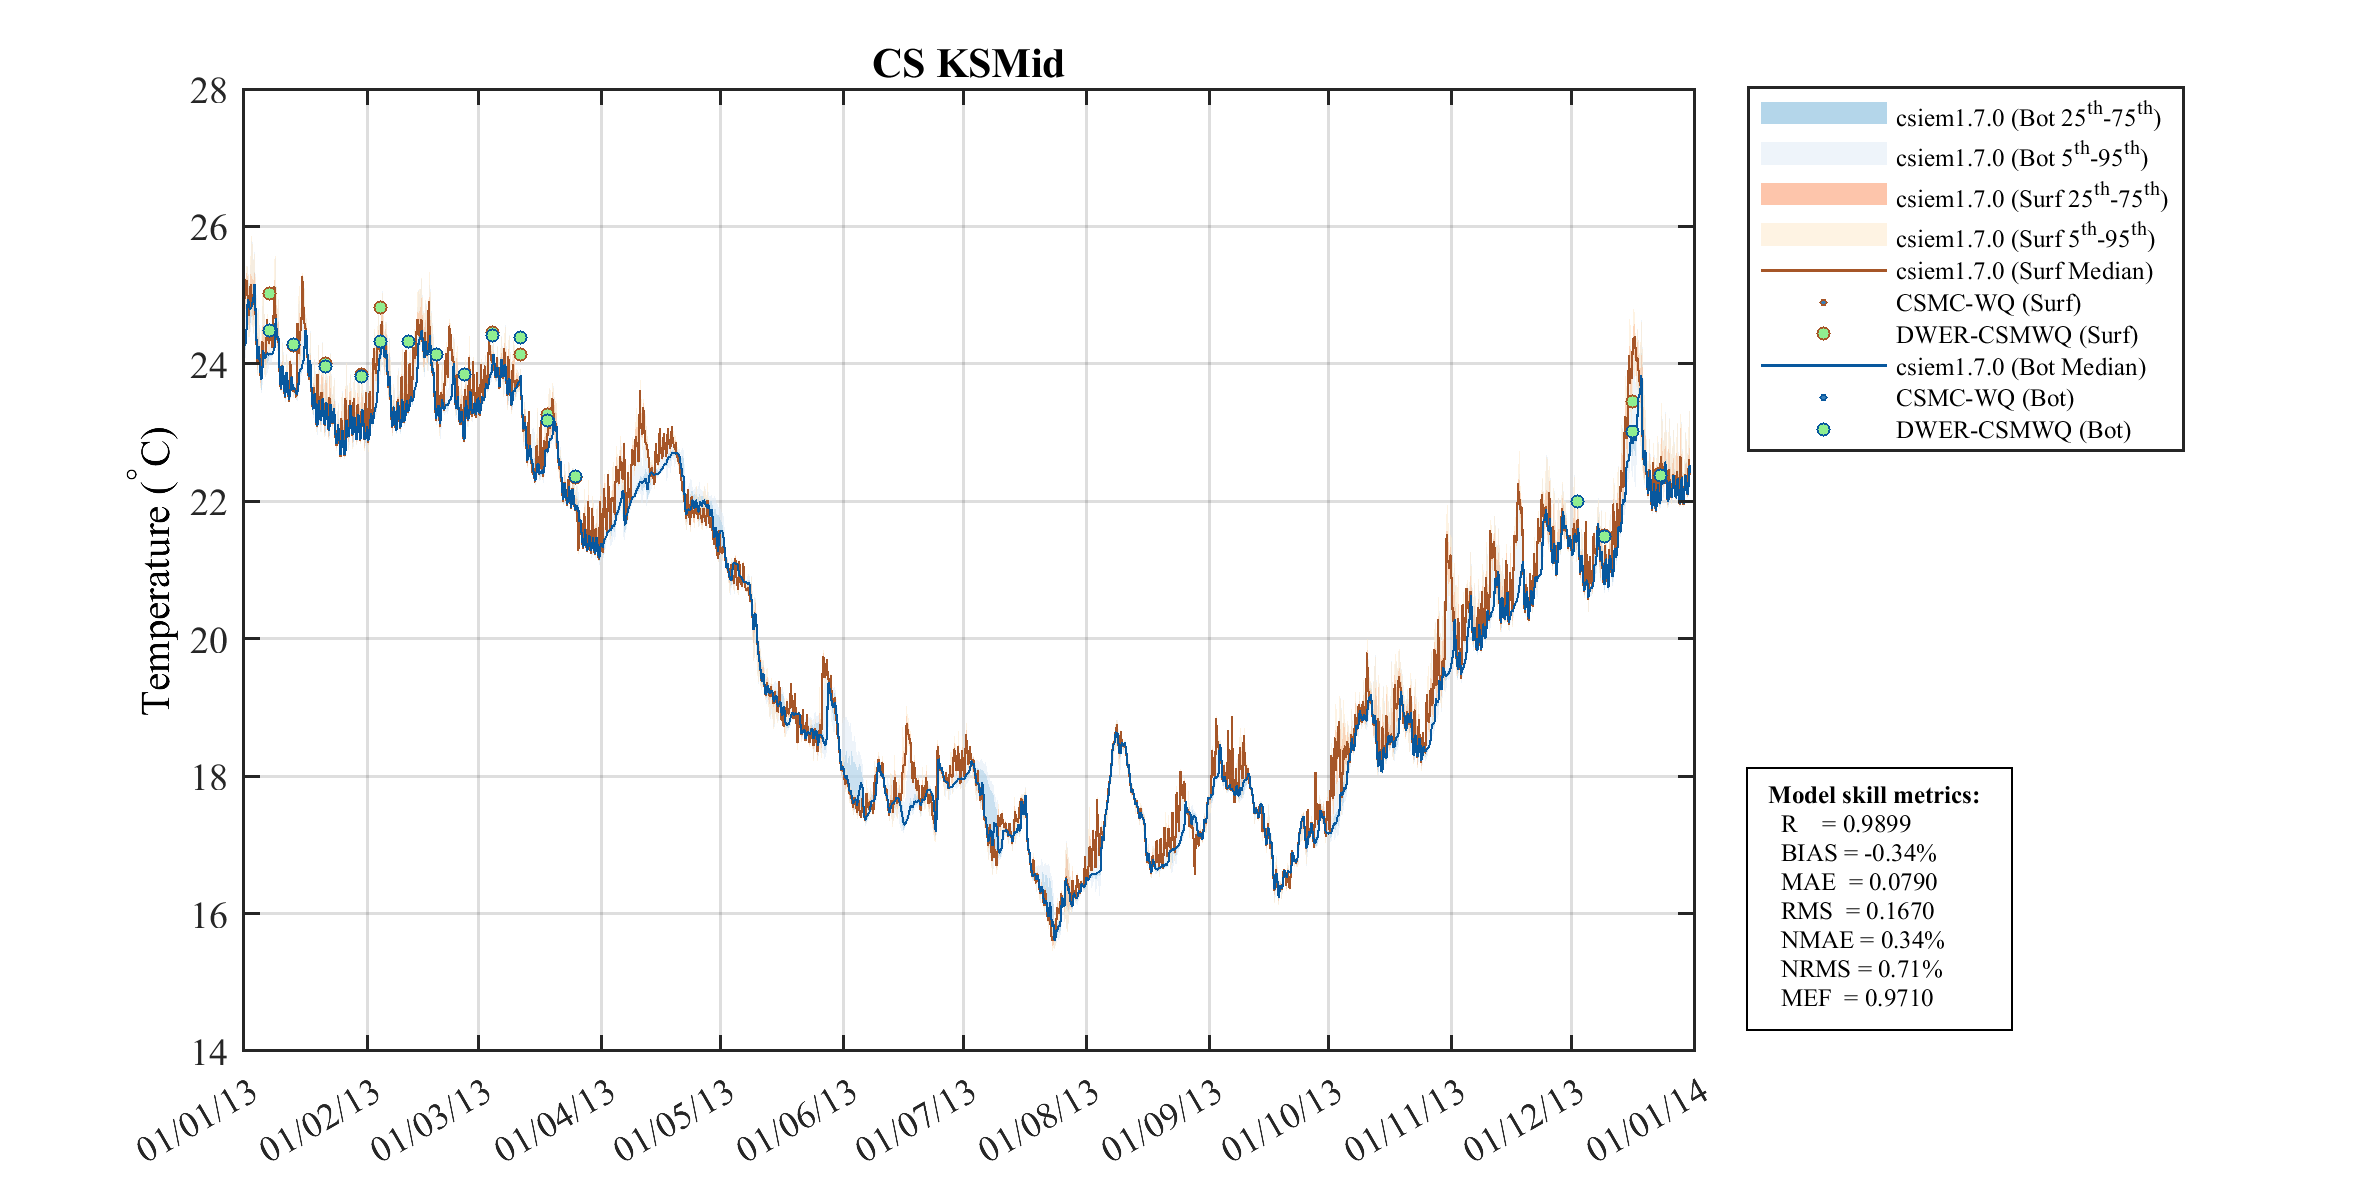
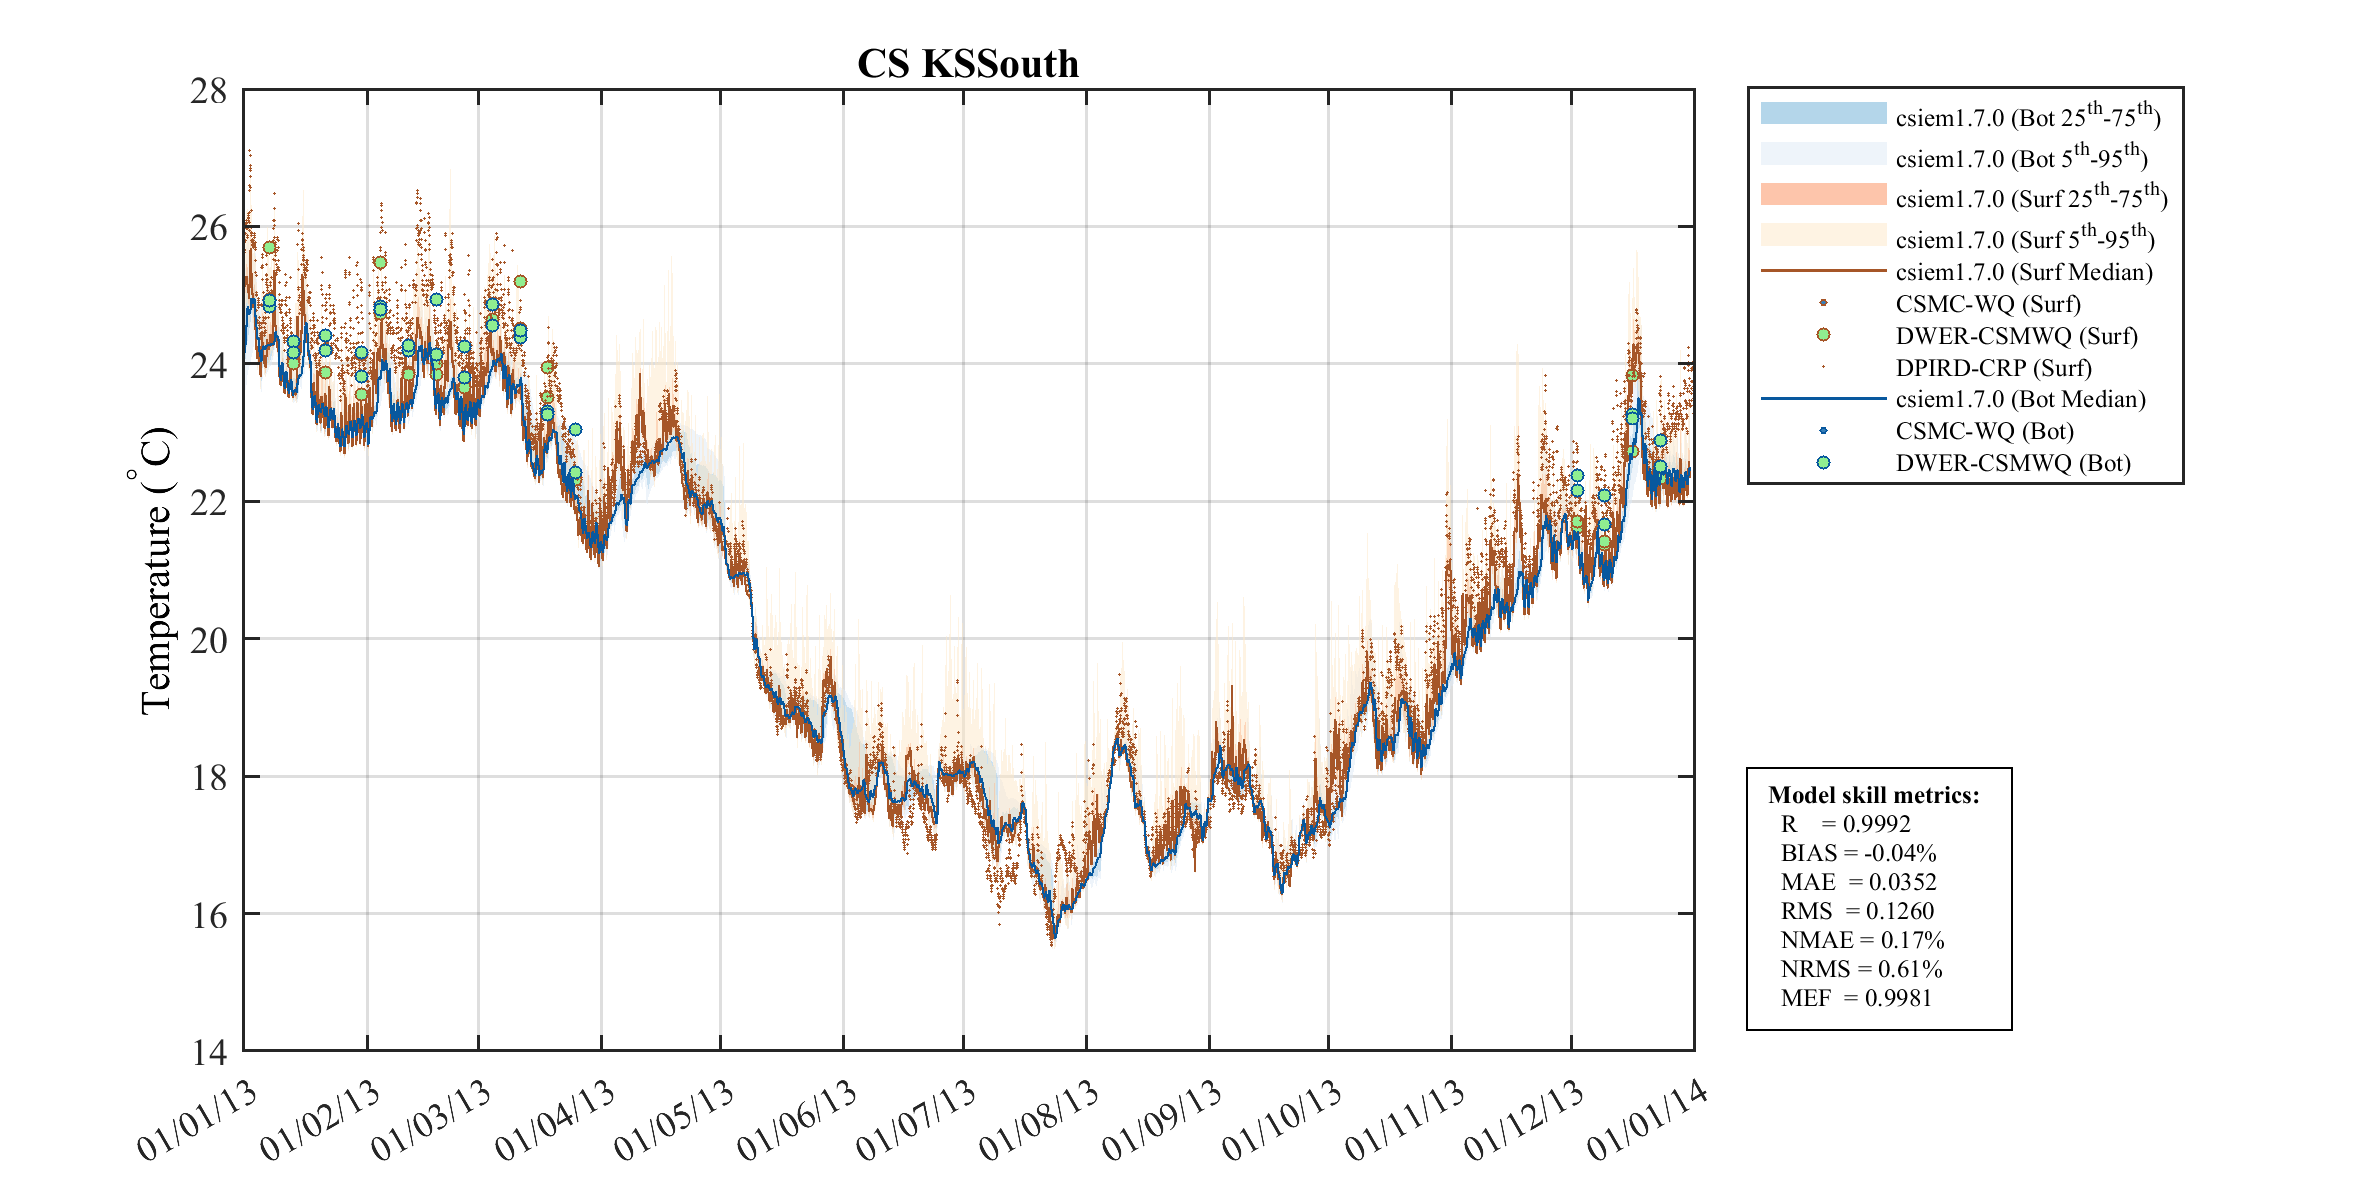
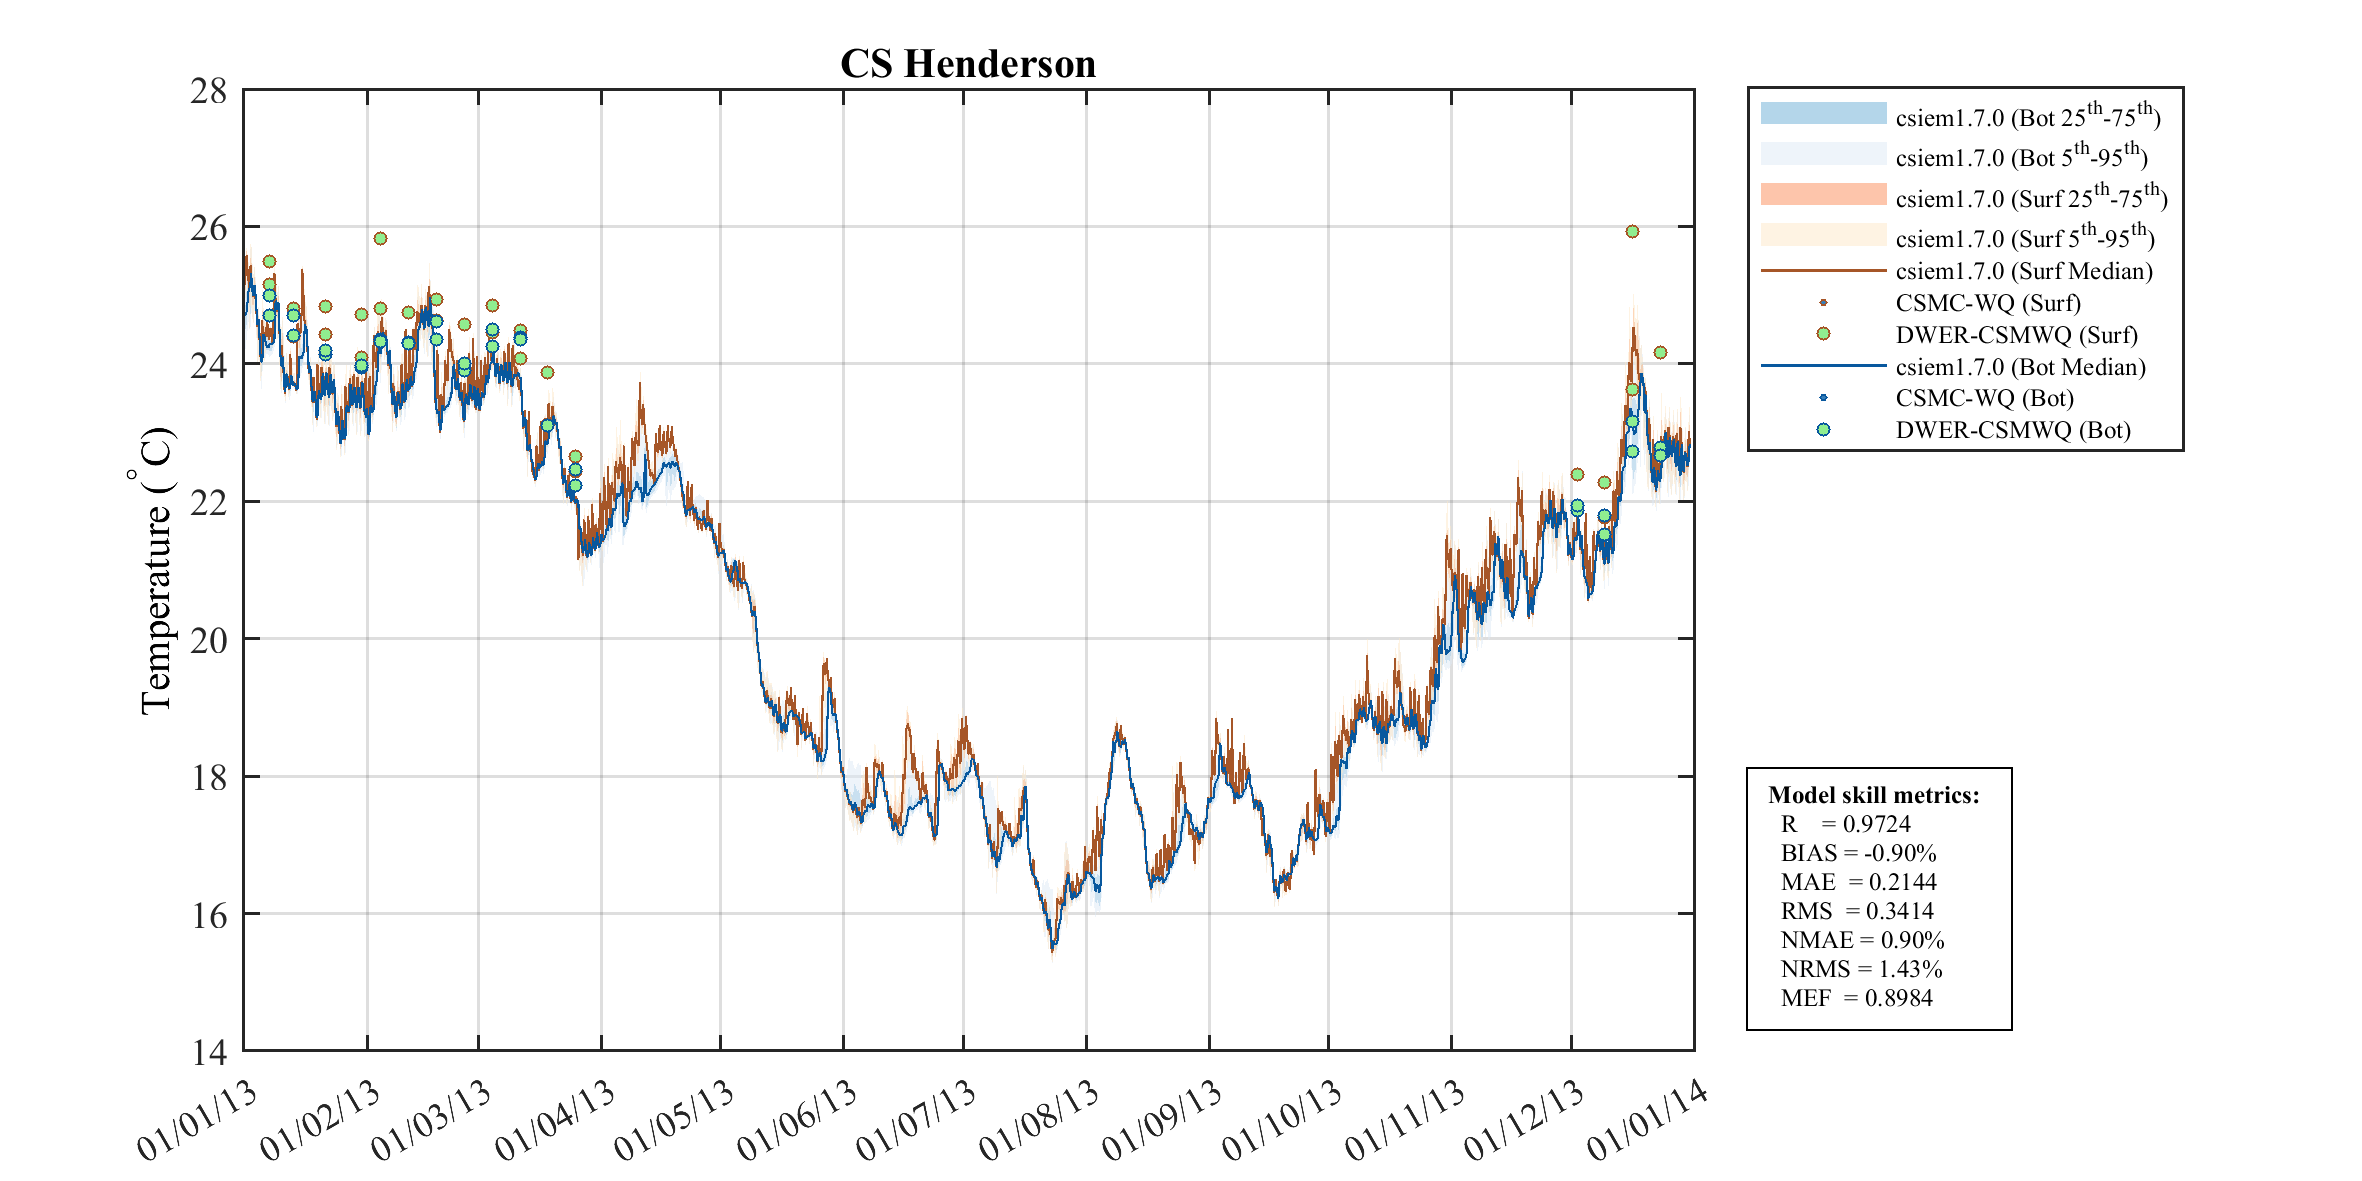
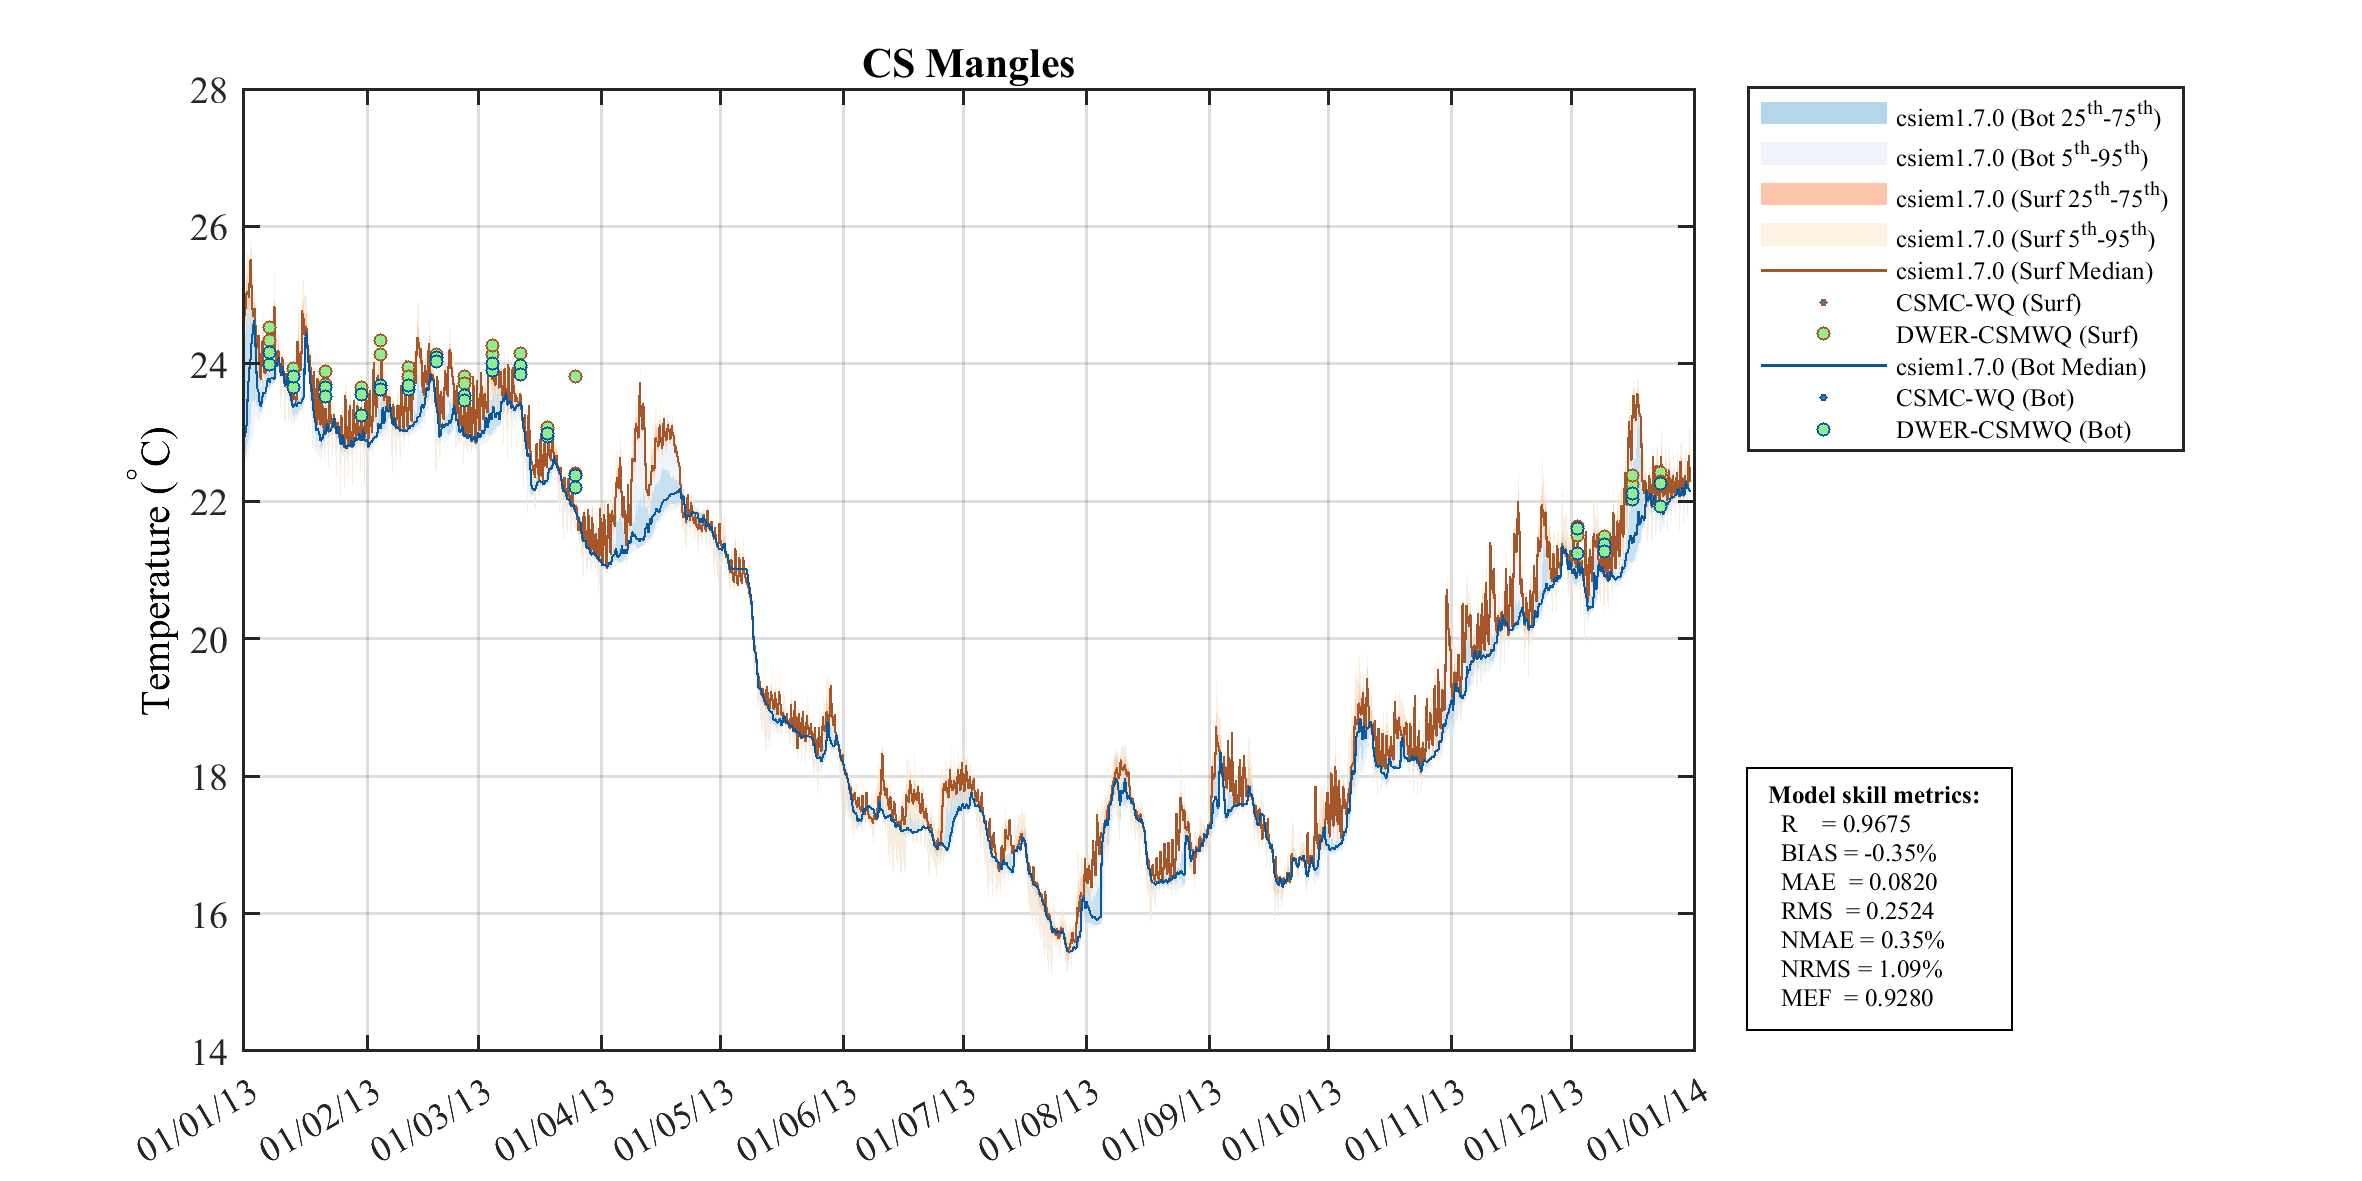
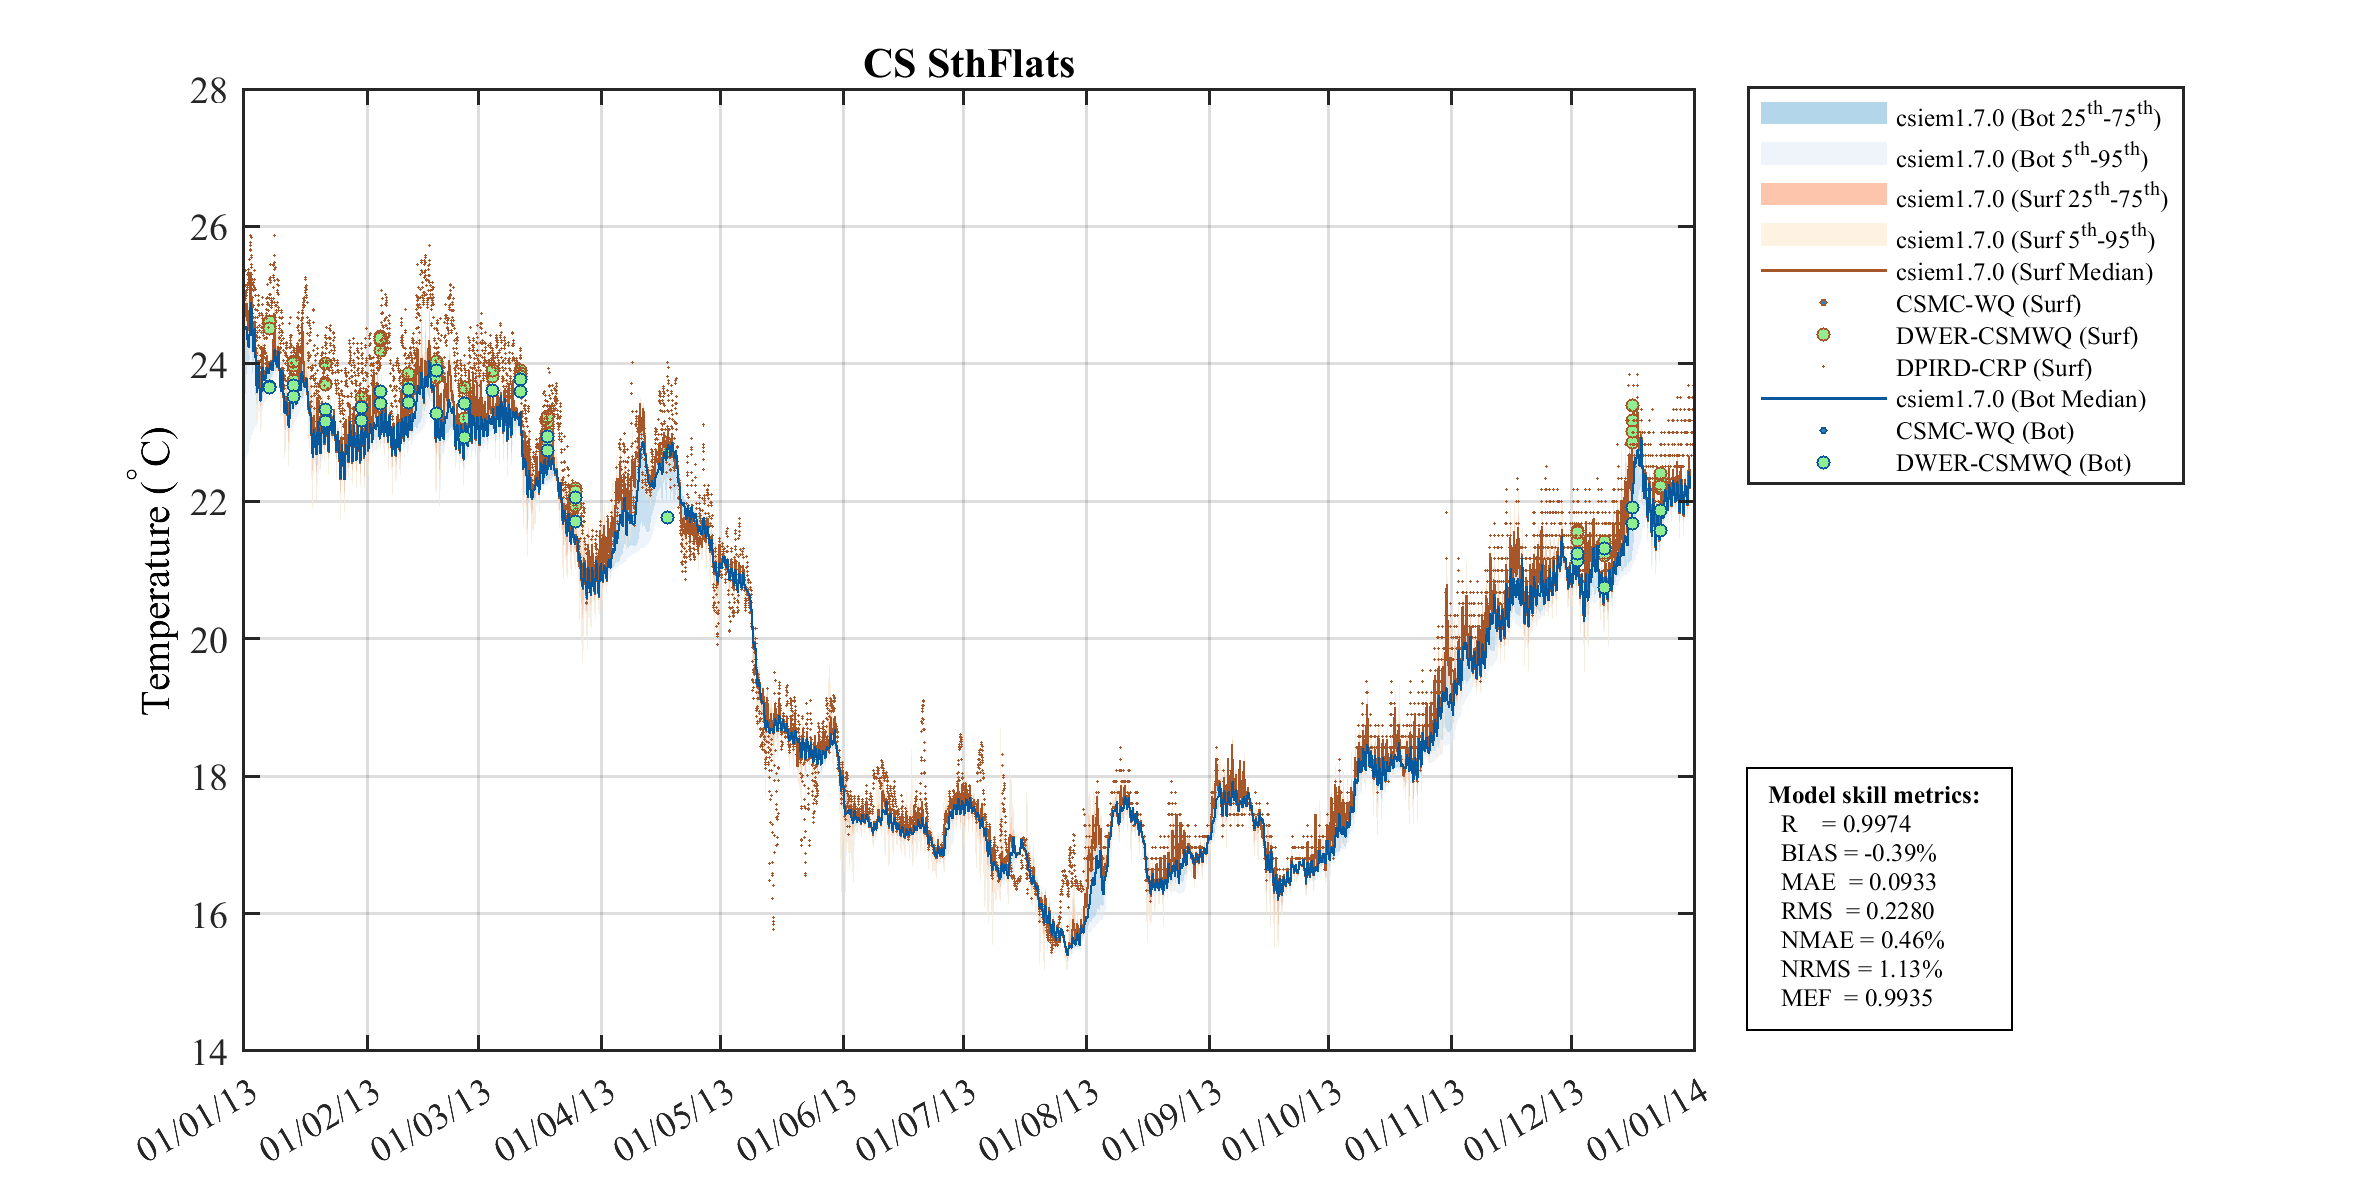
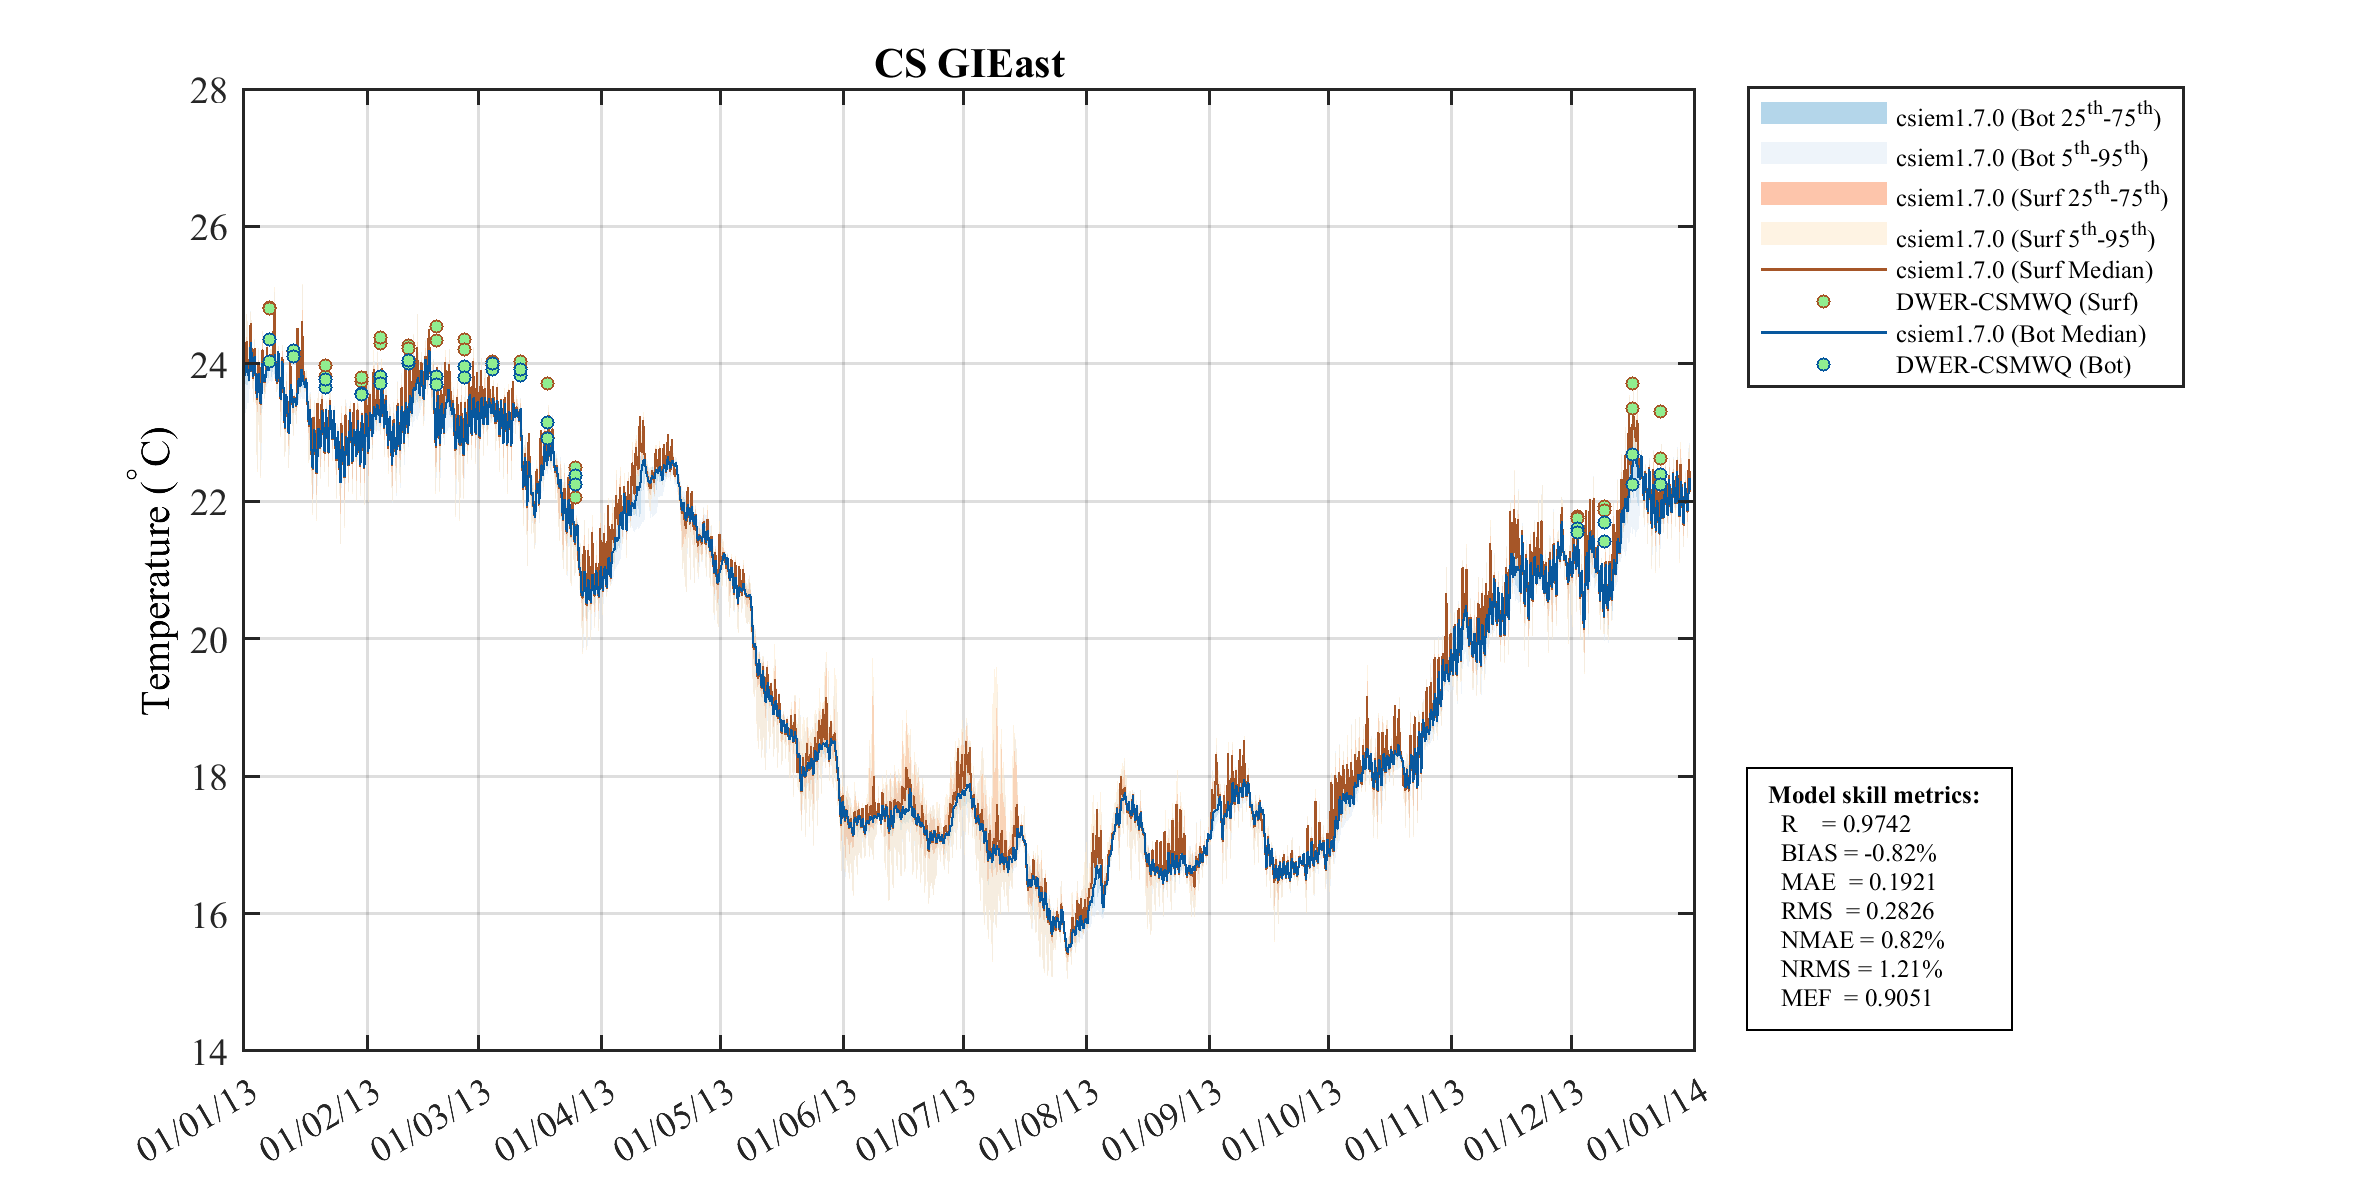
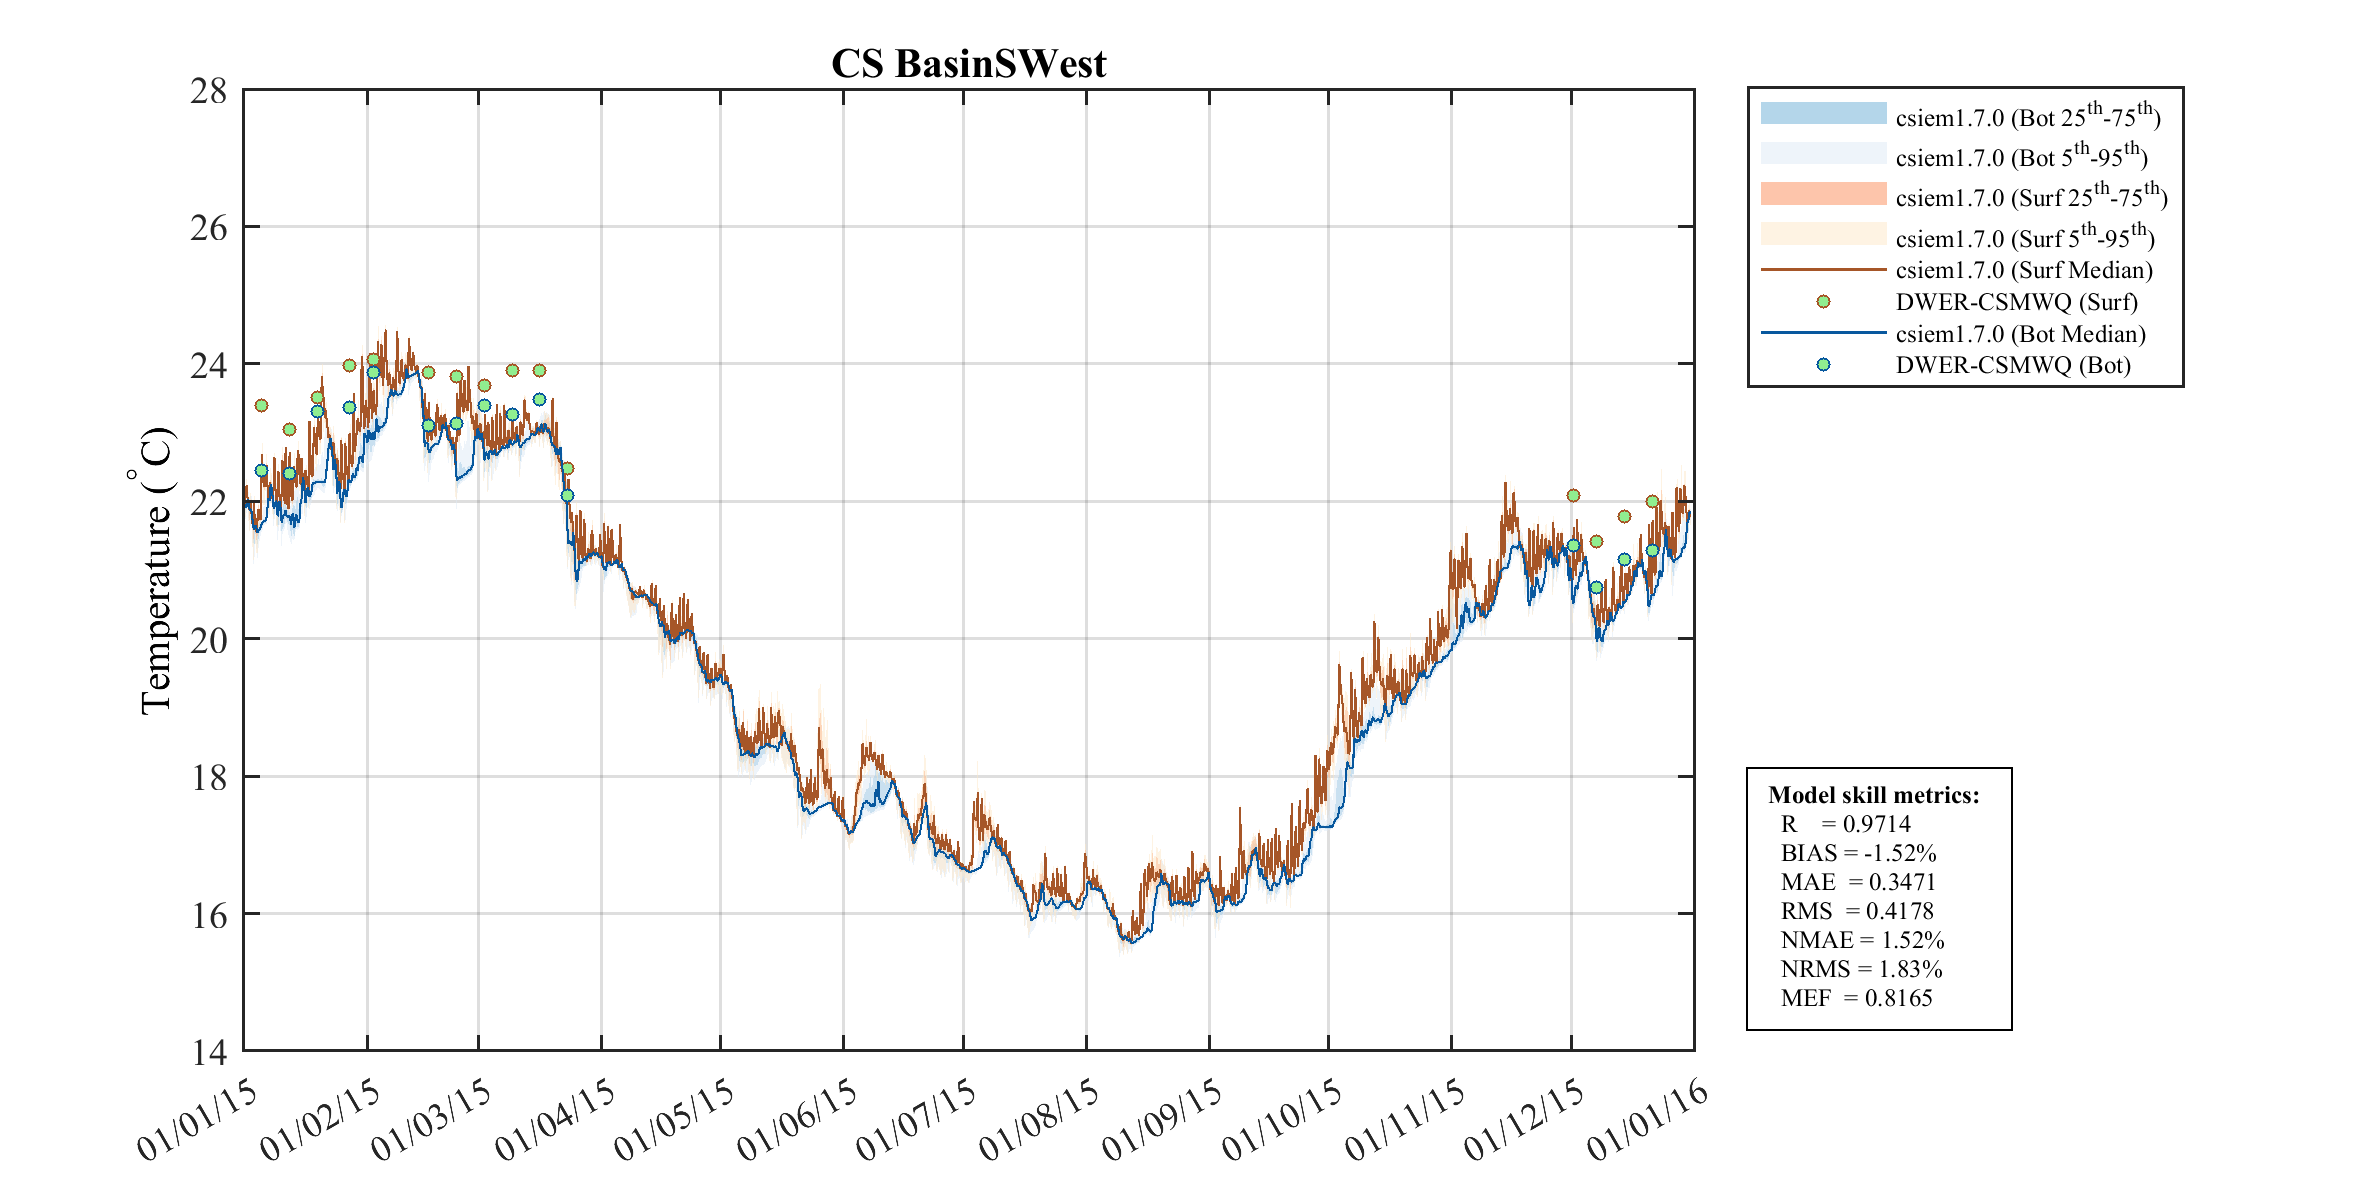
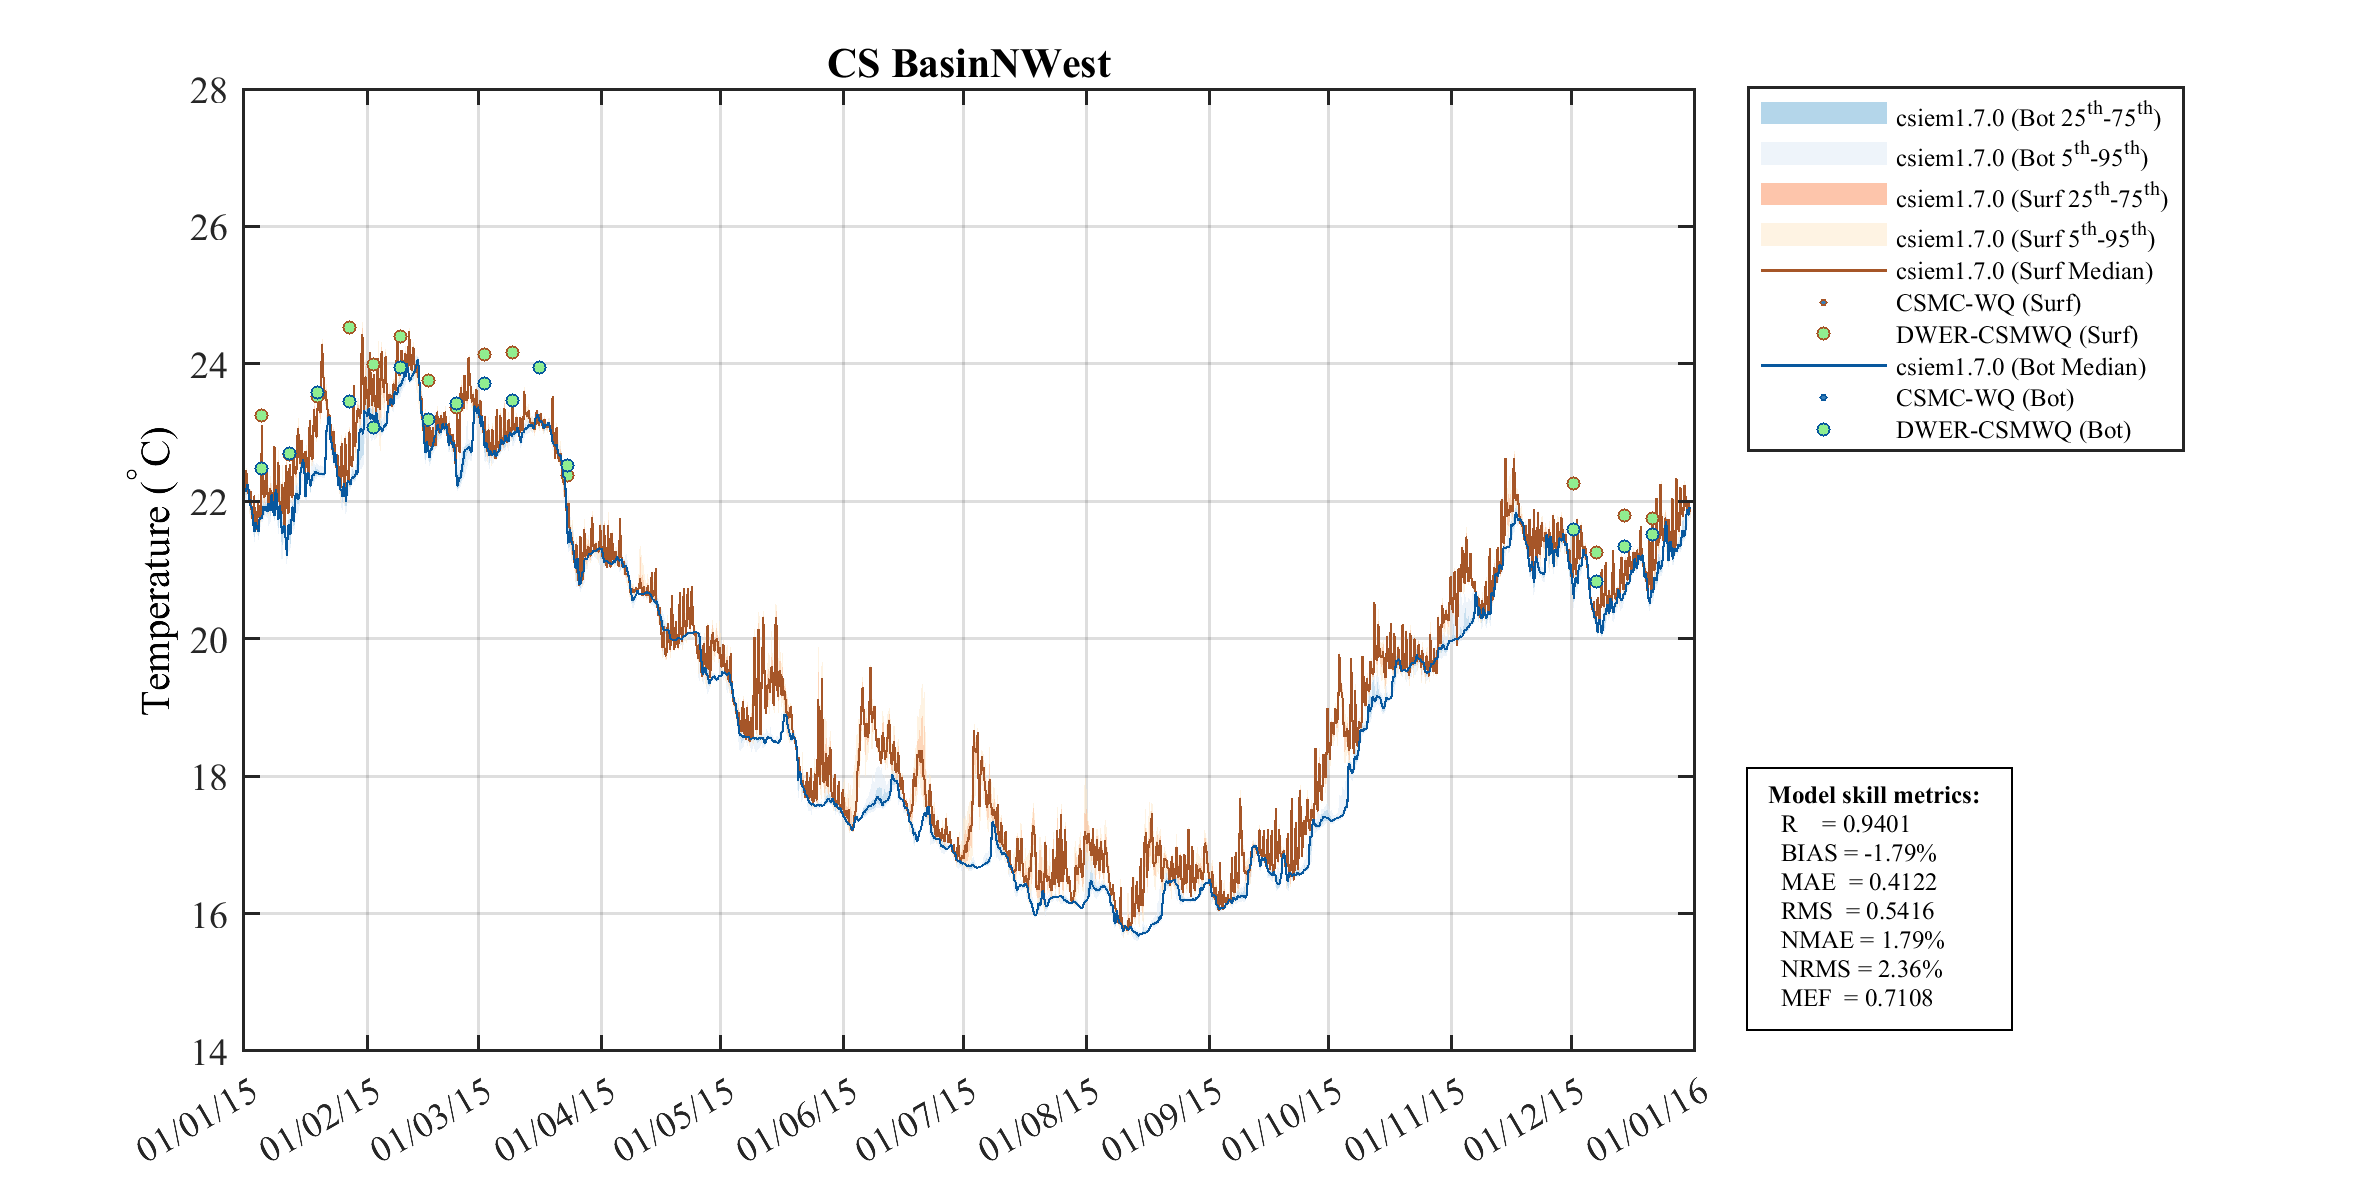
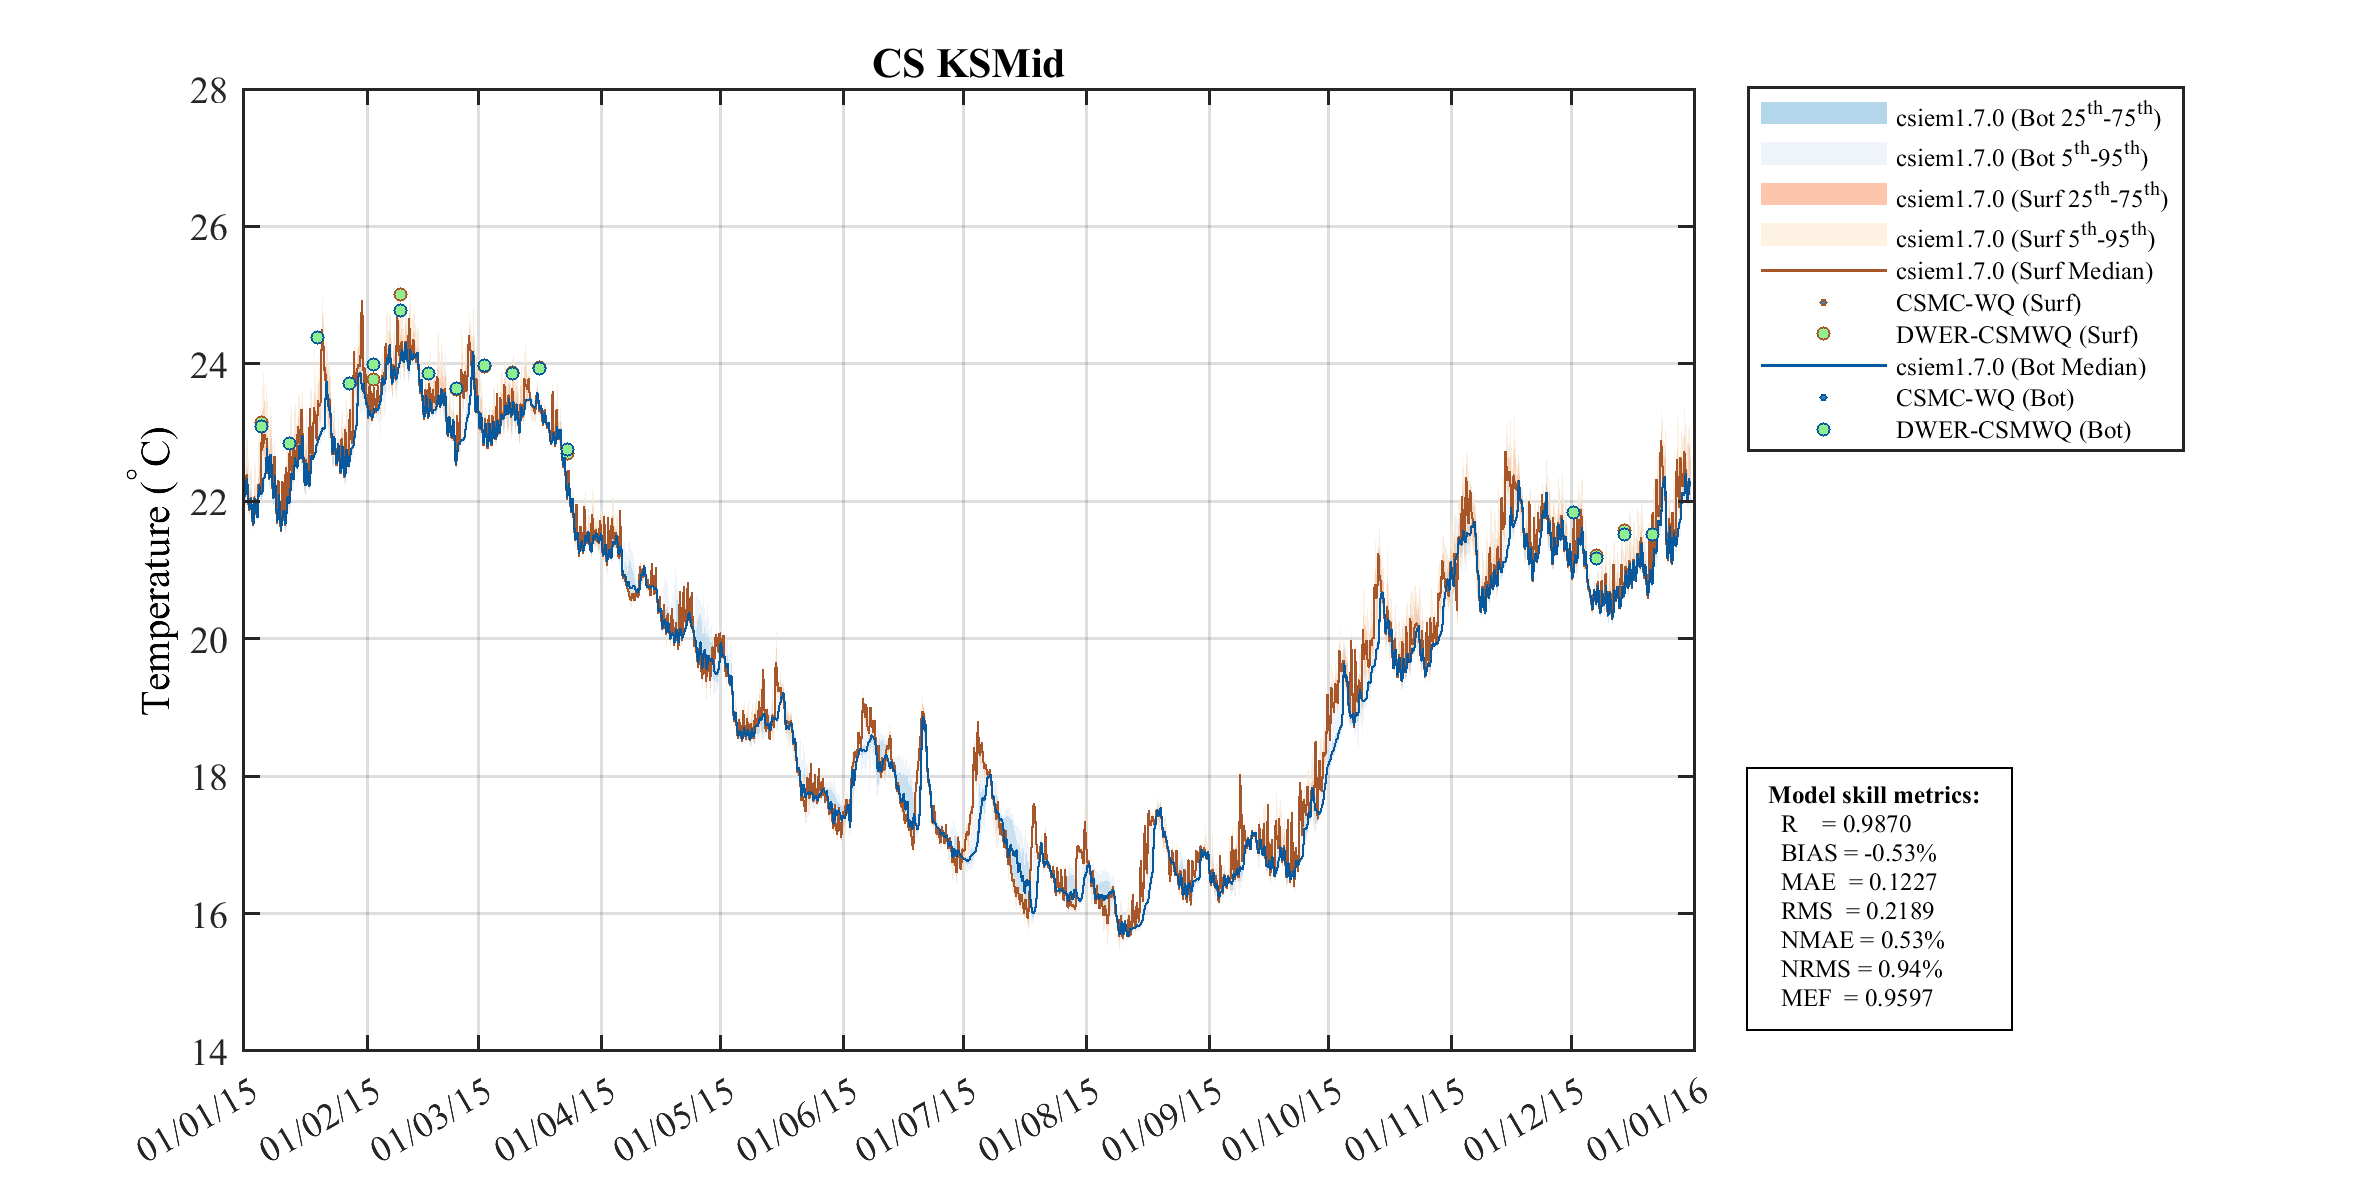
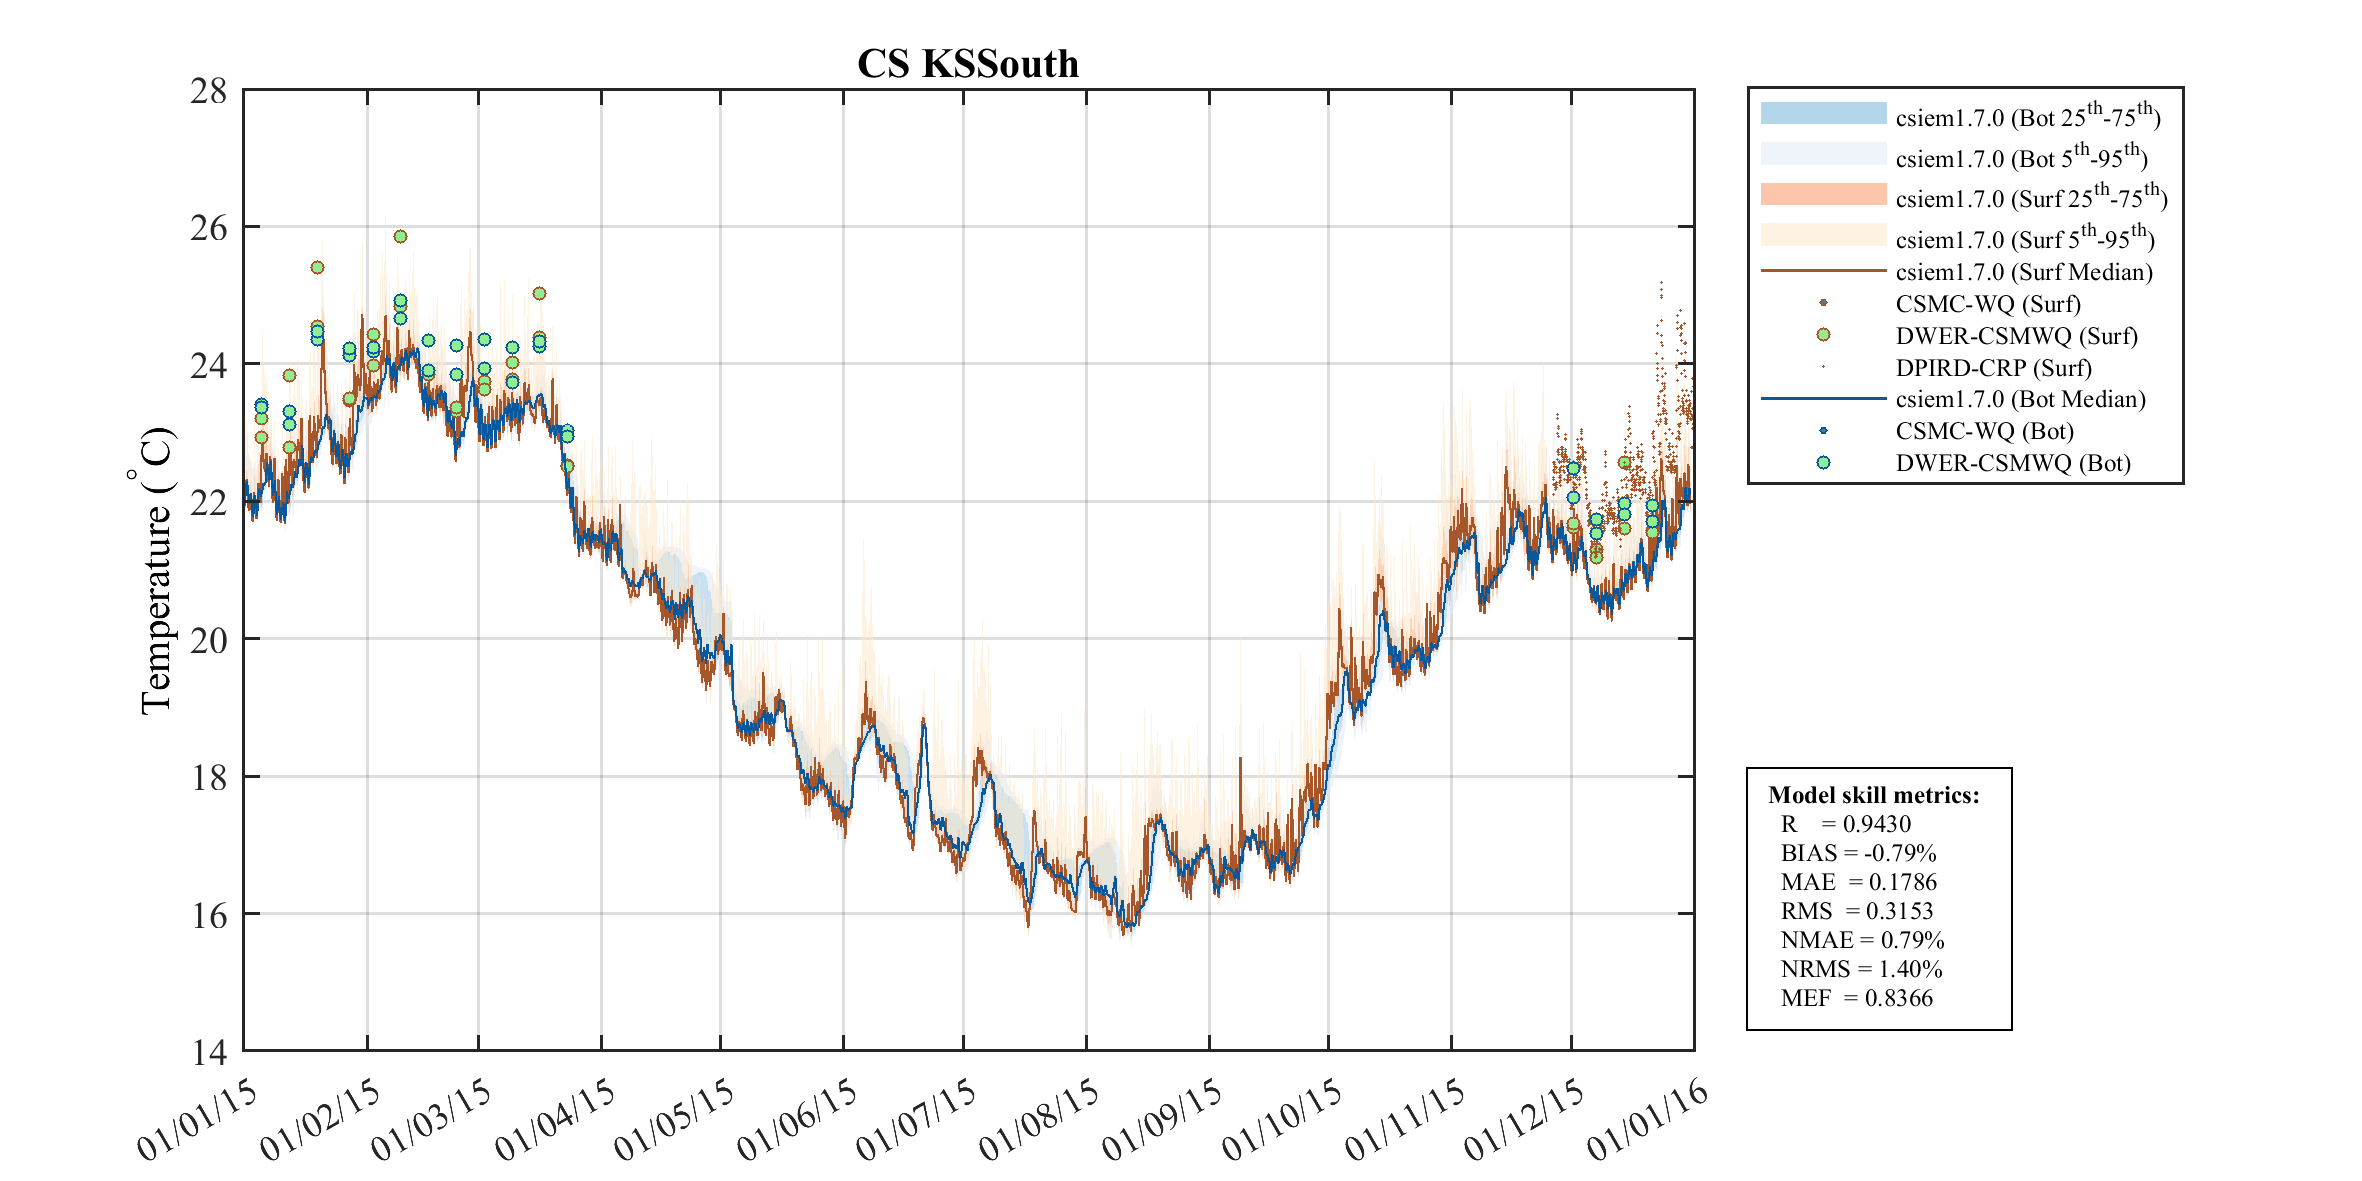
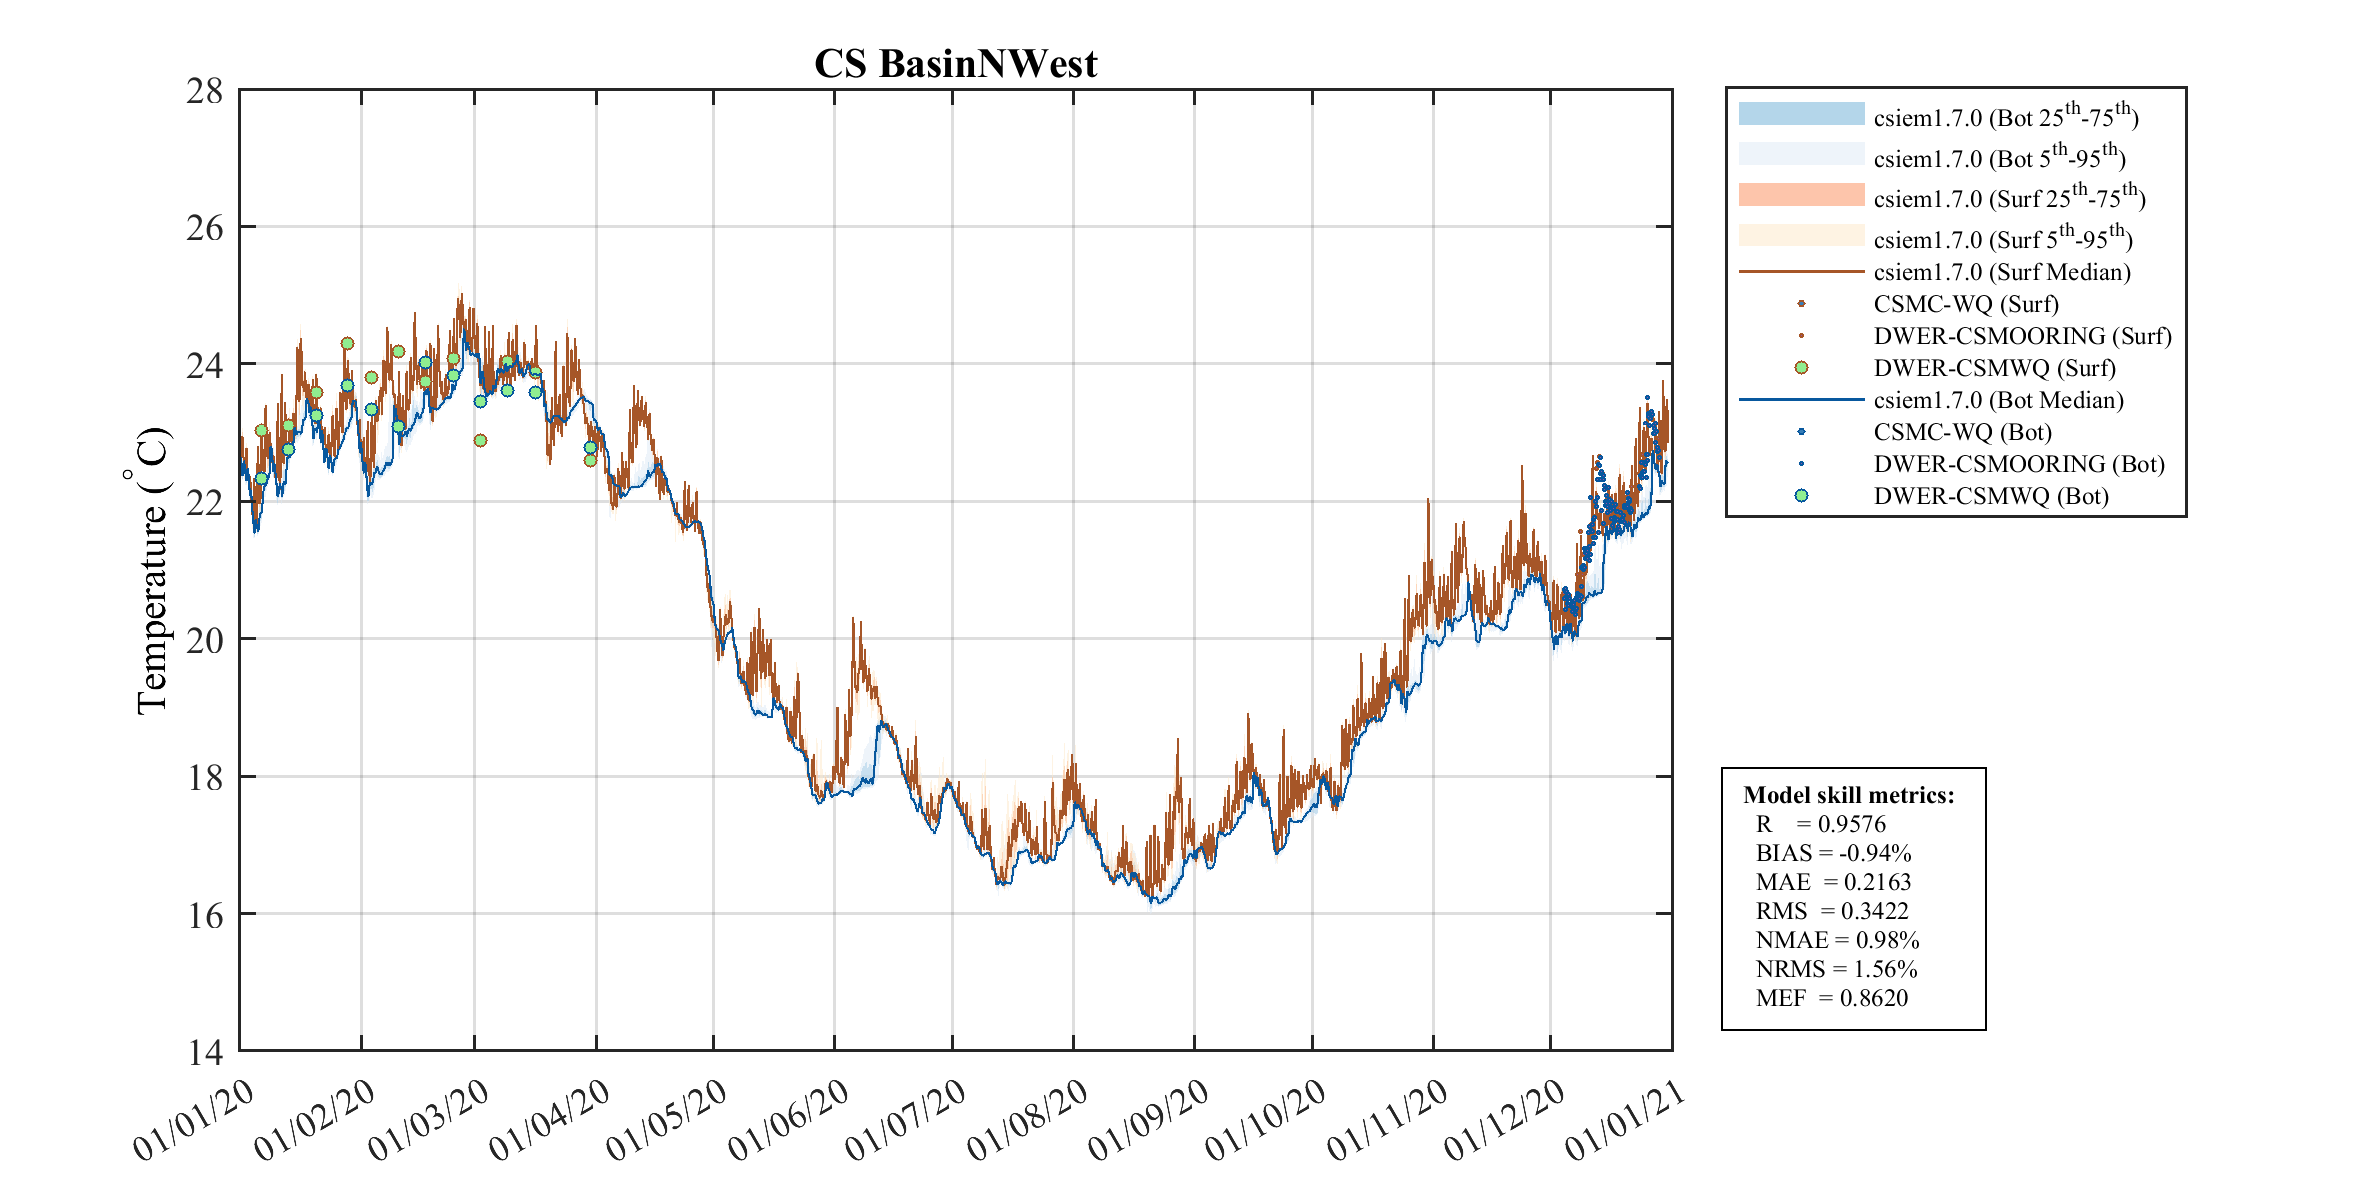
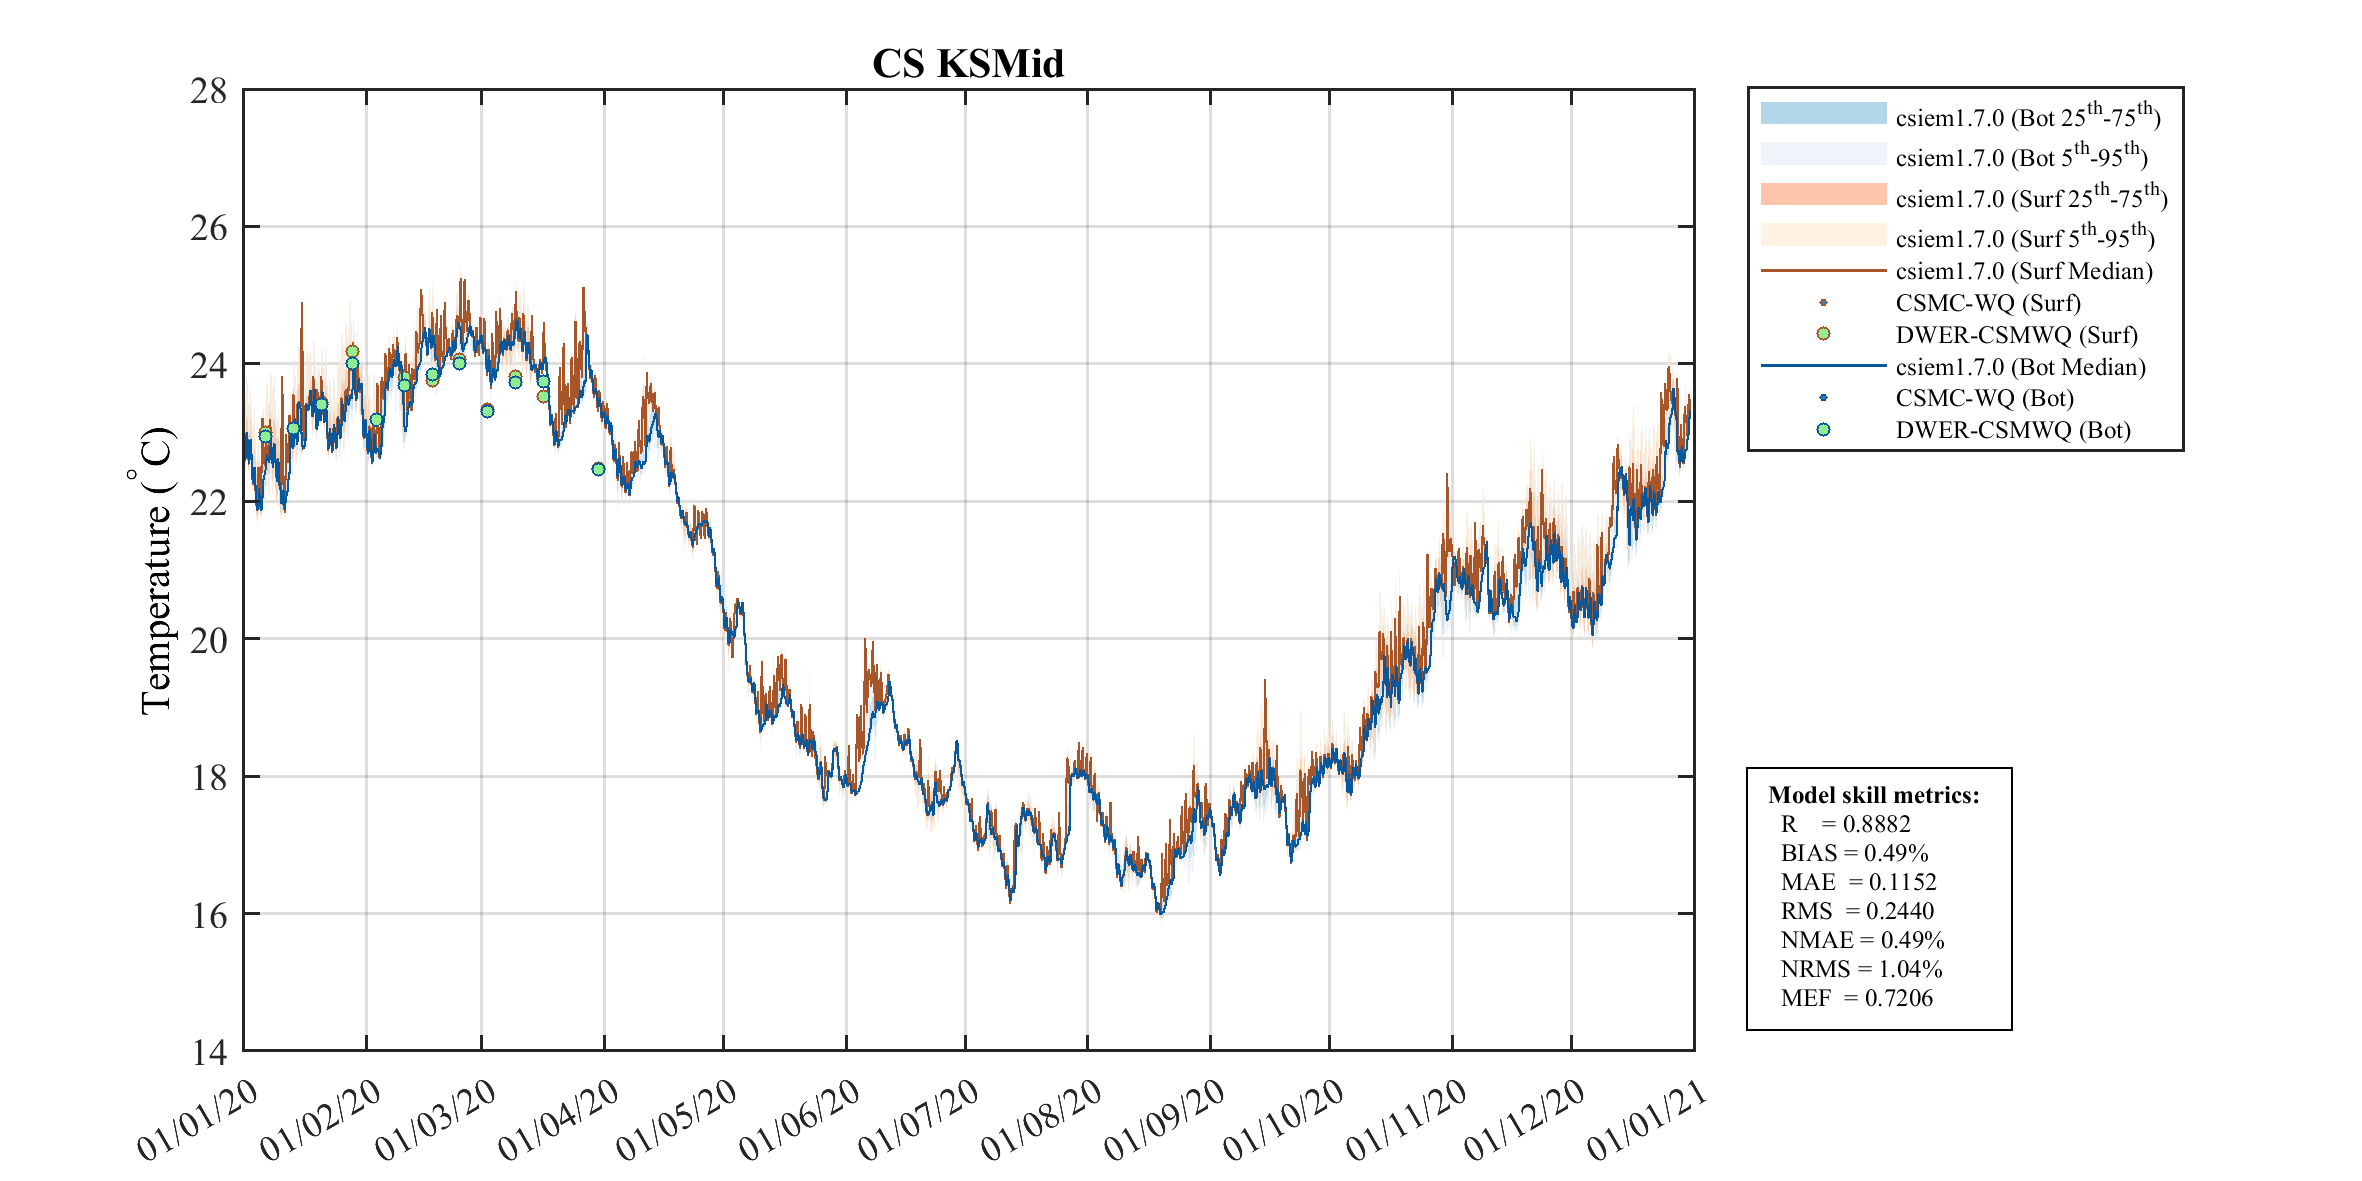
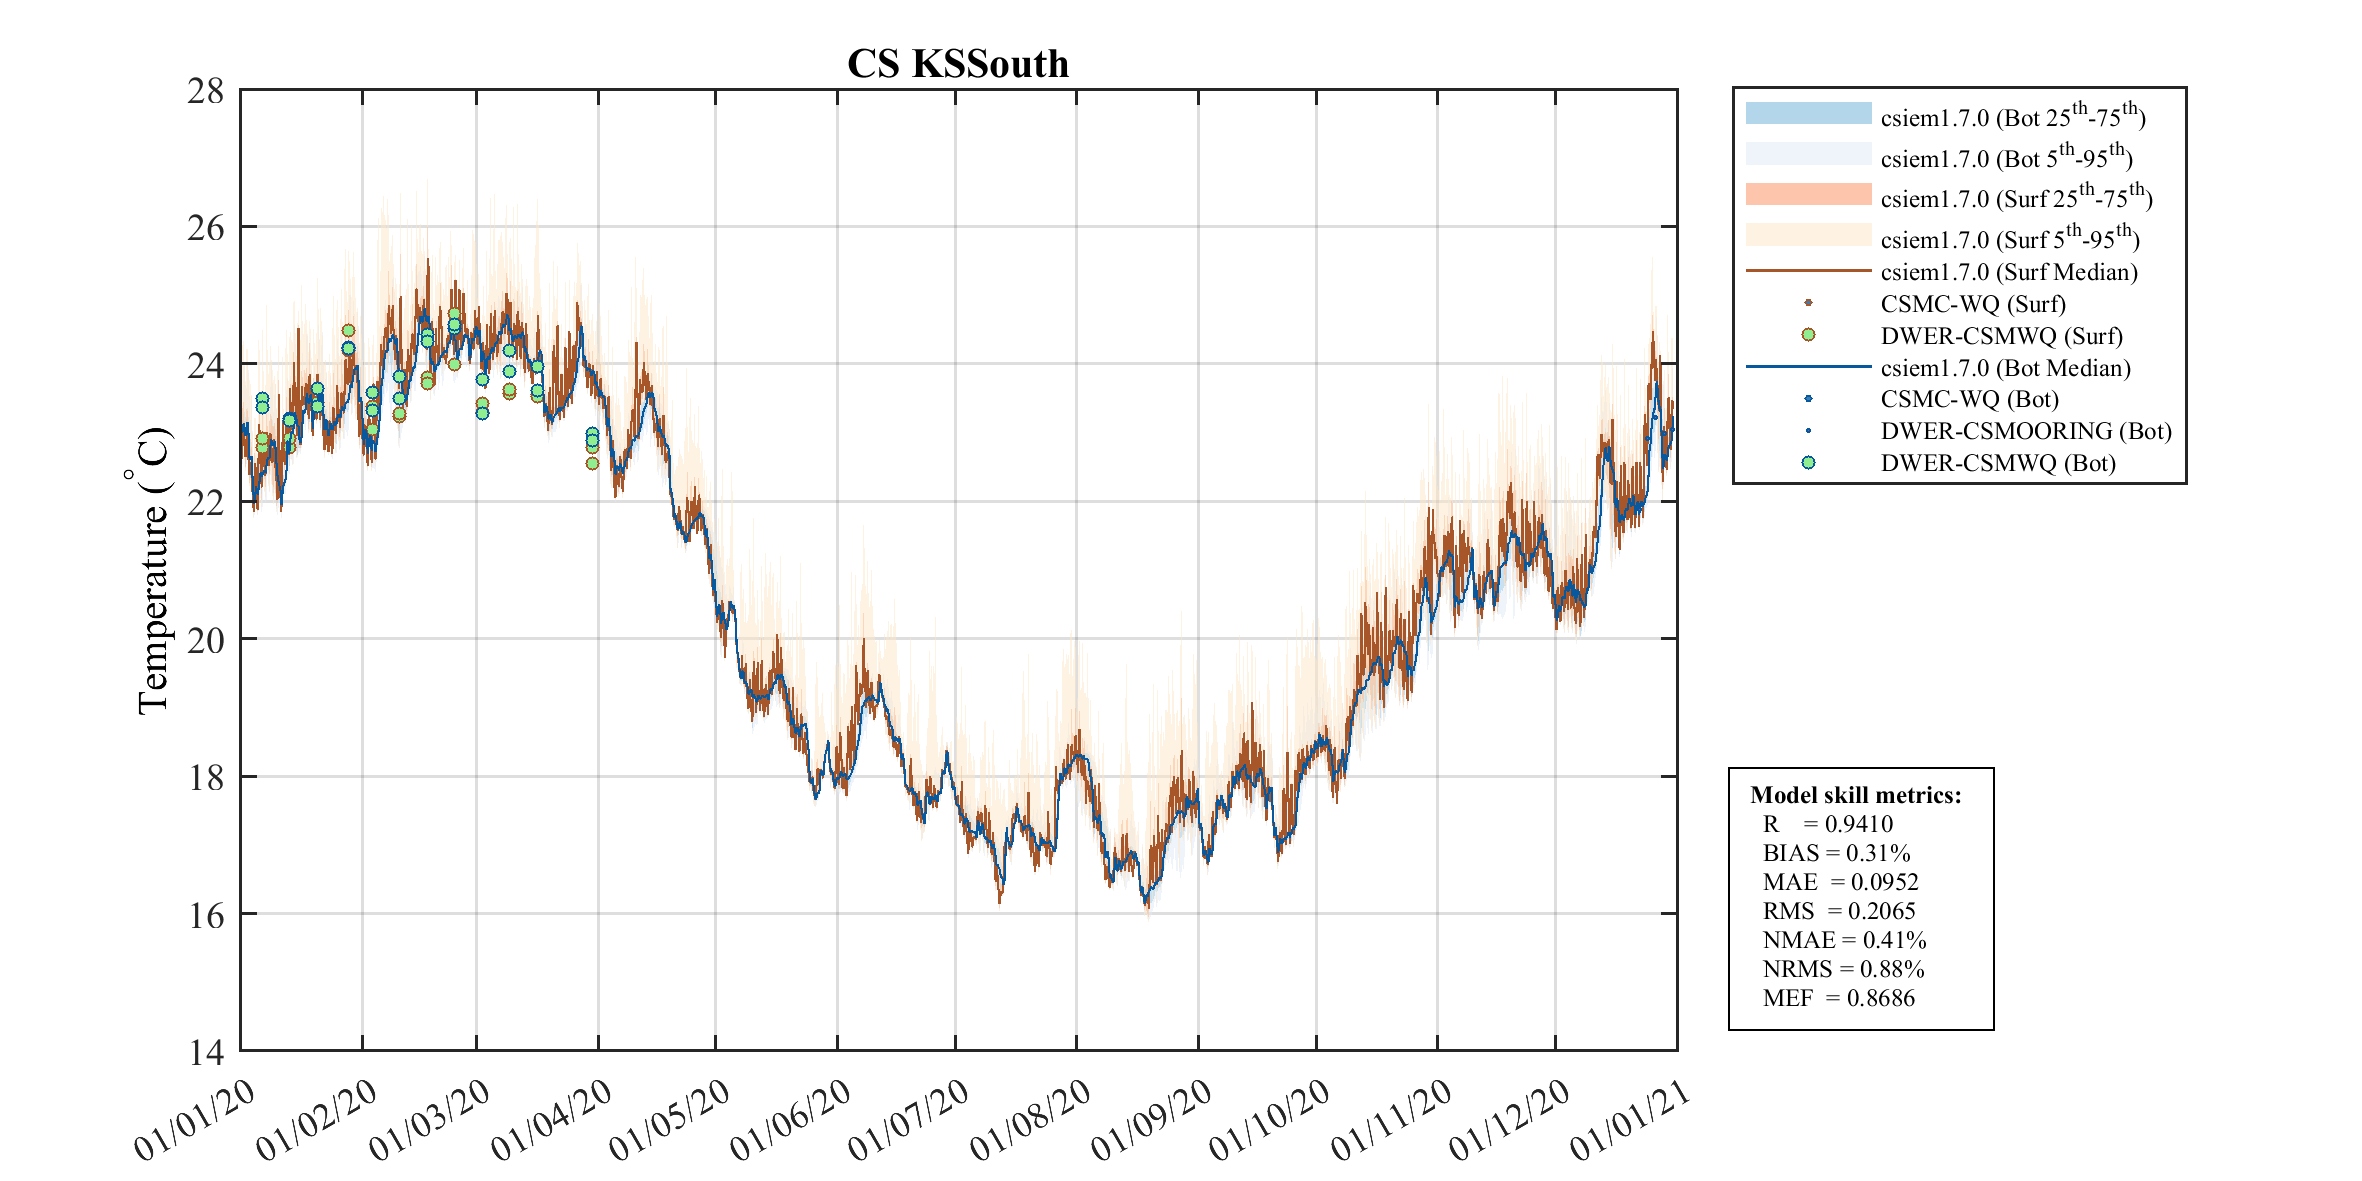
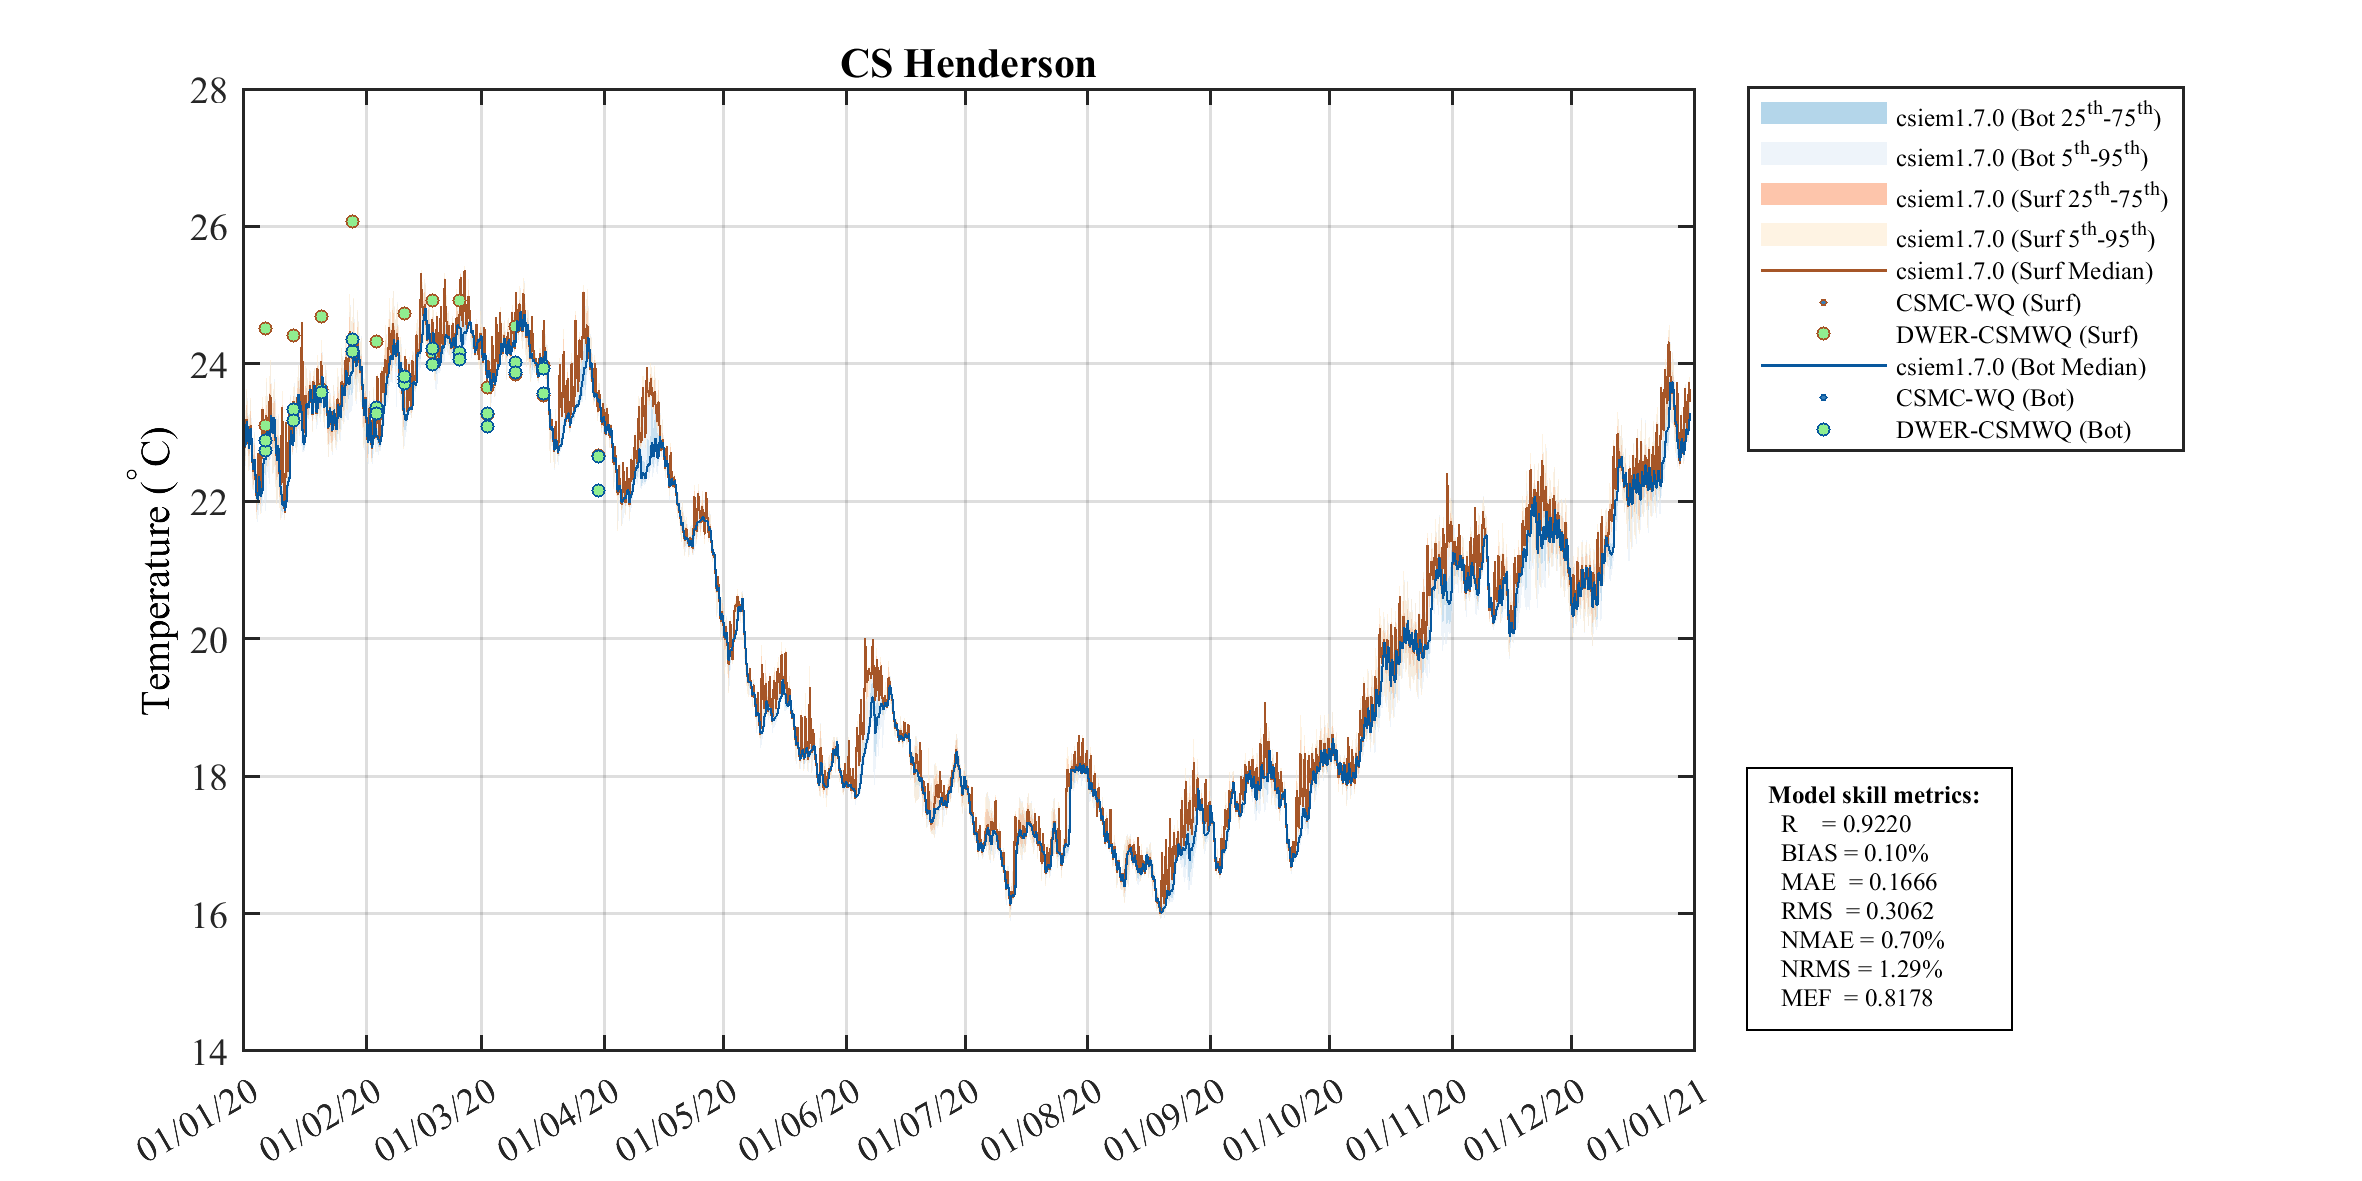
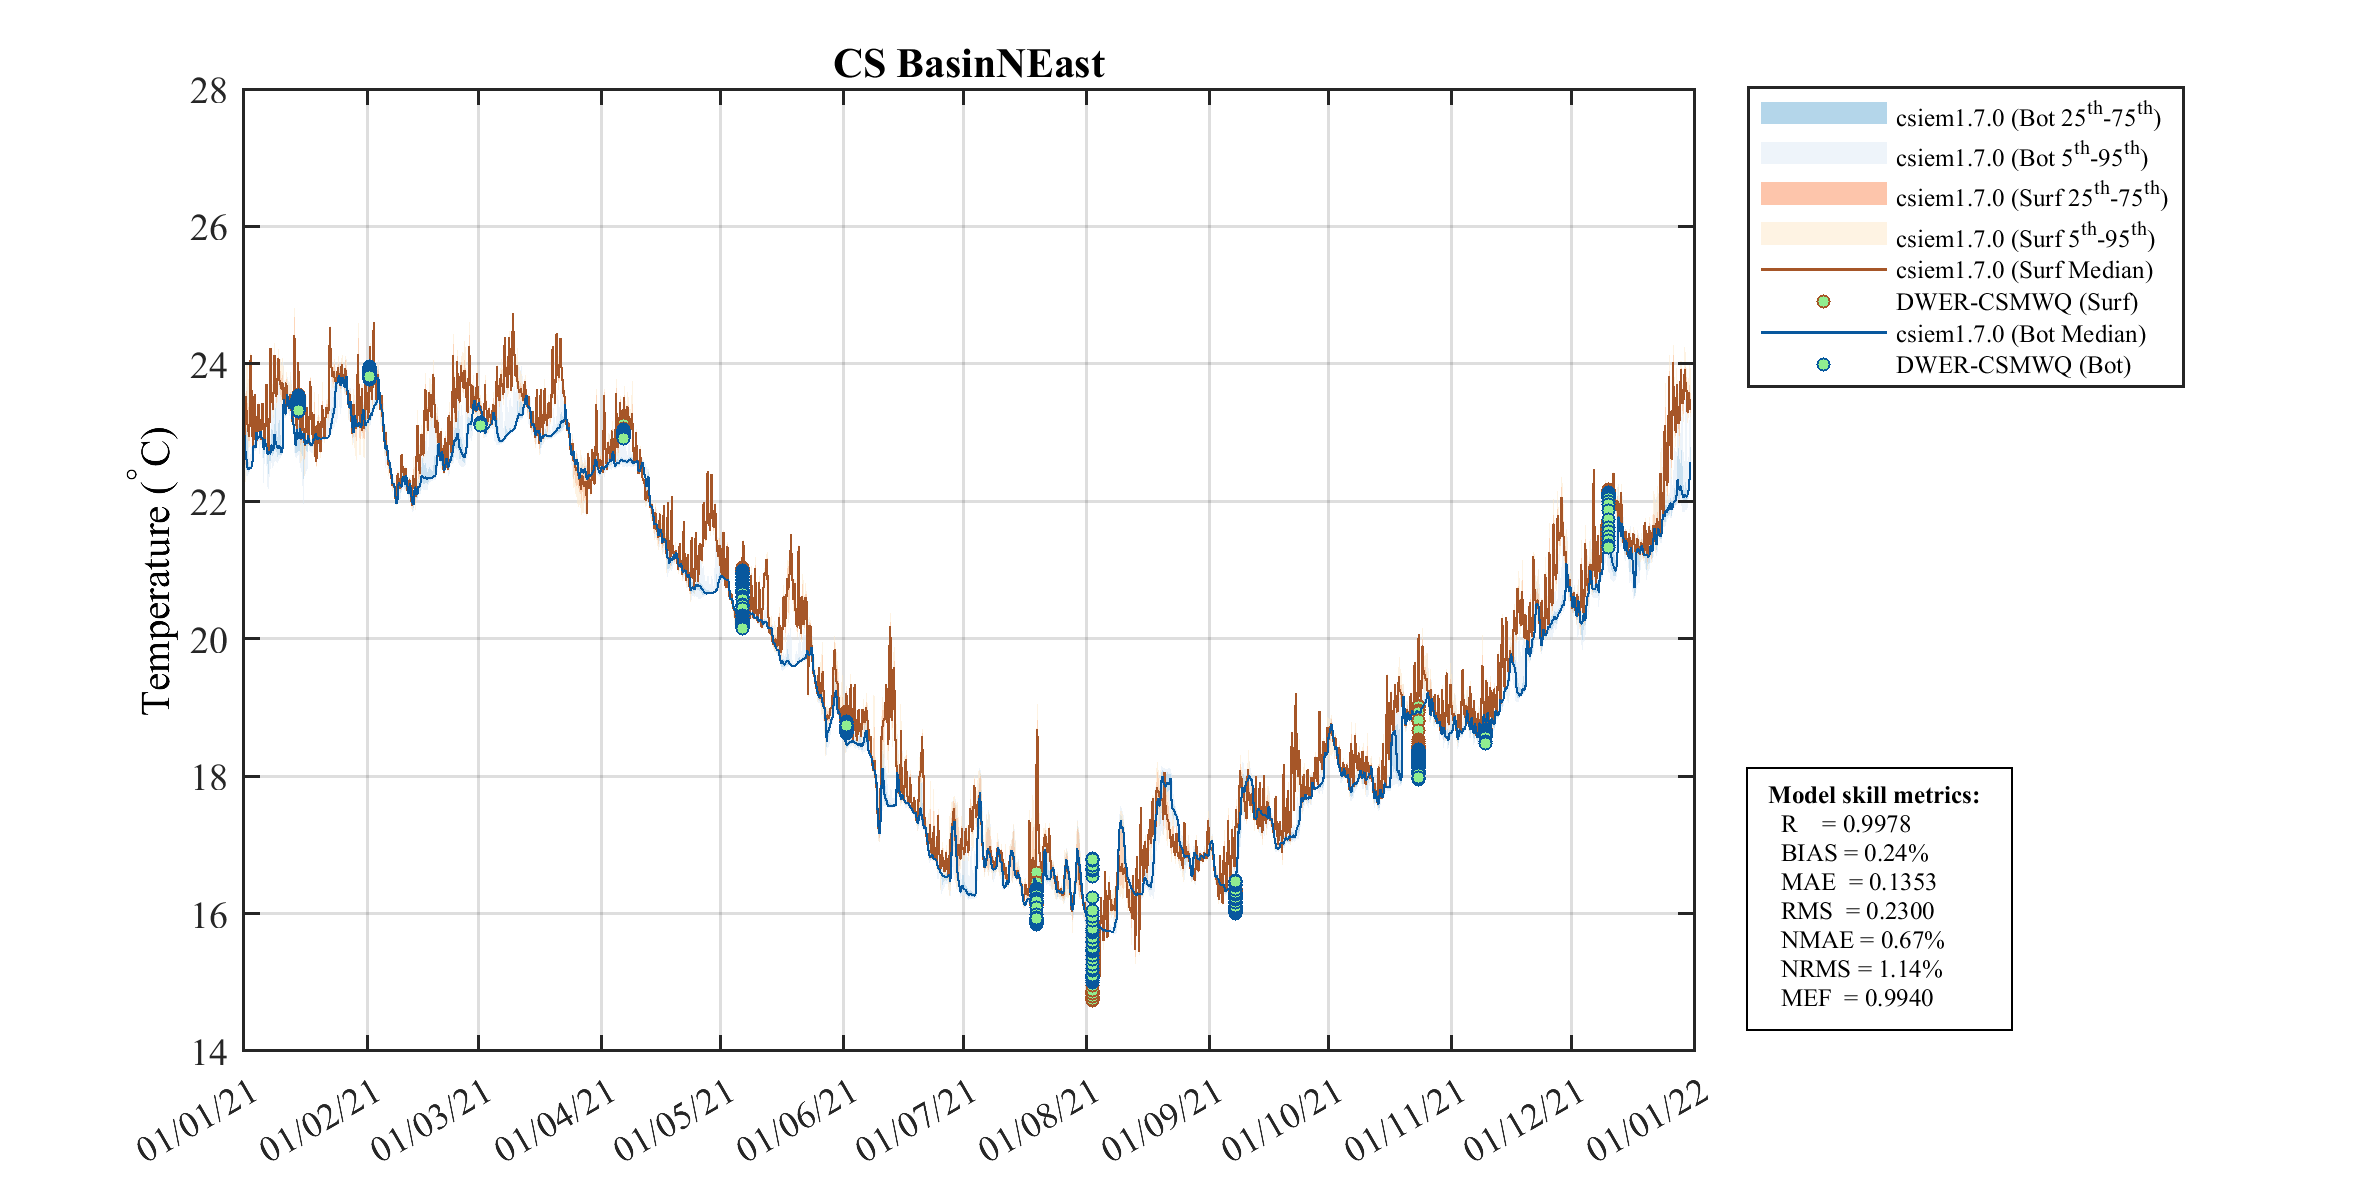
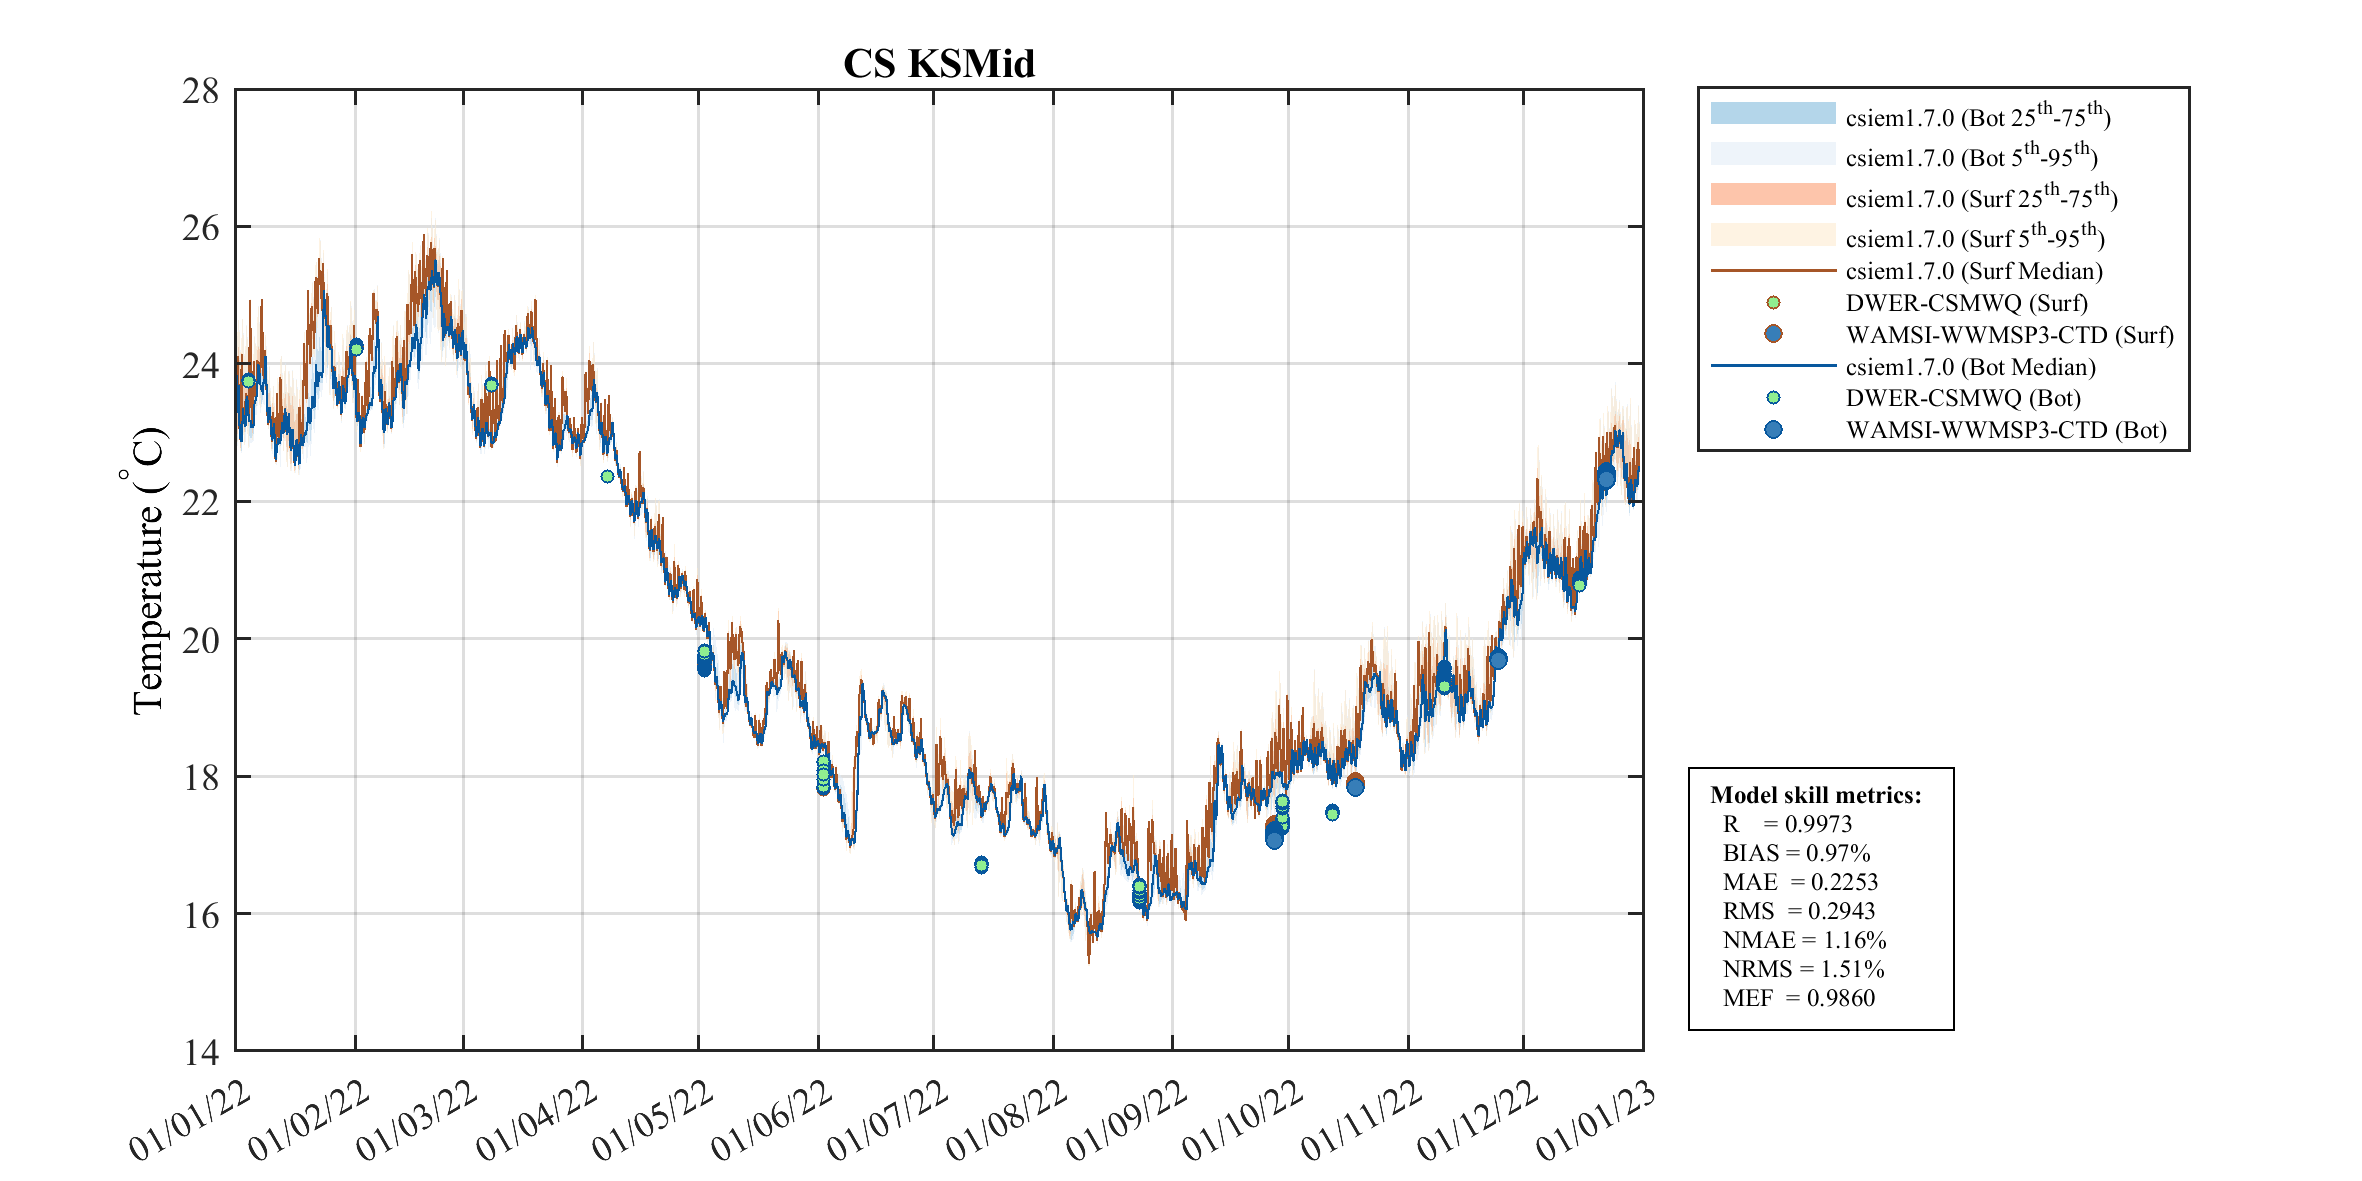
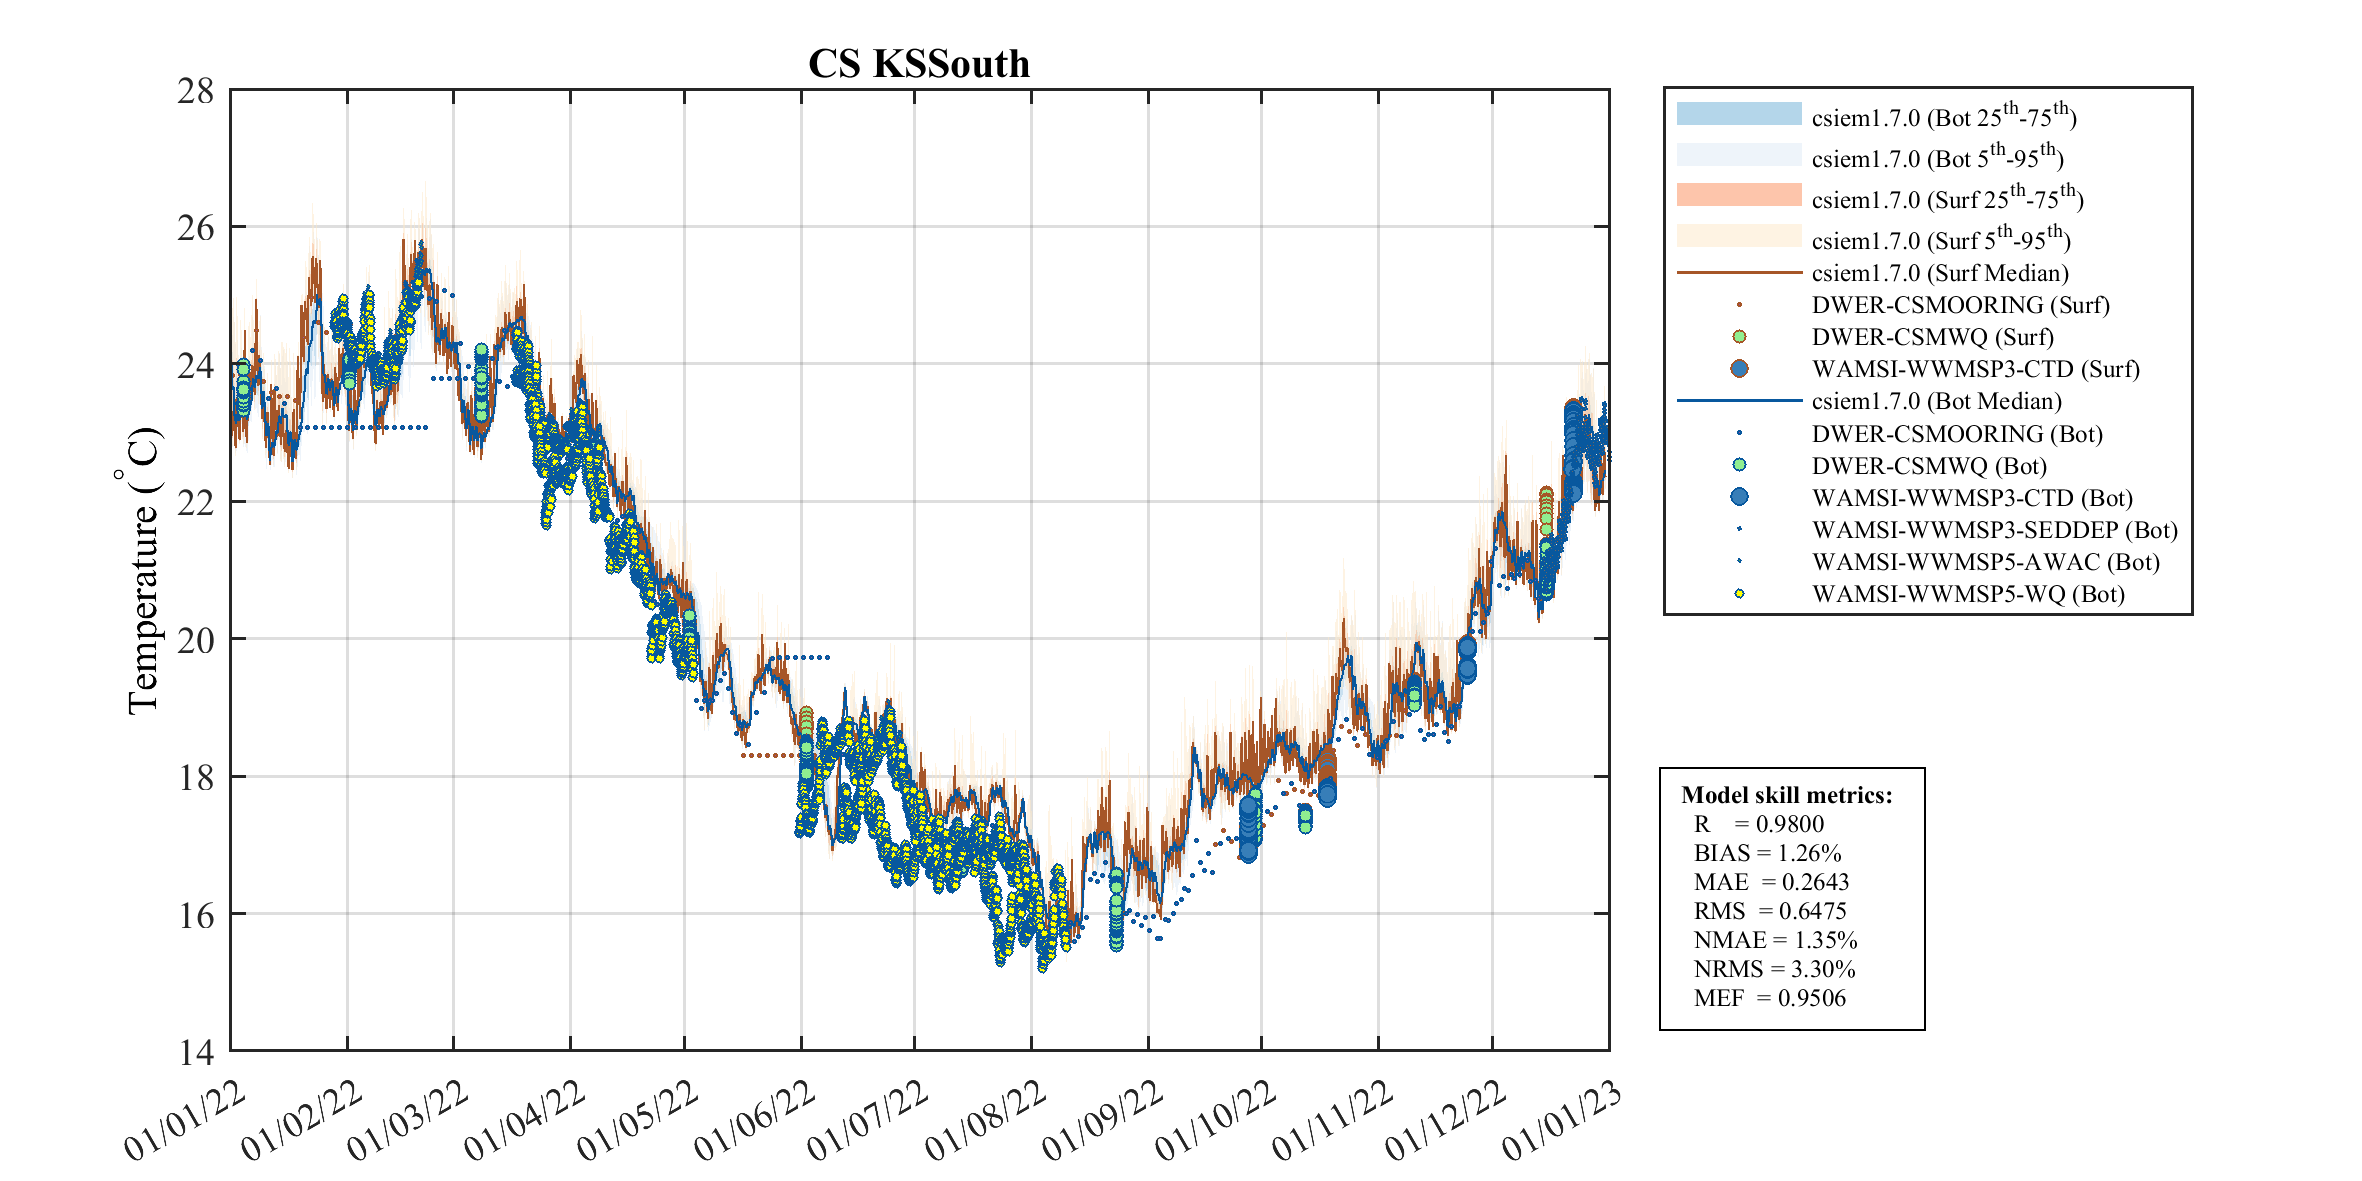
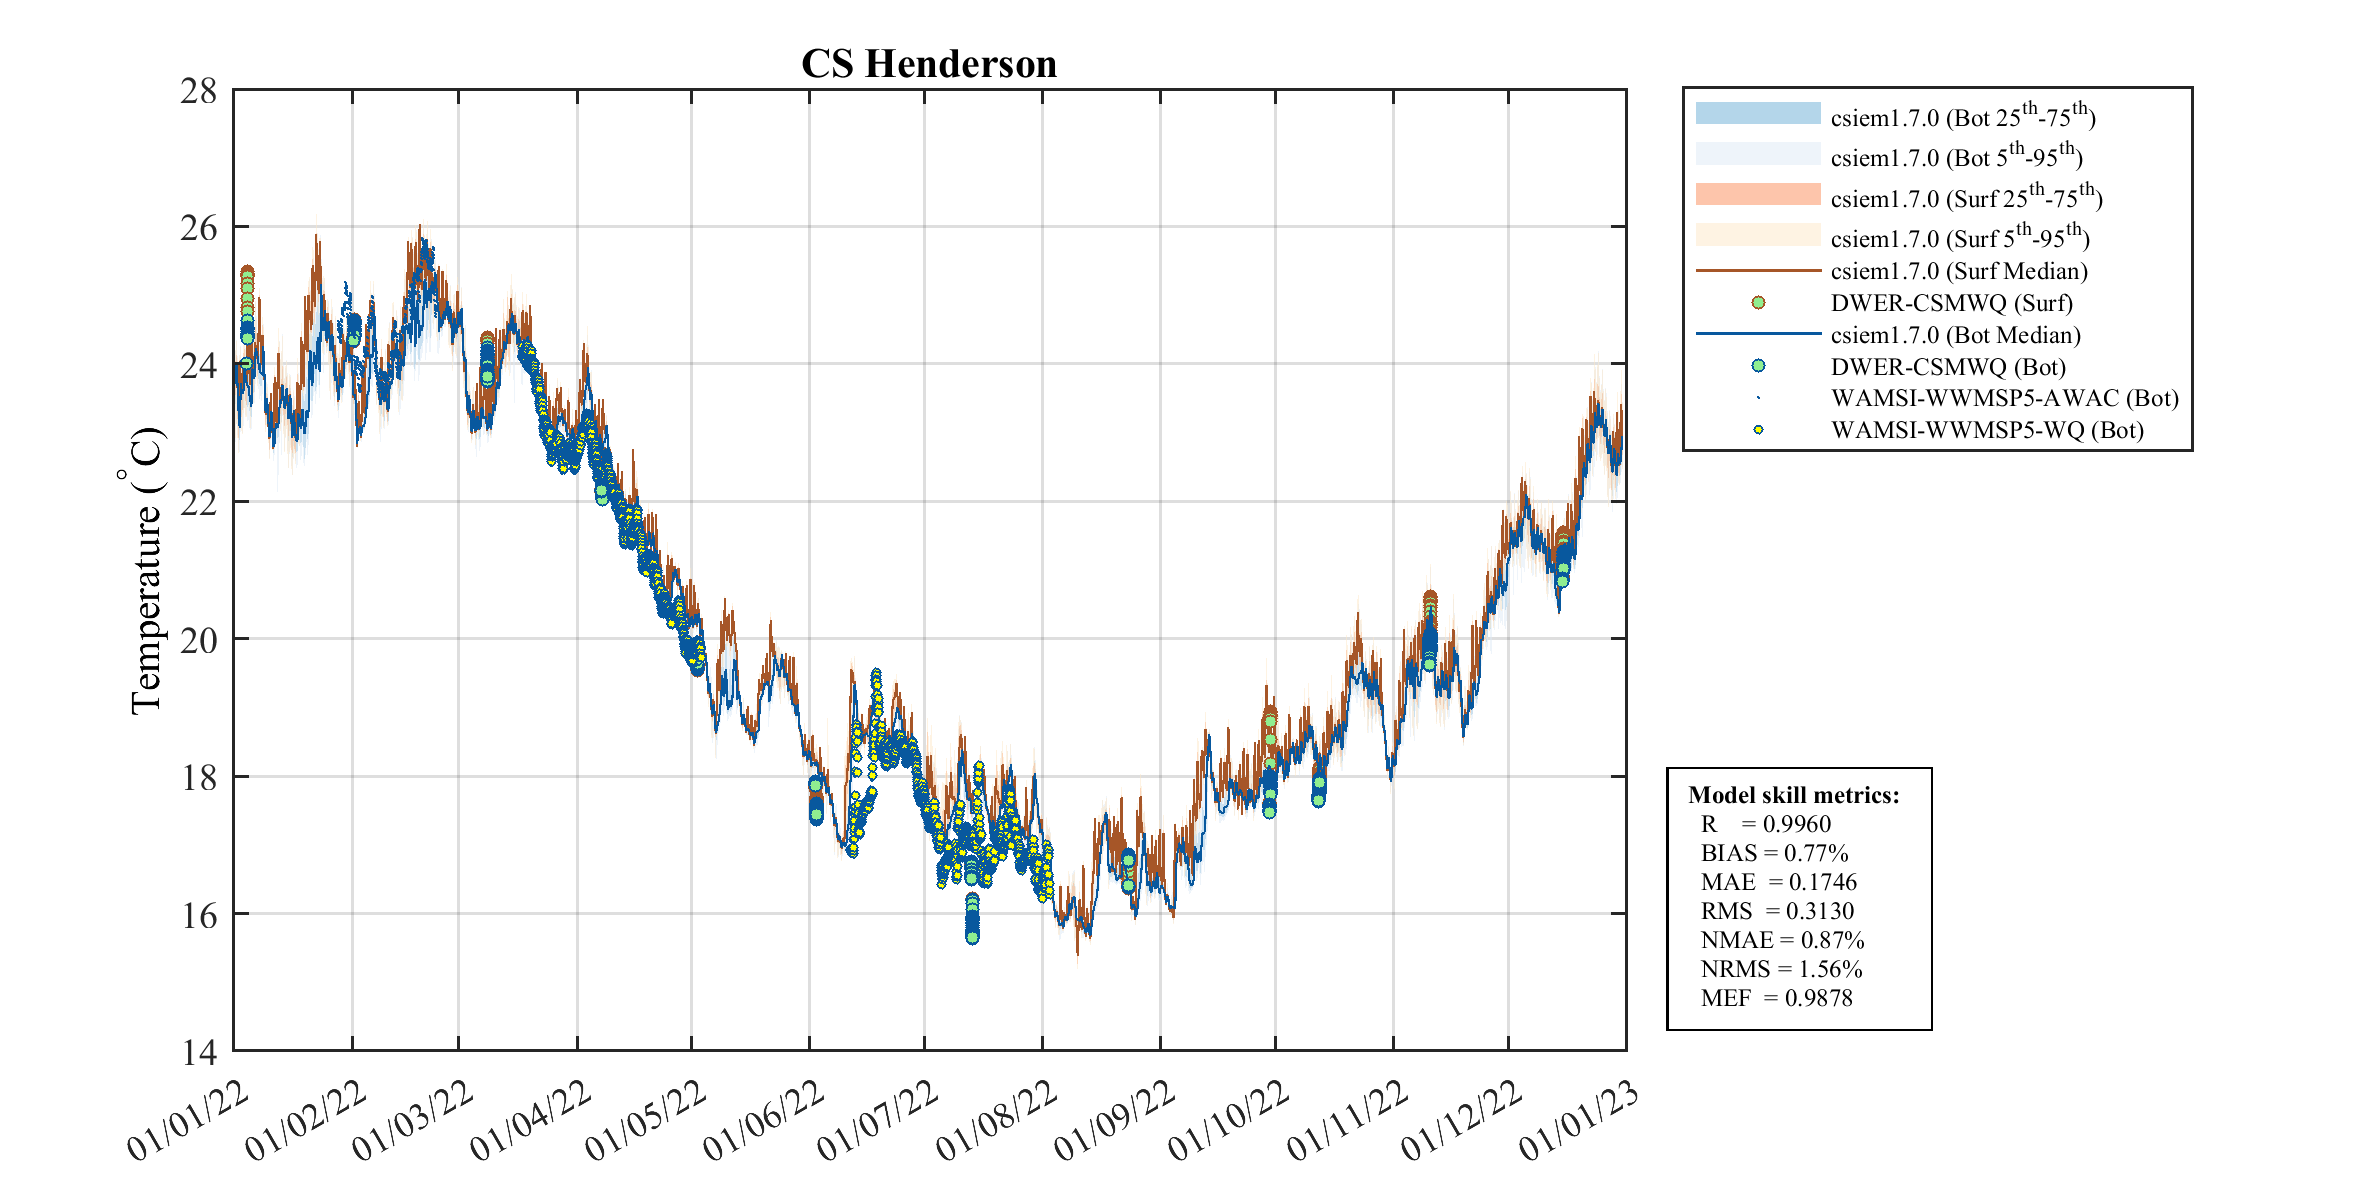
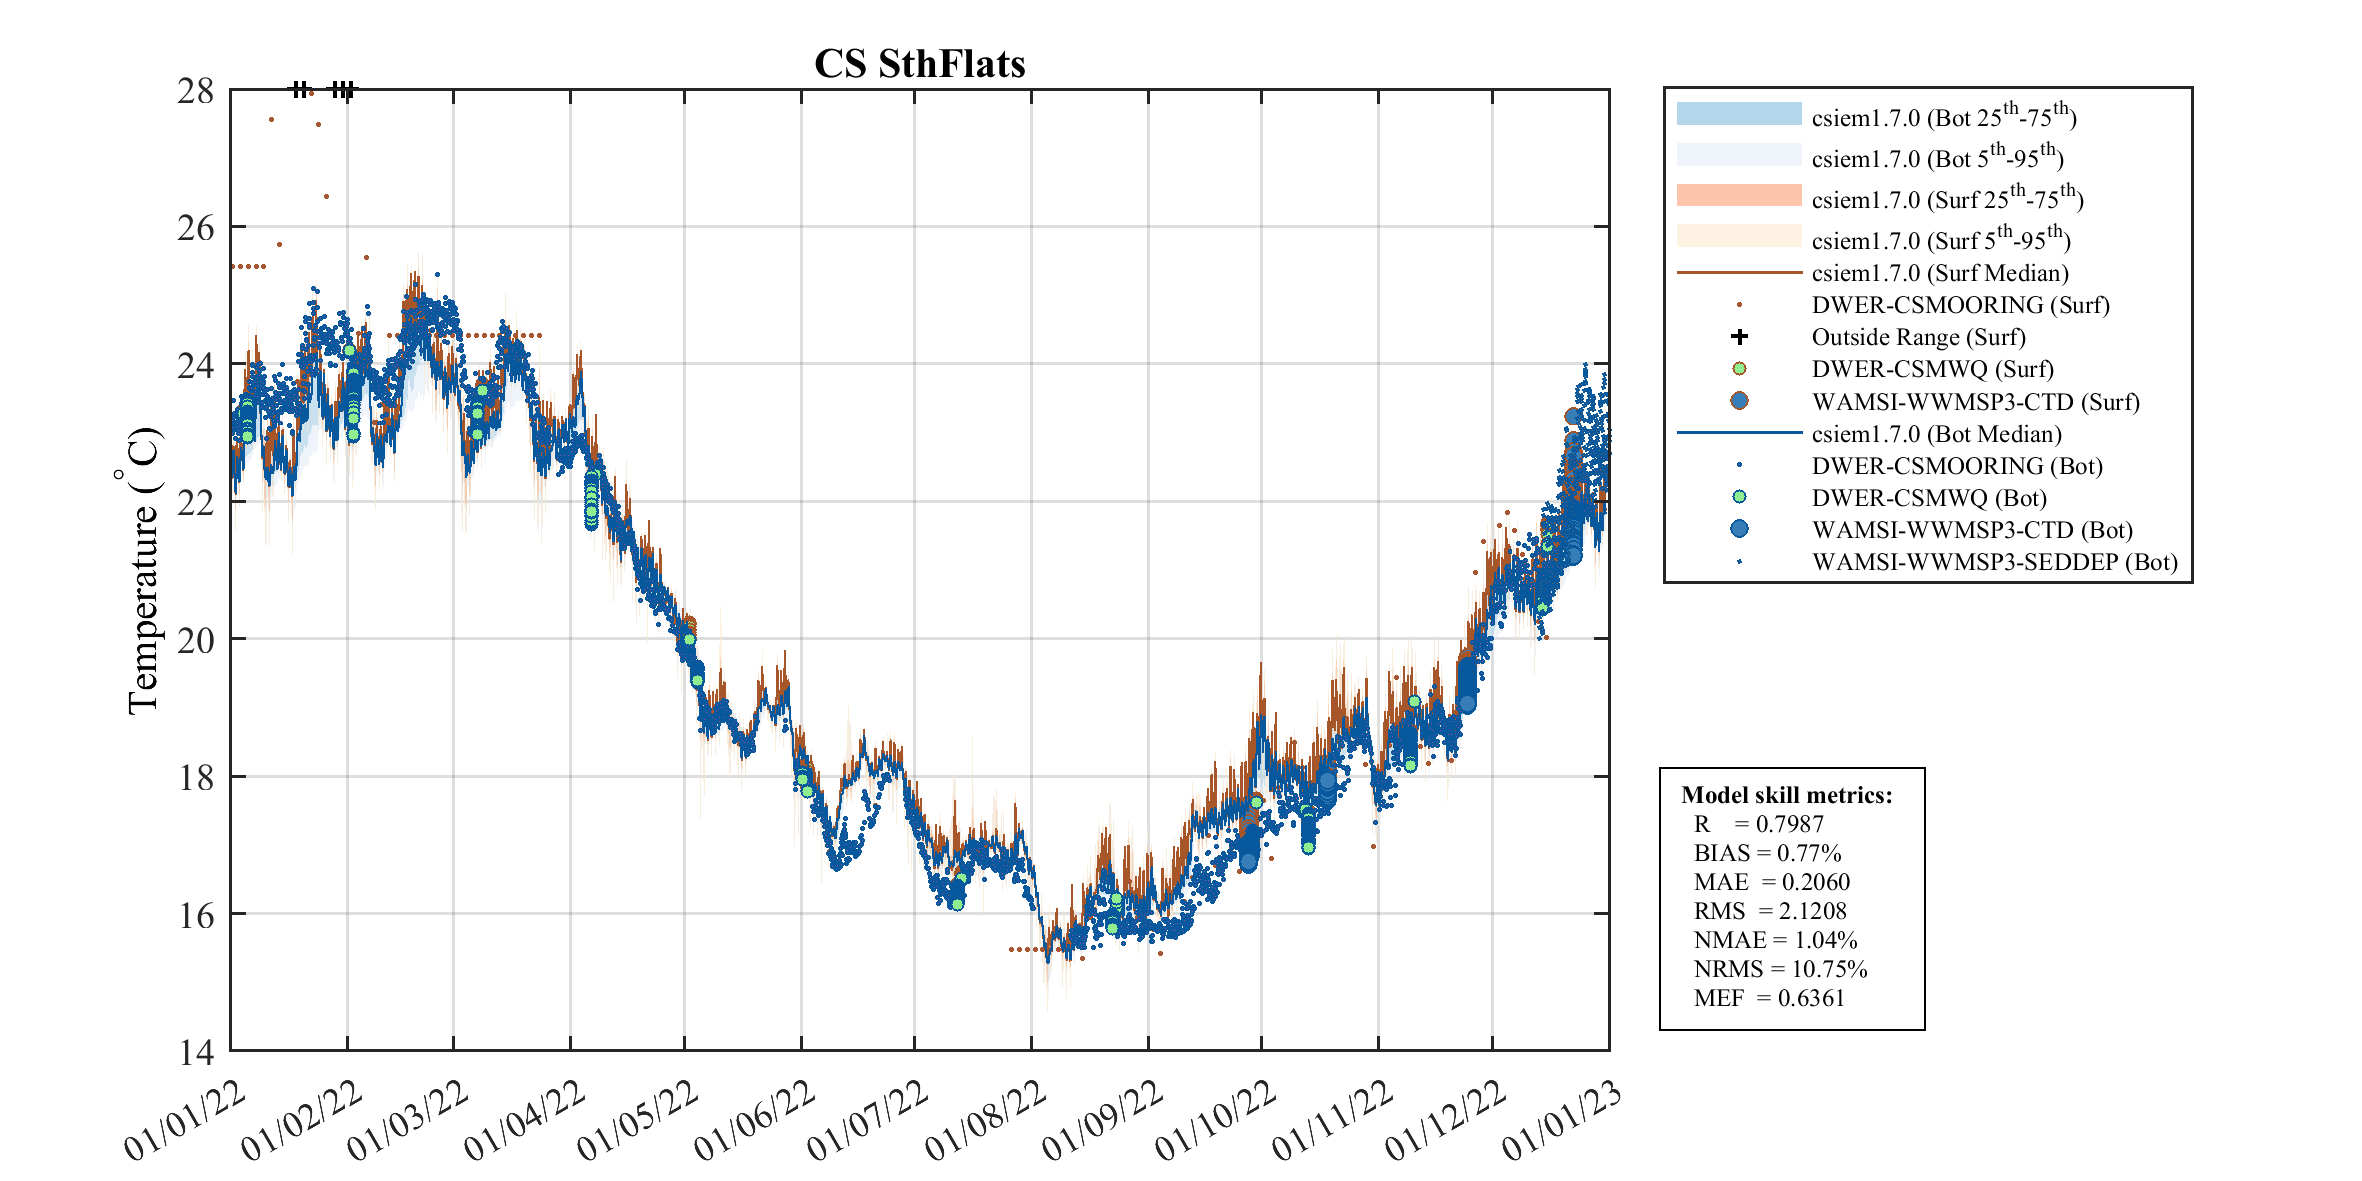
| Cockburn Sound | 0.168 | 0.326 | 0.108 | 0.191 | 0.247 | 0.192 |
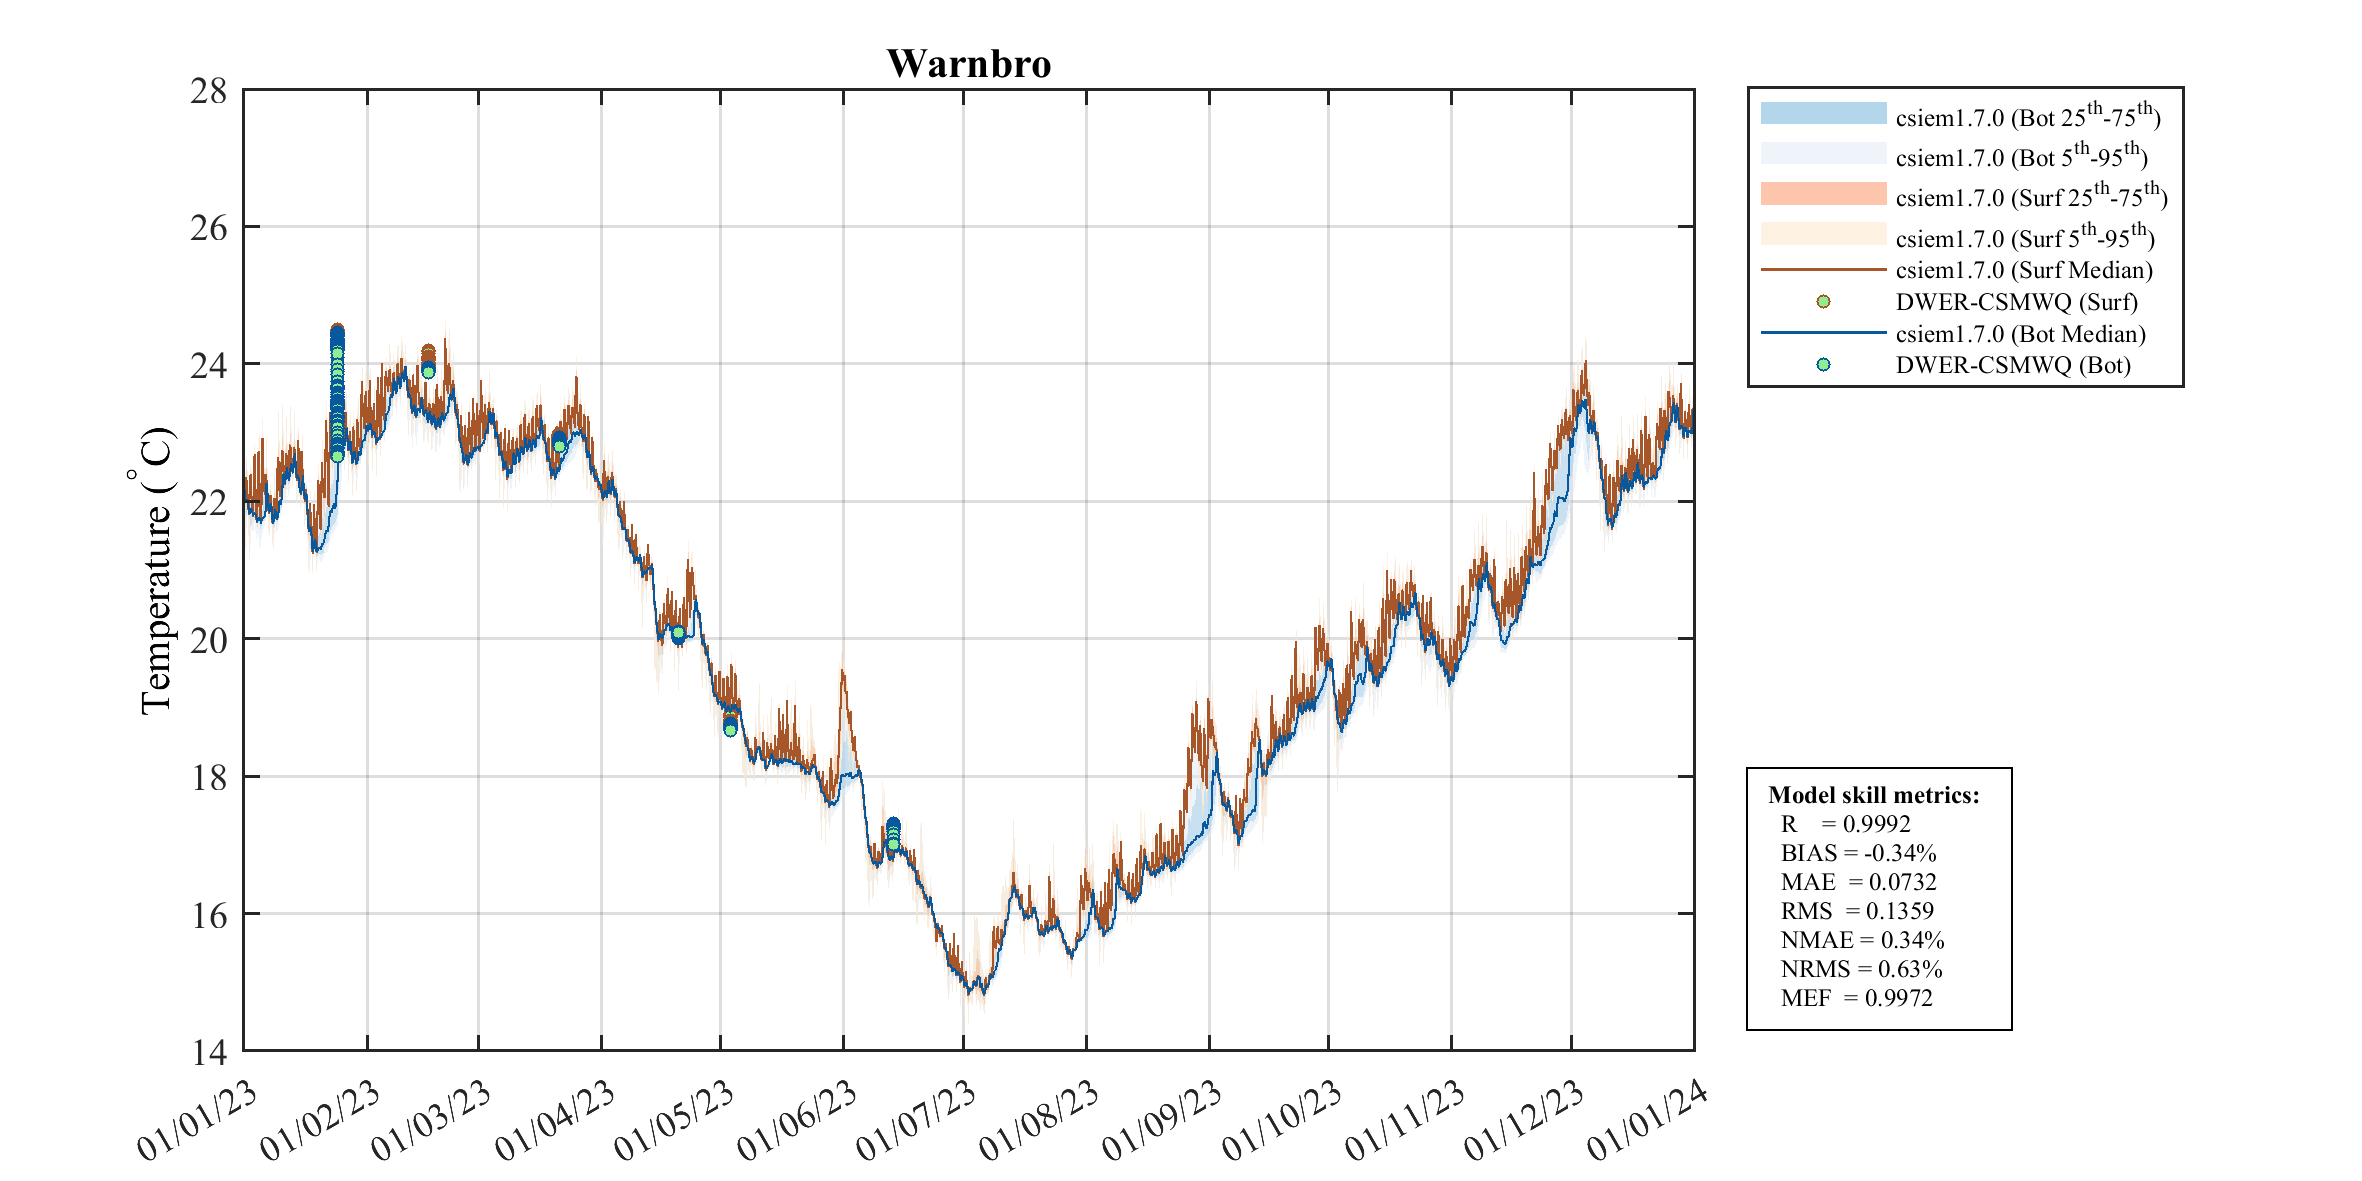
| South | 0.090 | 0.172 | 0.127 | 0.144 | 0.096 | 0.119 |
Correlation Coefficient (R)
| Section | 2013 | 2015 | 2020 | 2021 | 2022 | 2023 |
|---|---|---|---|---|---|---|
| North (Gage Roads) | 0.998 | 0.992 | 0.988 | 0.995 | 0.983 | 0.996 |
| Owen Anchorage | — | — | — | 0.990 | 0.997 | 0.998 |
| Cockburn Sound | 0.982 | 0.962 | 0.932 | 0.952 | 0.943 | 0.996 |
| South | 0.993 | 0.991 | 0.977 | 0.997 | 0.998 | 0.993 |
Bias (%)
| Section | 2013 | 2015 | 2020 | 2021 | 2022 | 2023 |
|---|---|---|---|---|---|---|
| North (Gage Roads) | -0.33 | -0.37 | +0.23 | -0.32 | -0.19 | +0.08 |
| Owen Anchorage | — | — | — | +0.26 | +0.16 | -0.01 |
| Cockburn Sound | -0.60 | -2.18 | -0.12 | +0.63 | -0.00 | -0.54 |
| South | -0.36 | -0.51 | +0.07 | +0.72 | +0.50 | -0.38 |
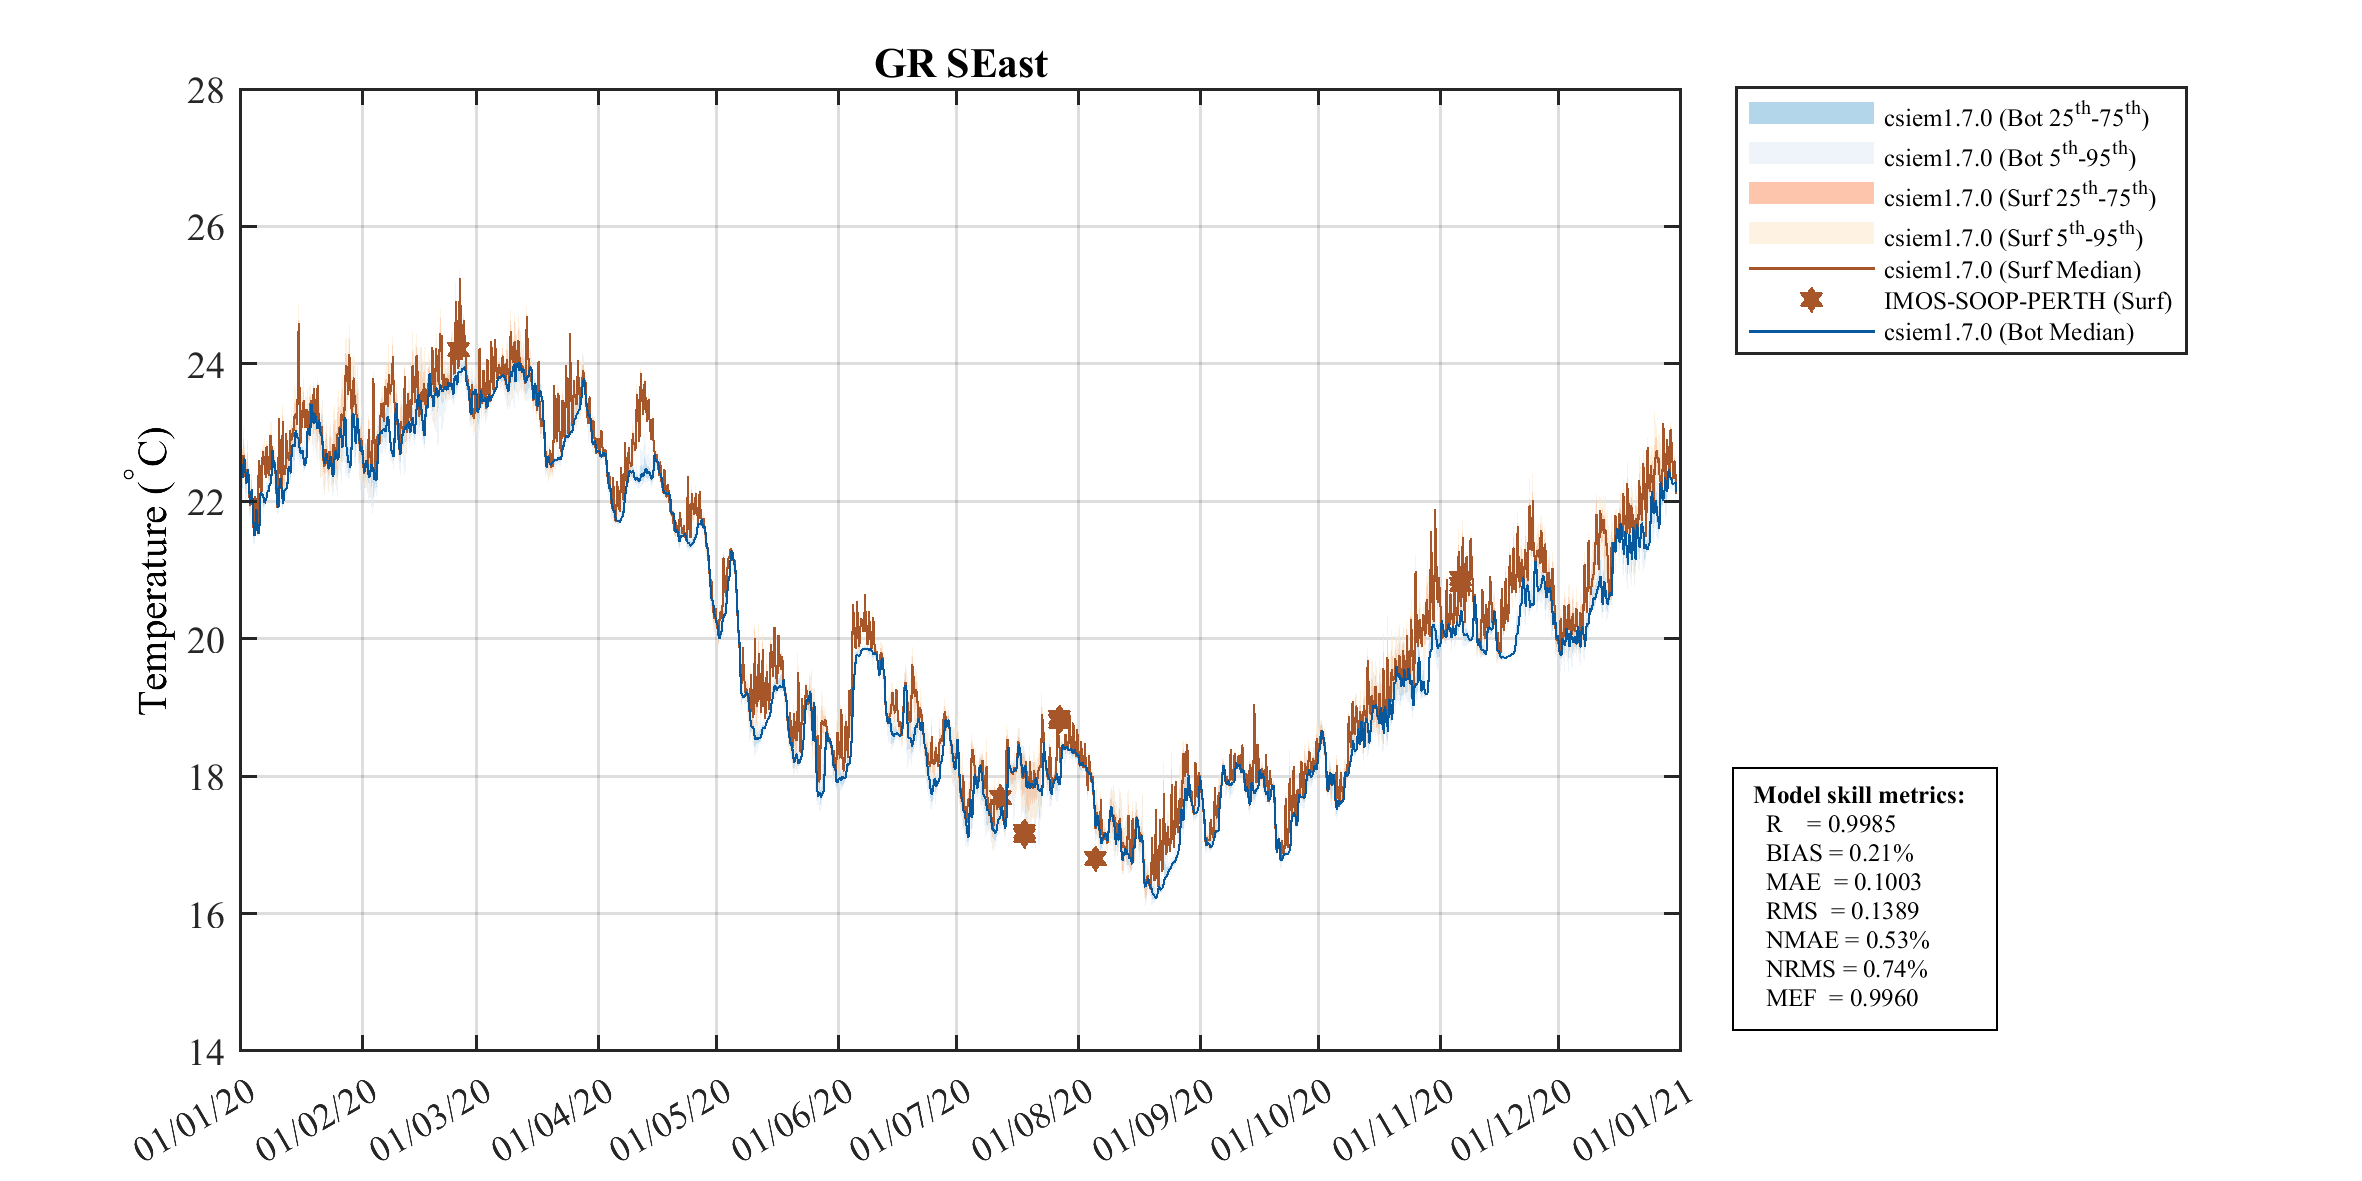
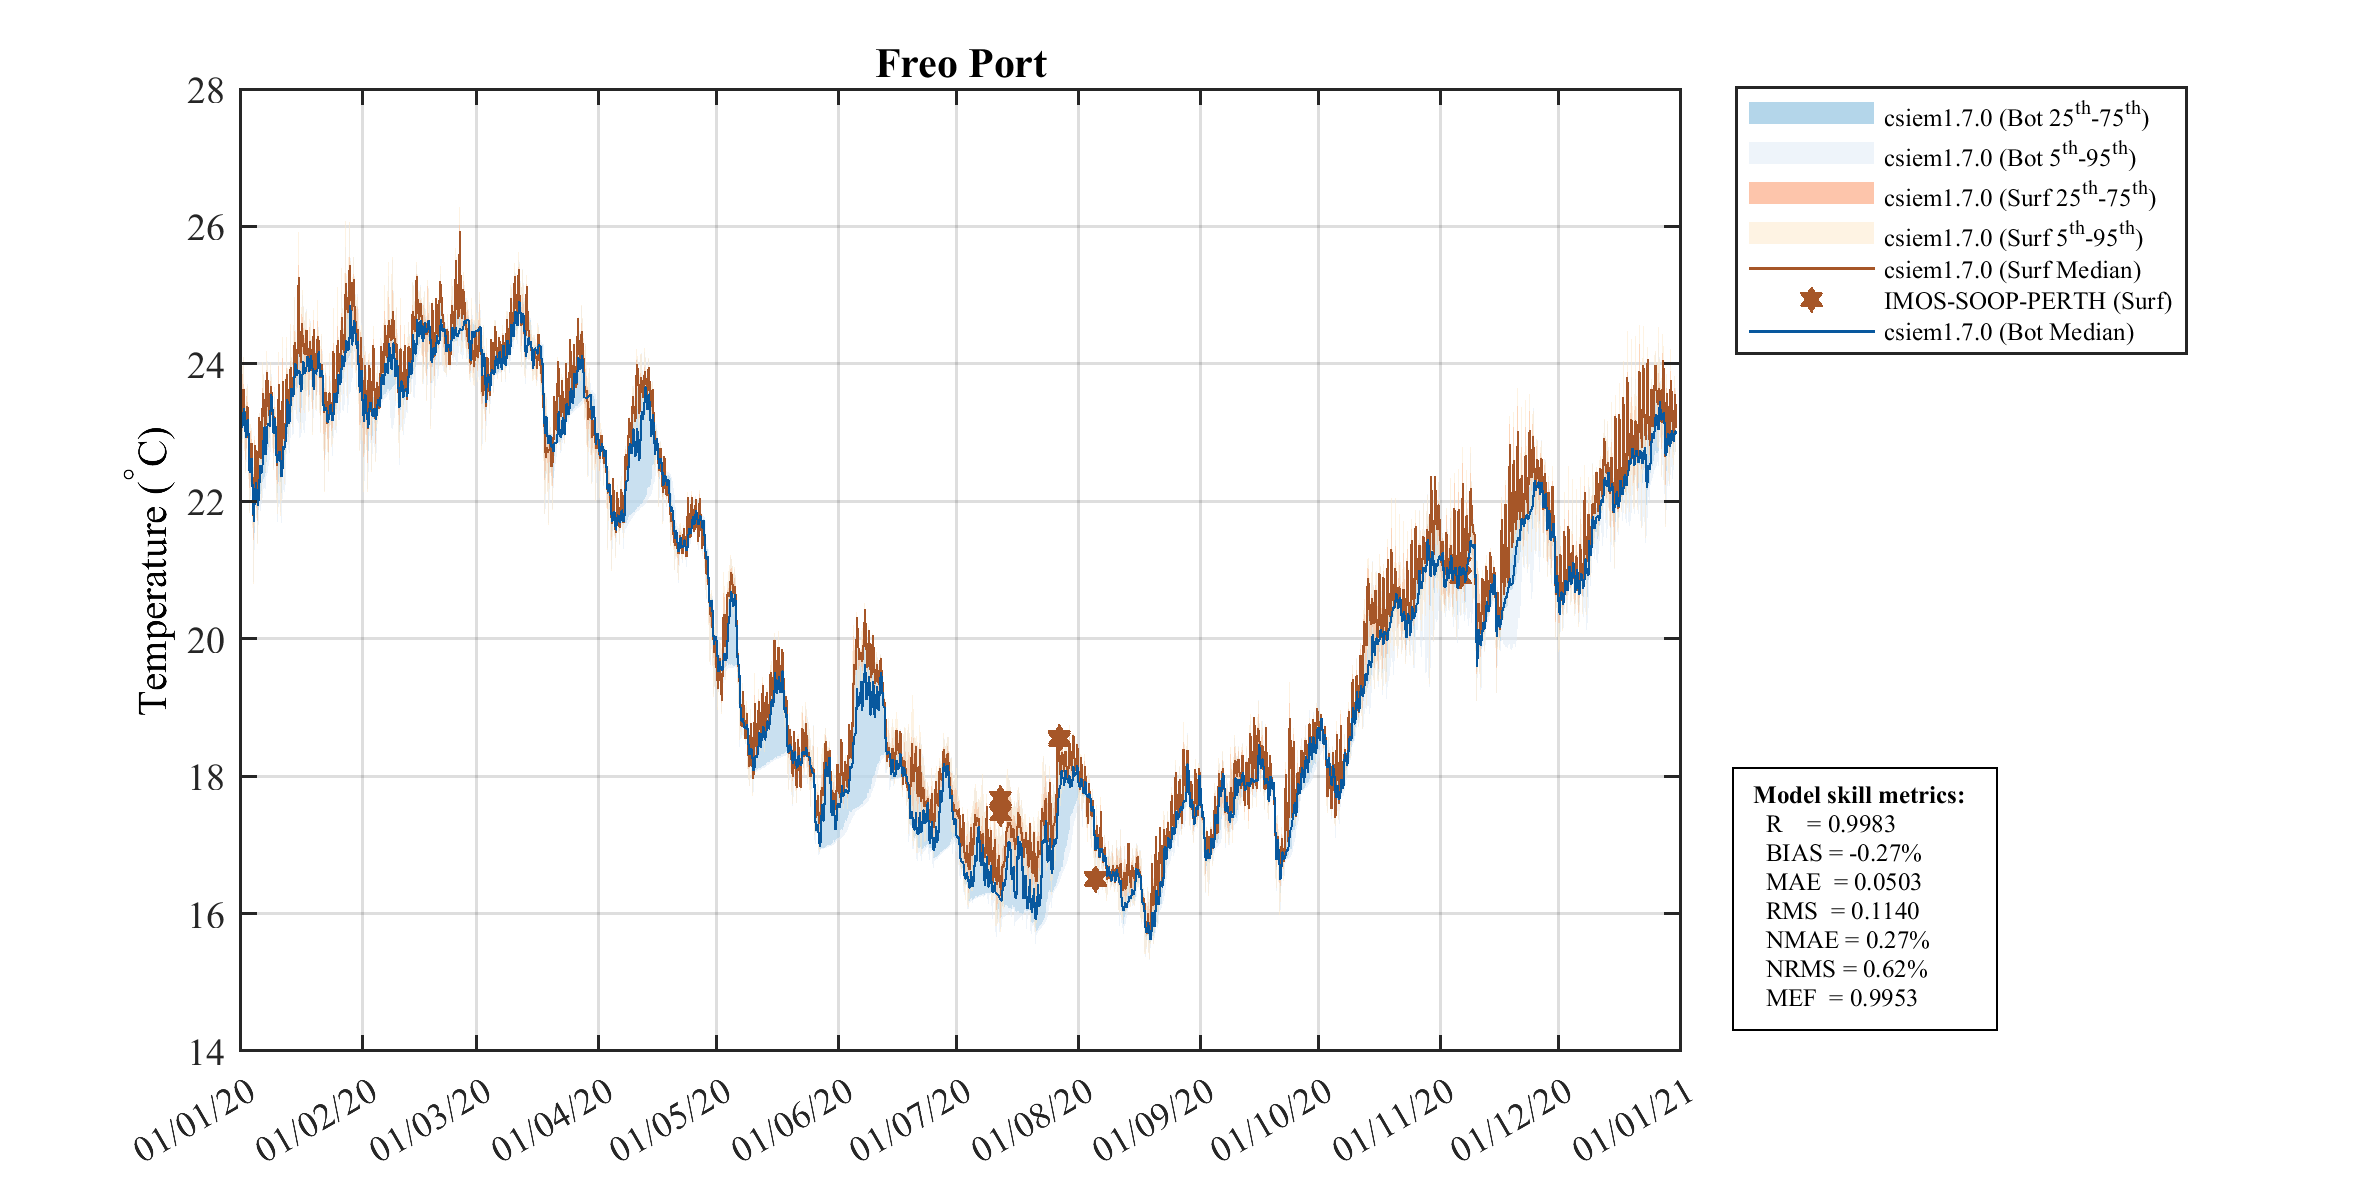
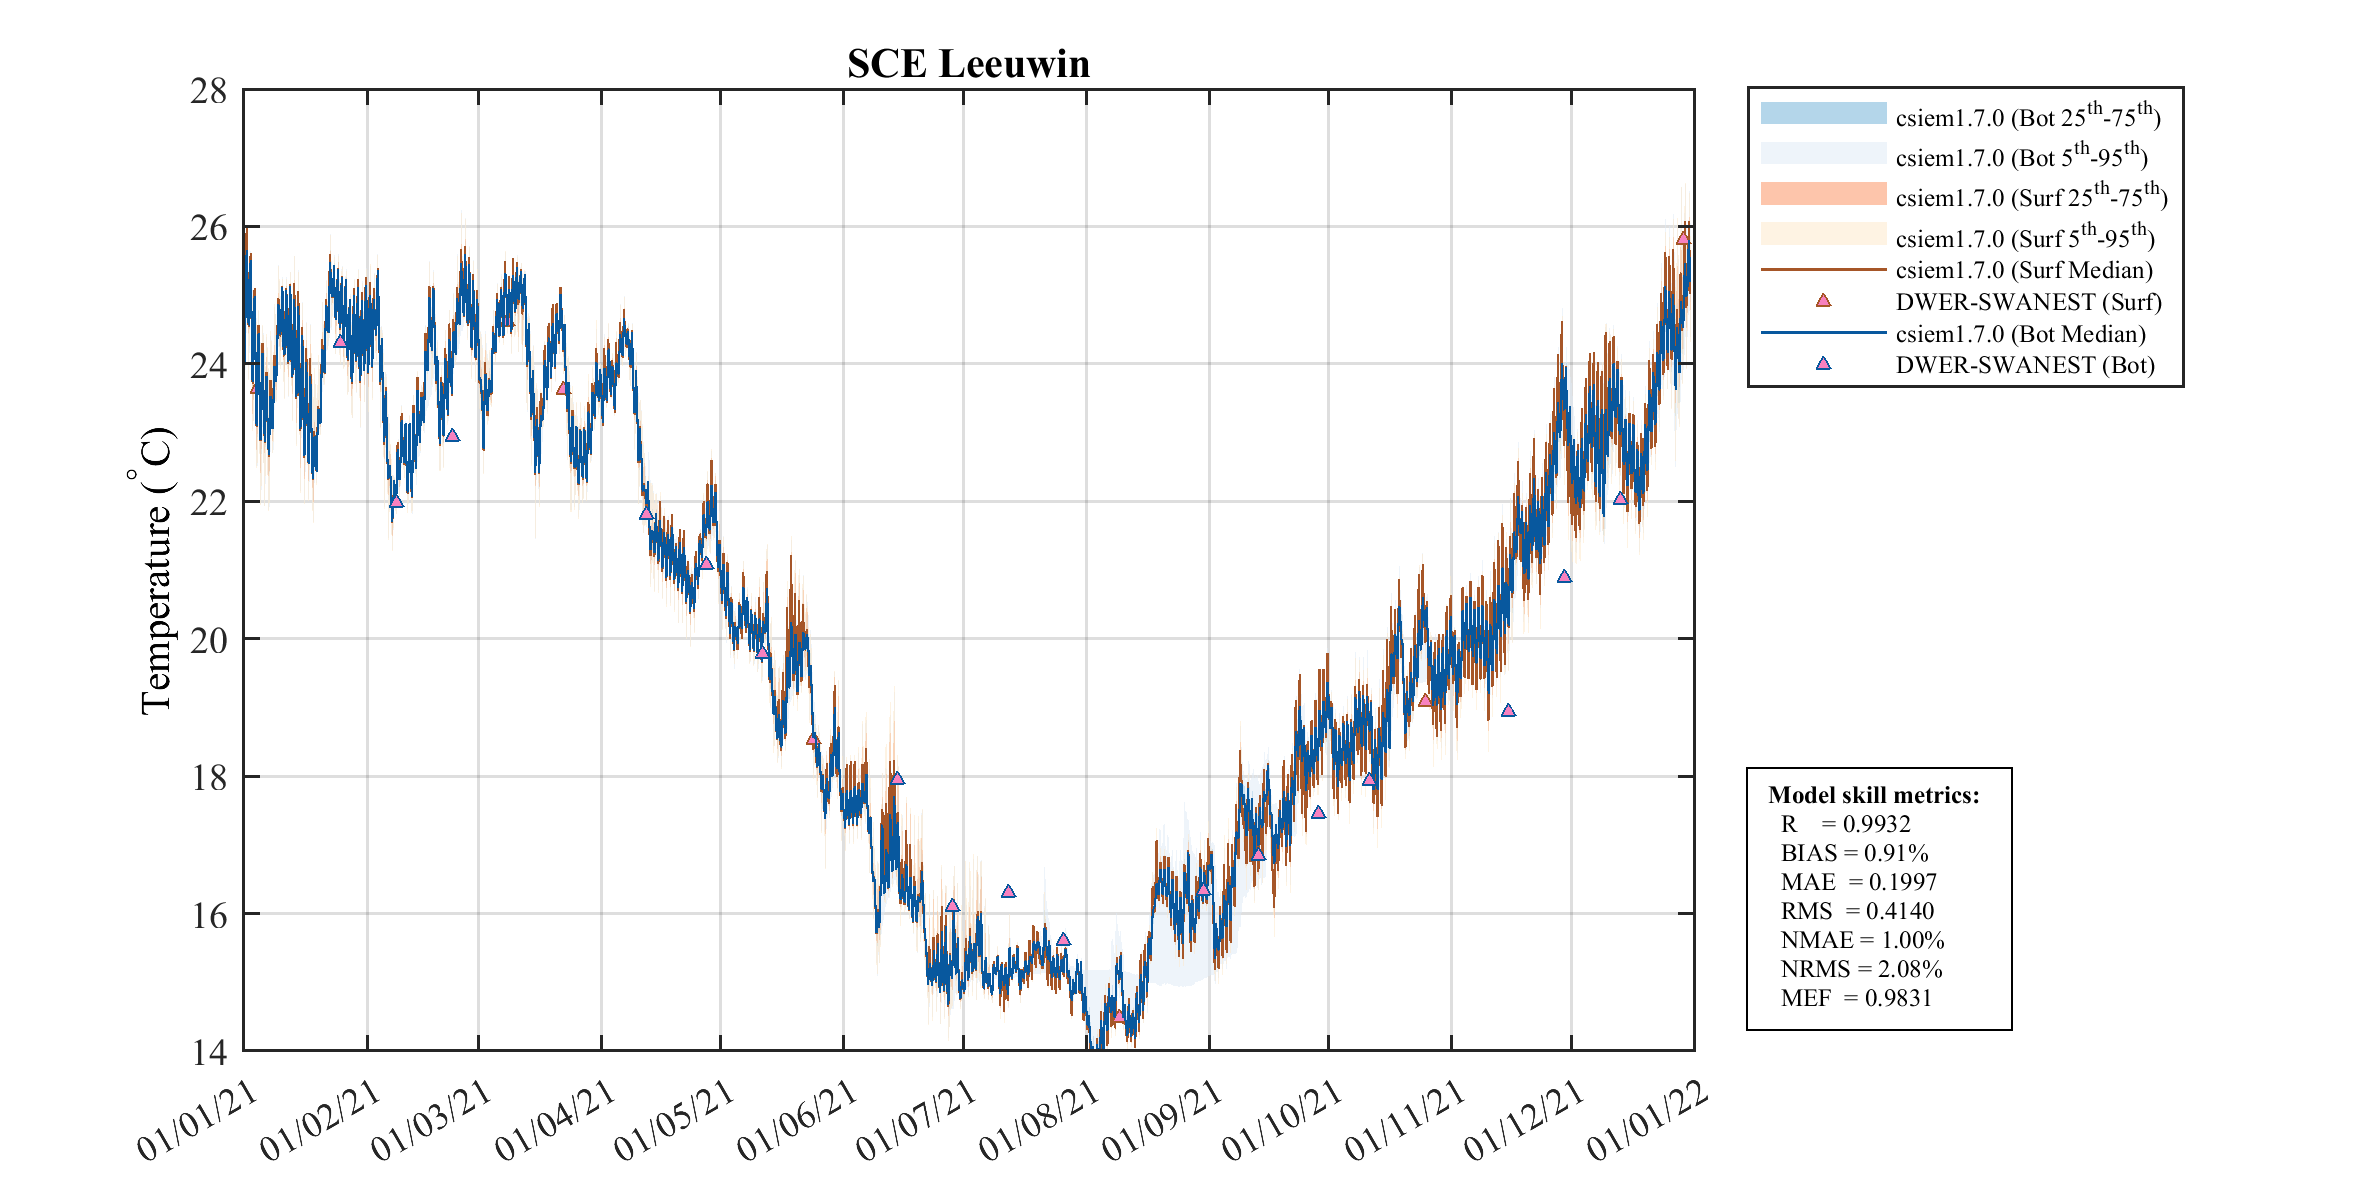
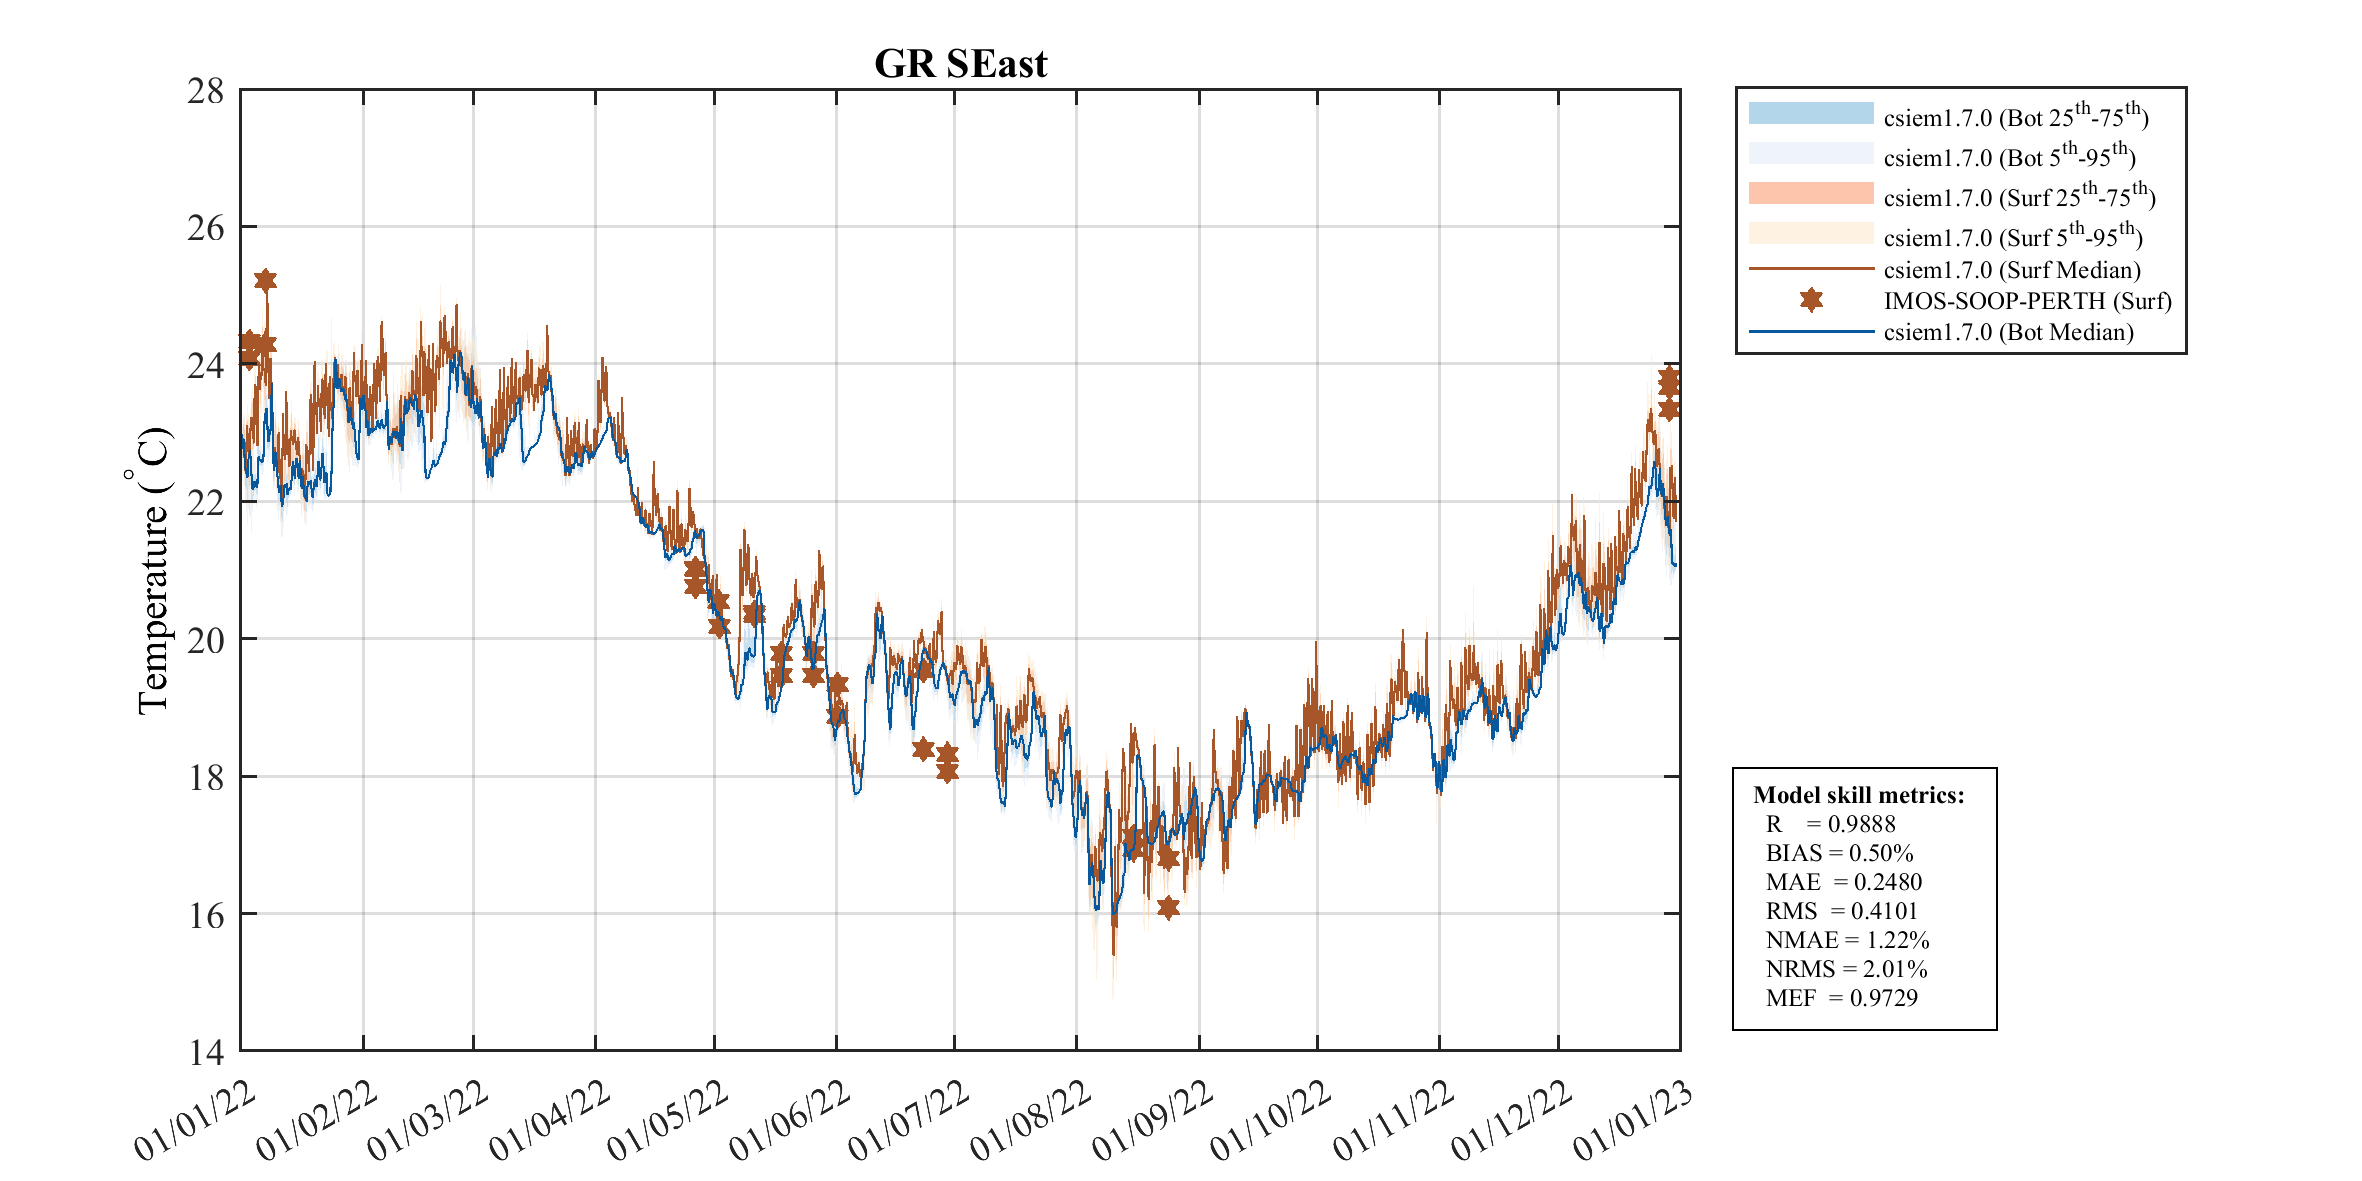
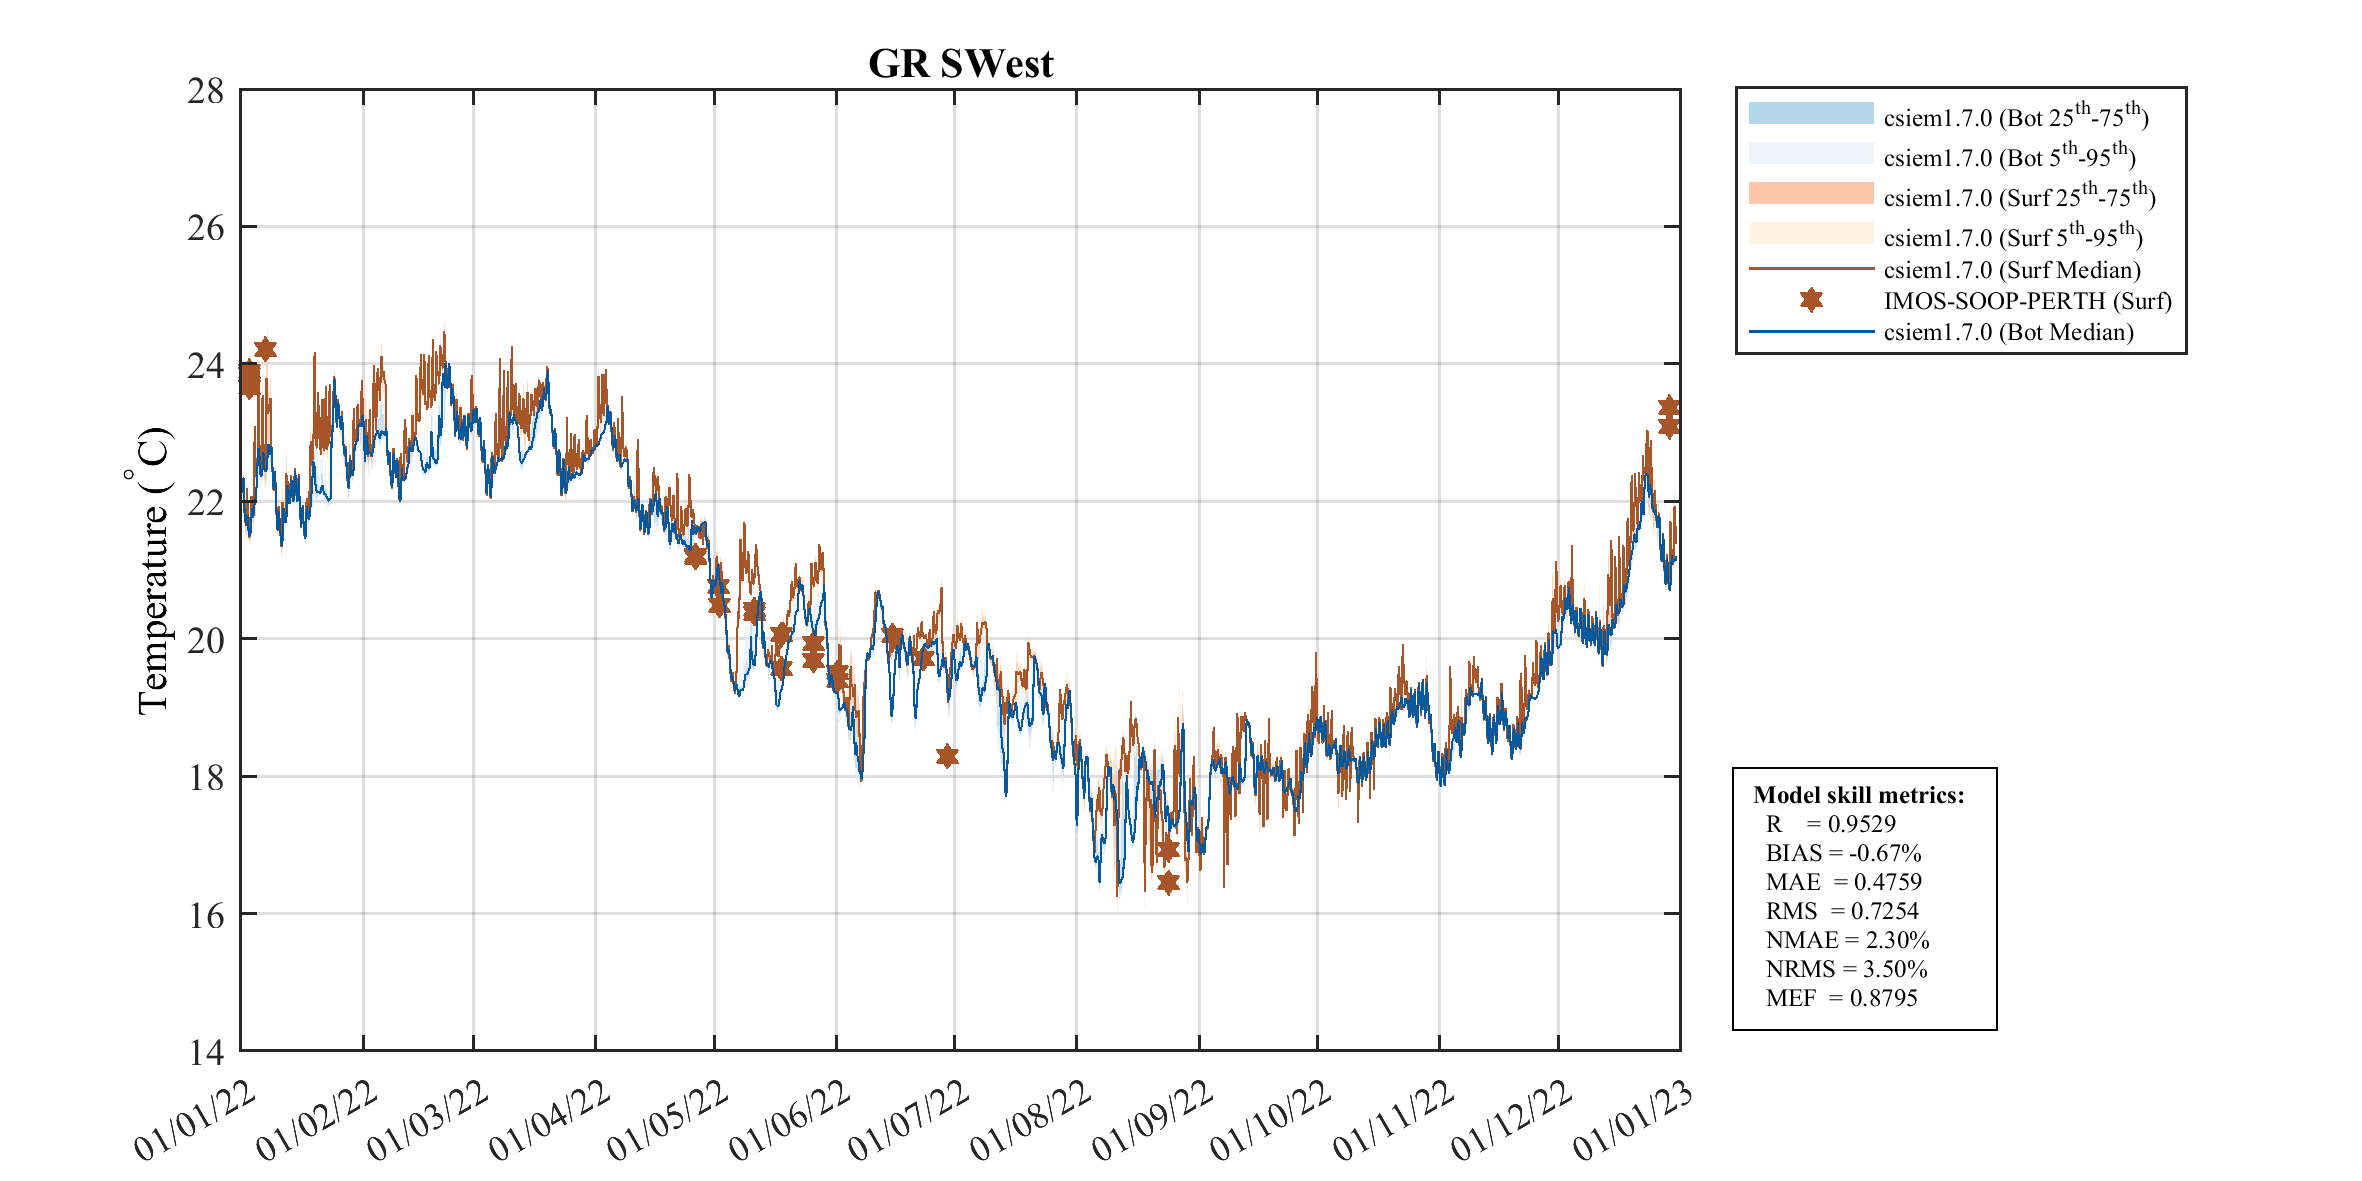
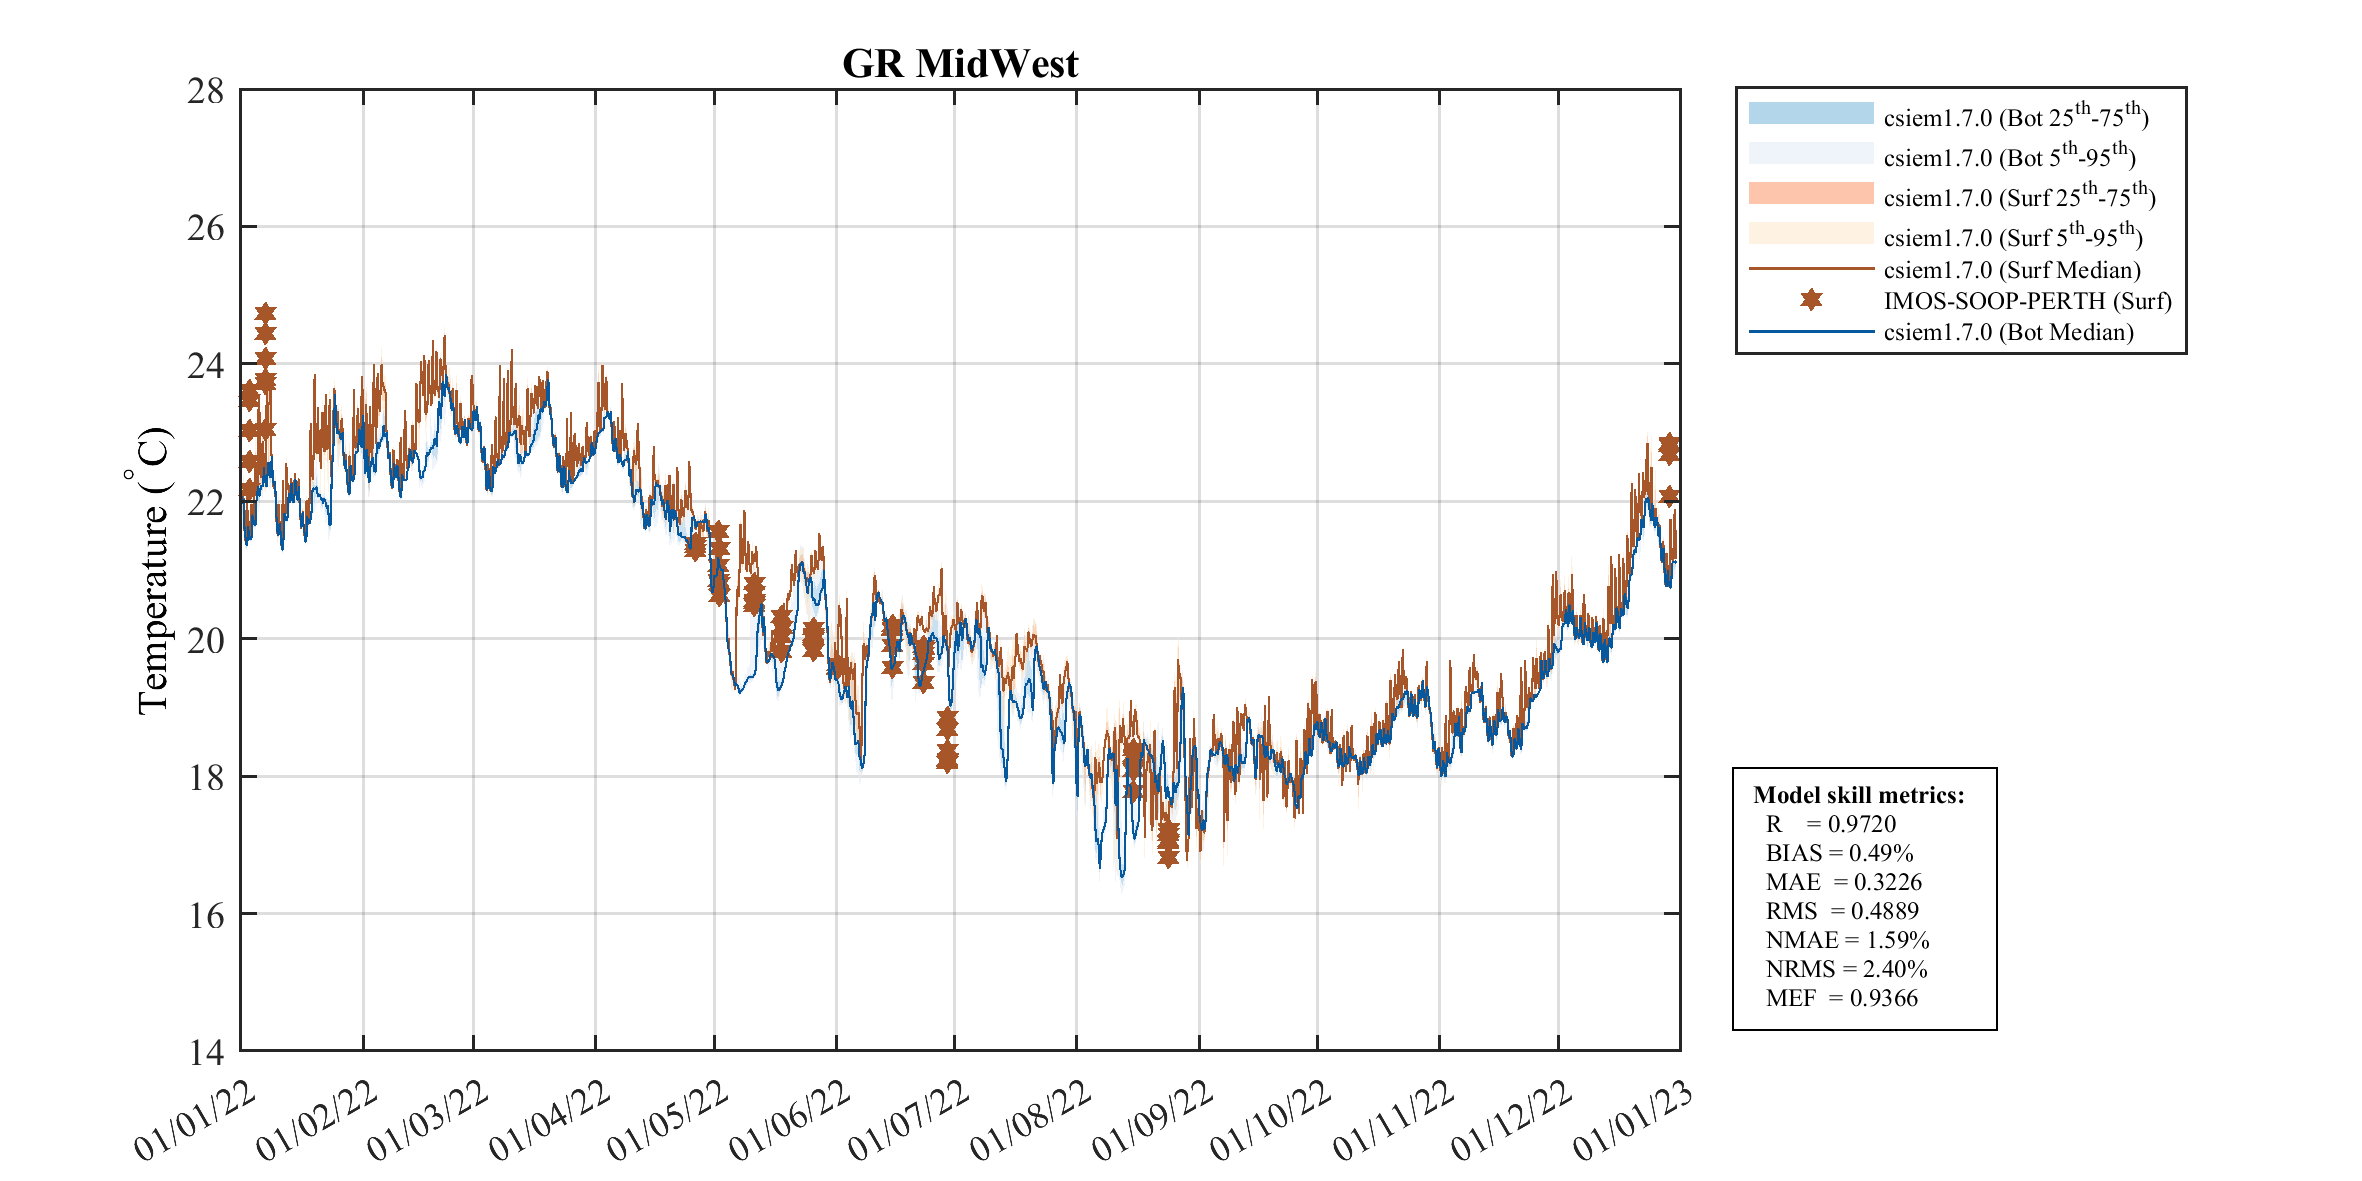
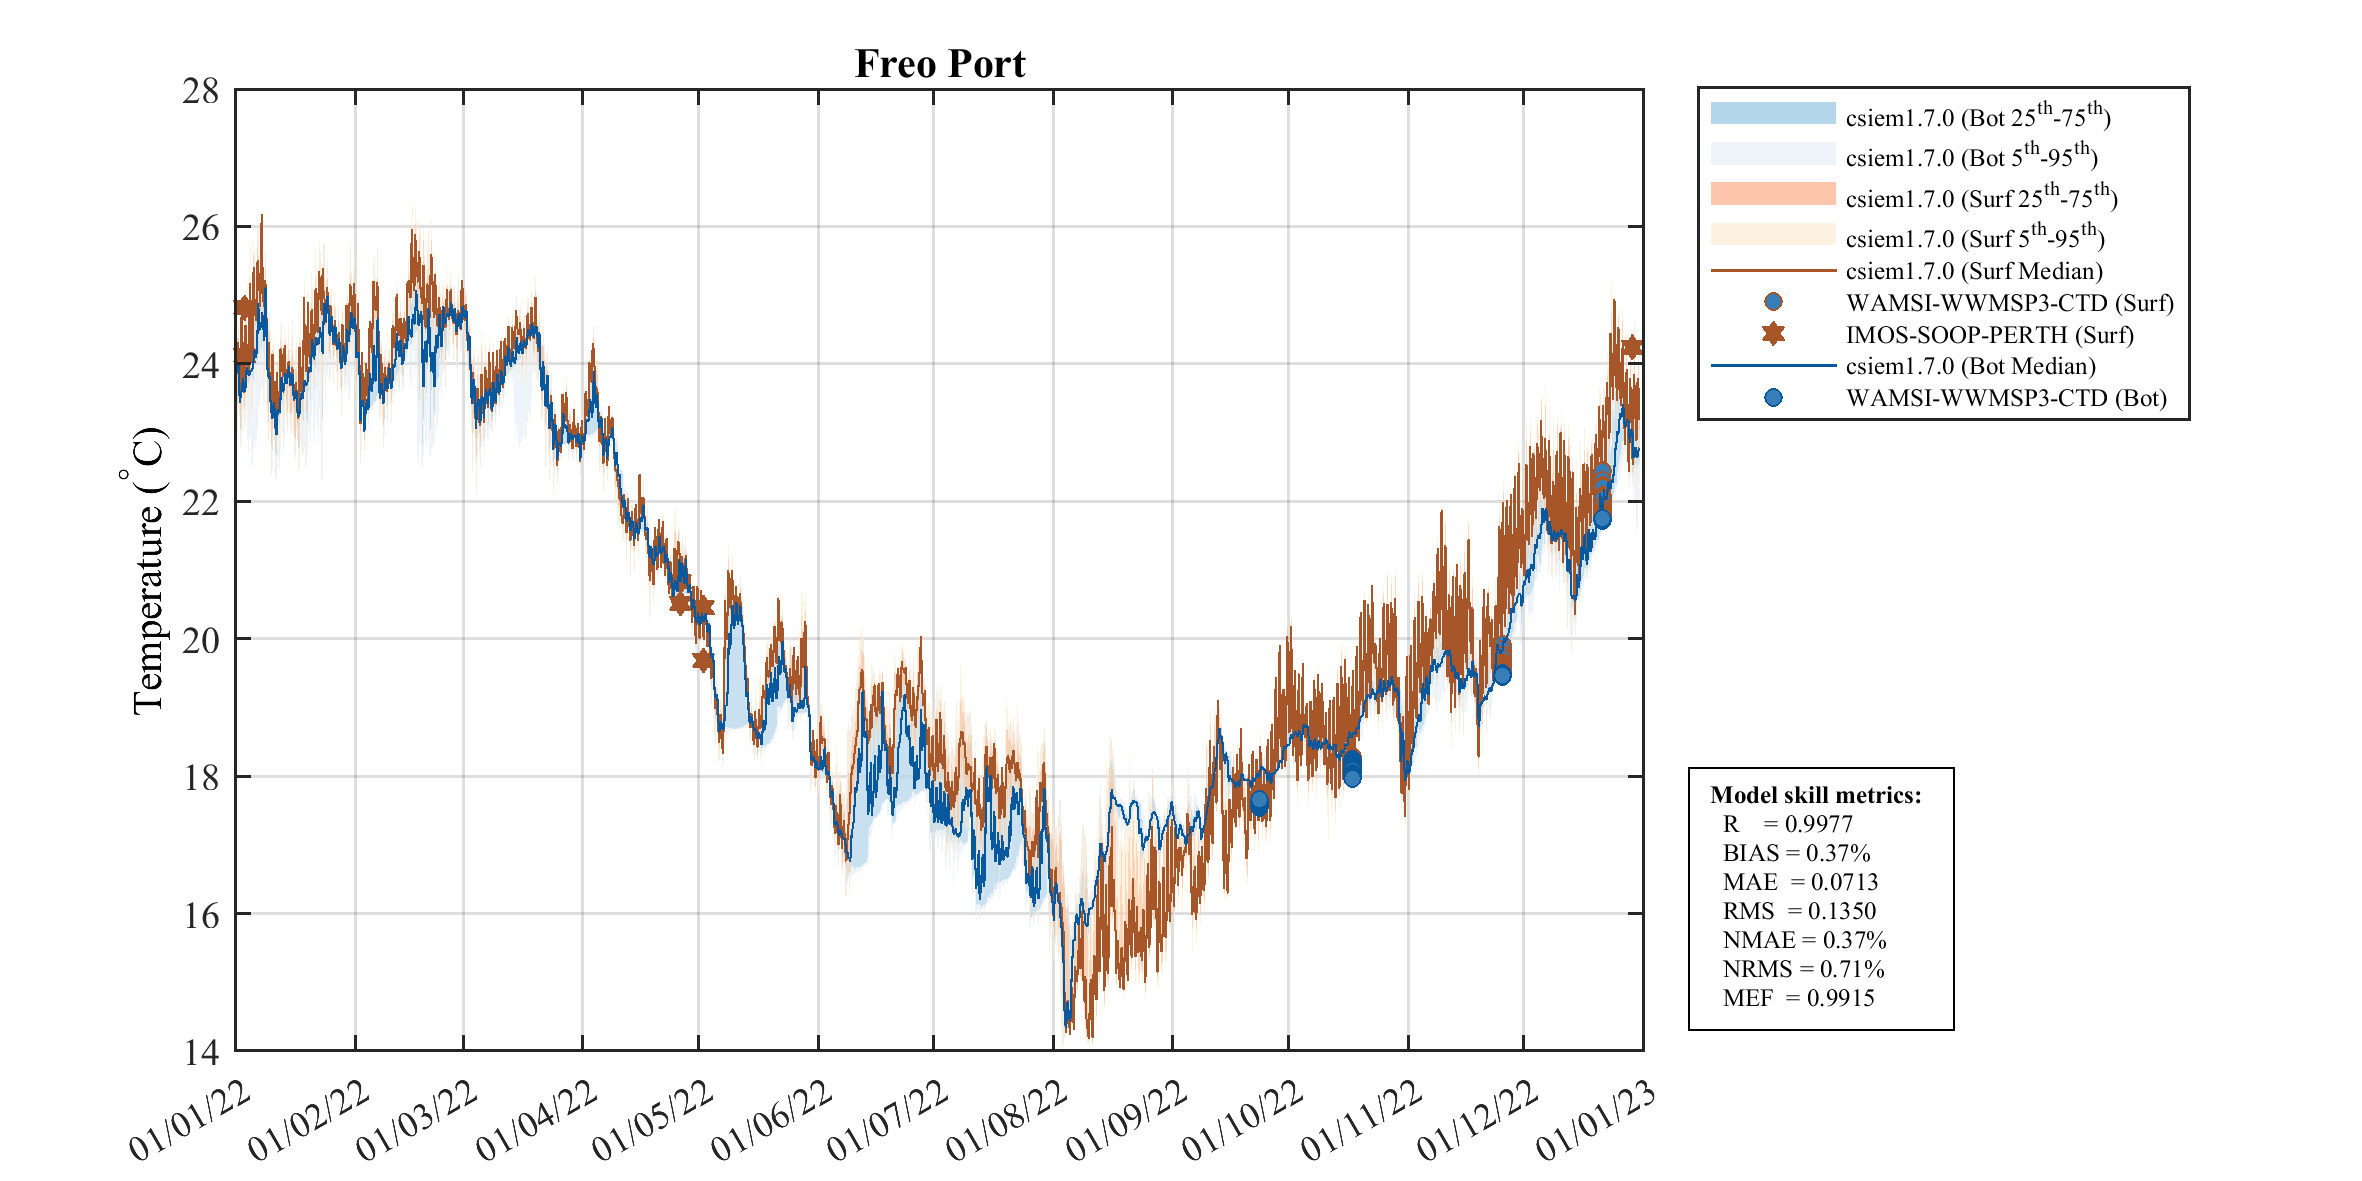
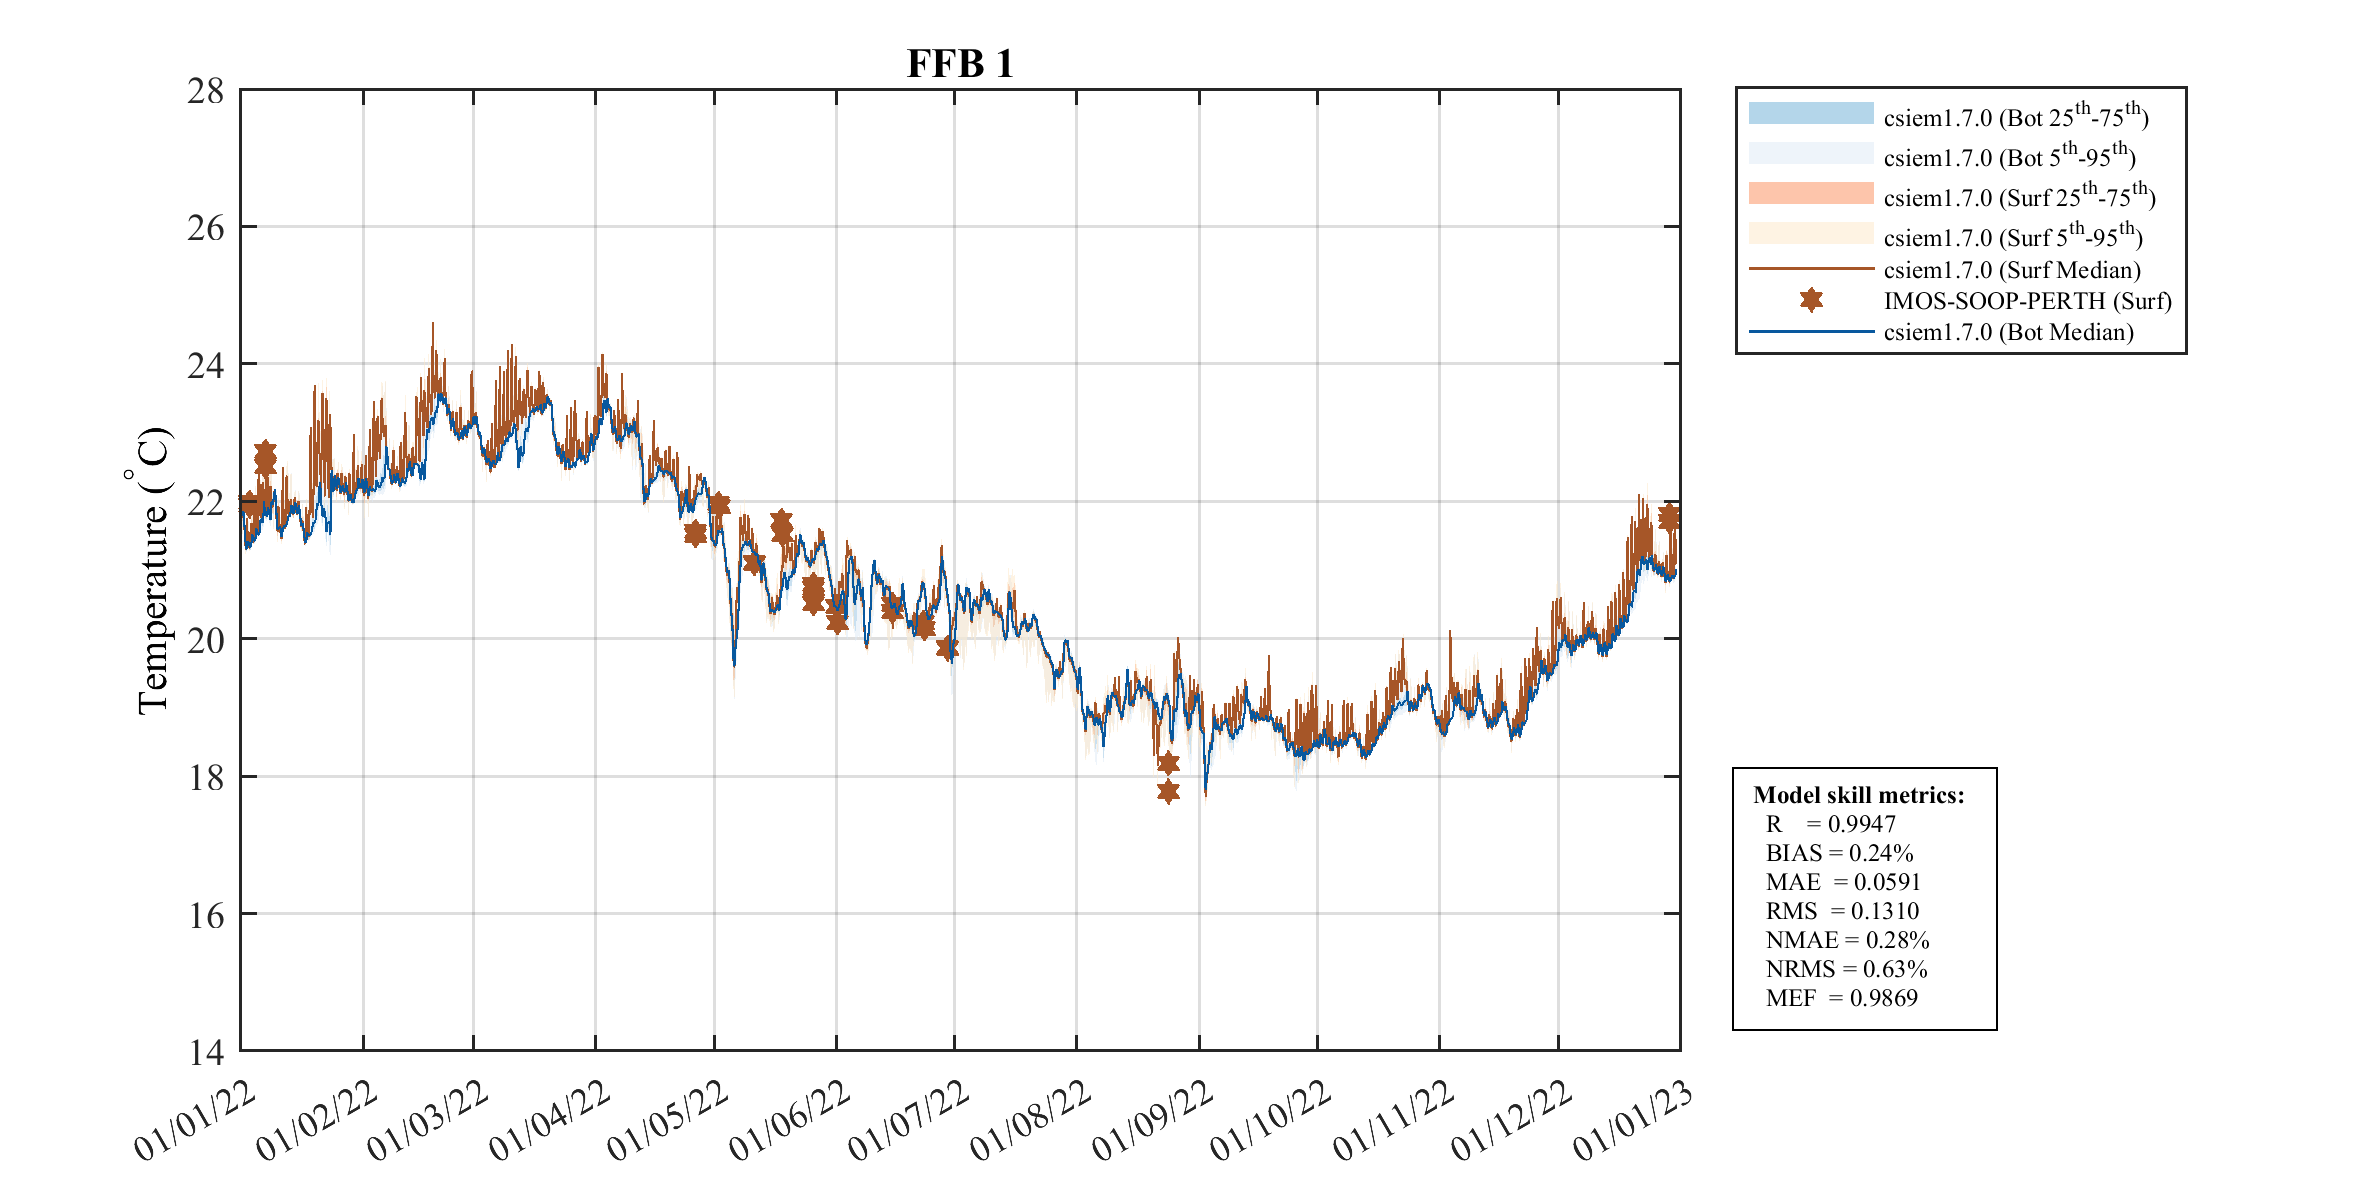
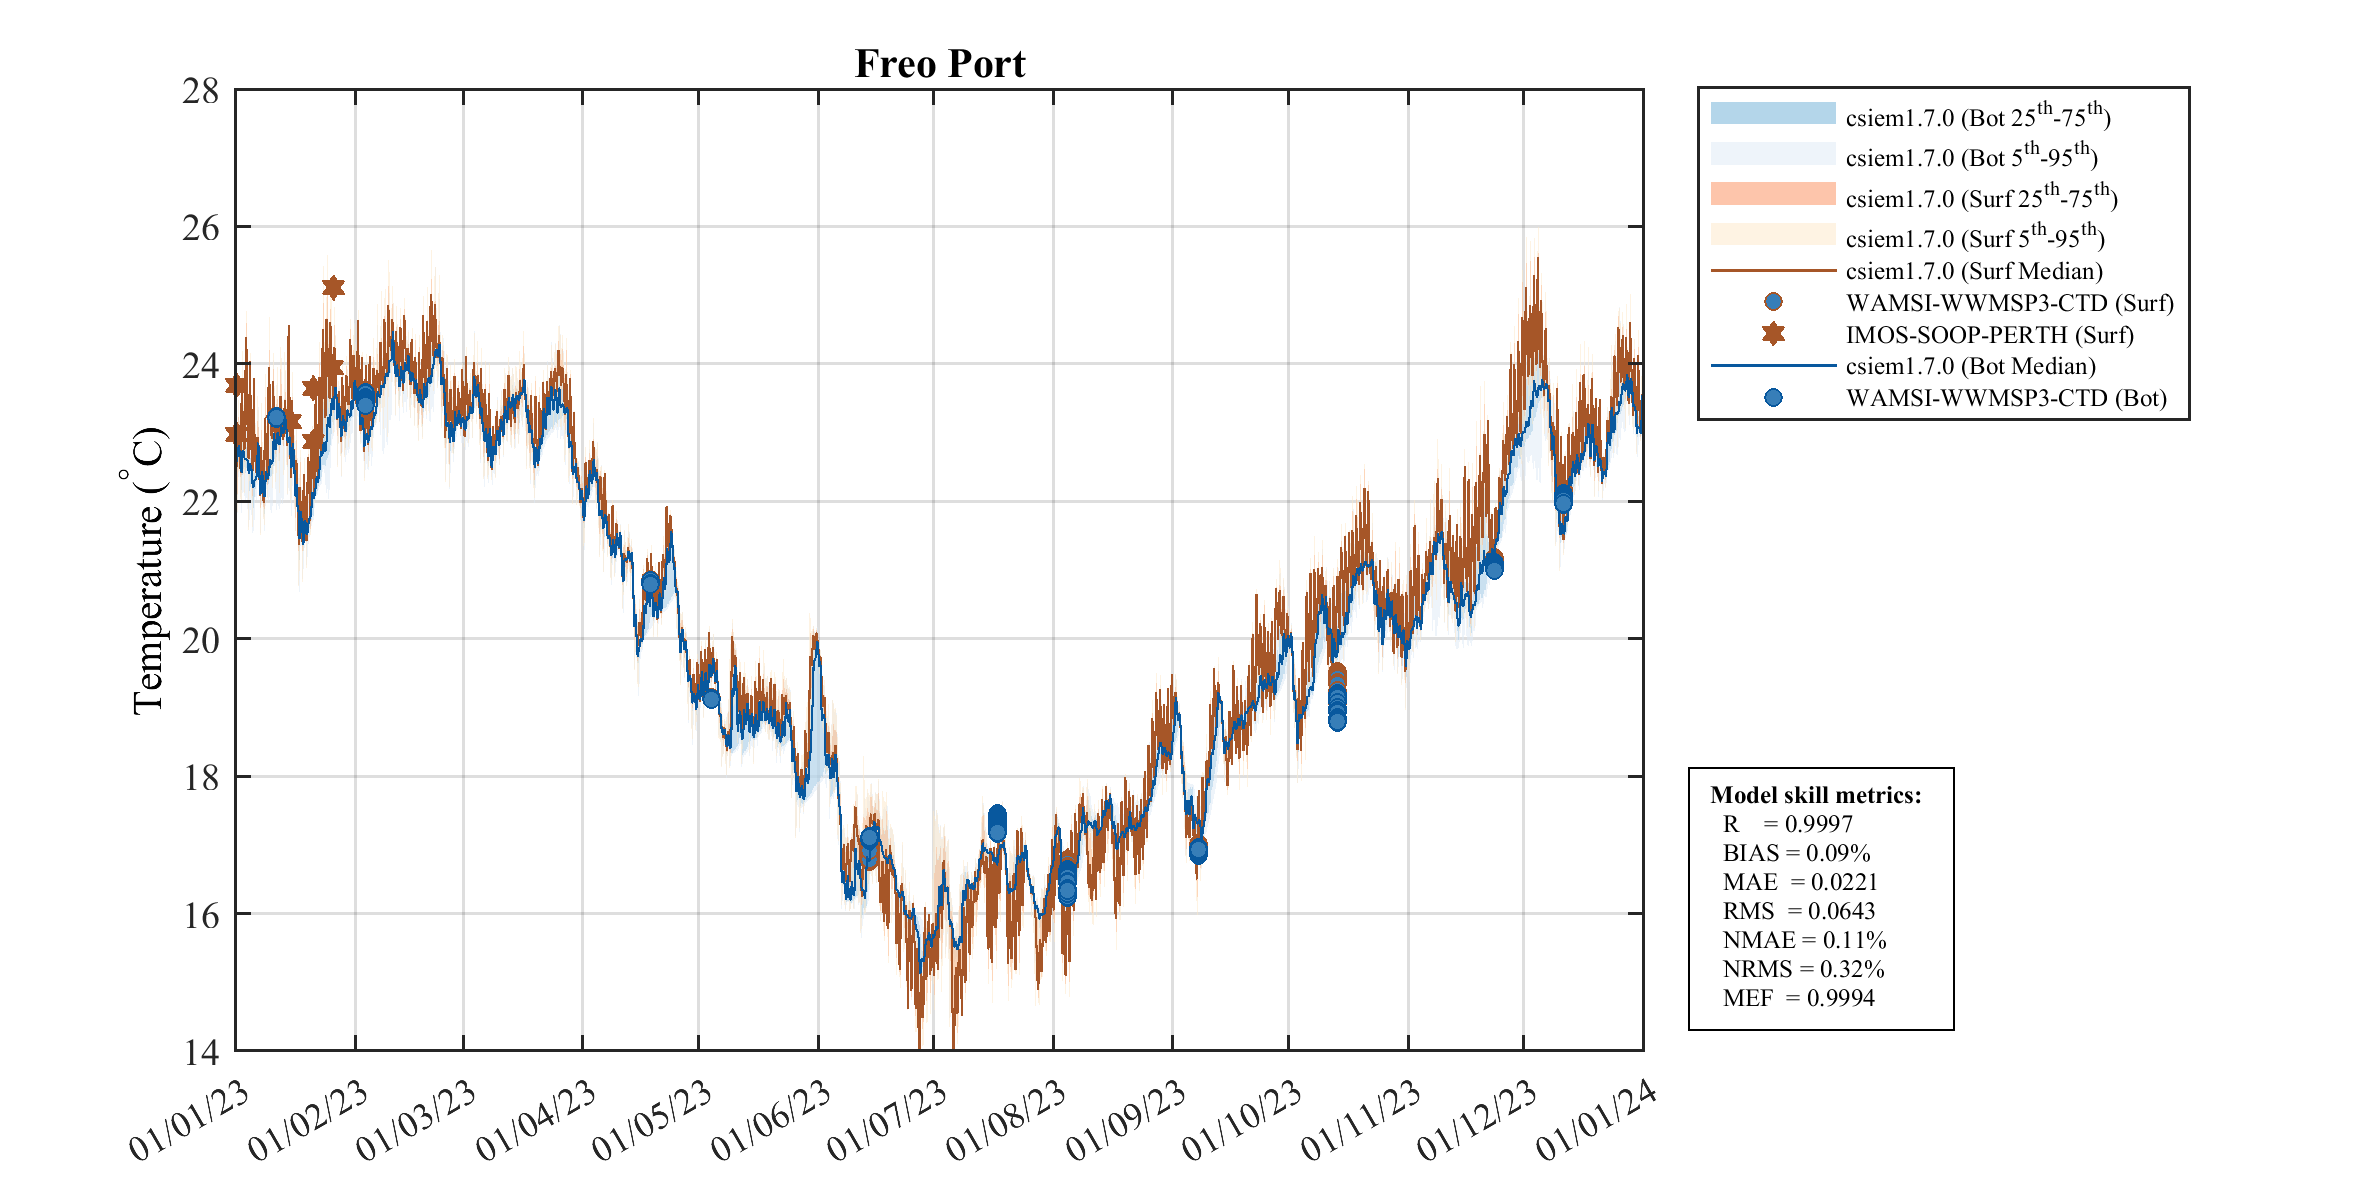
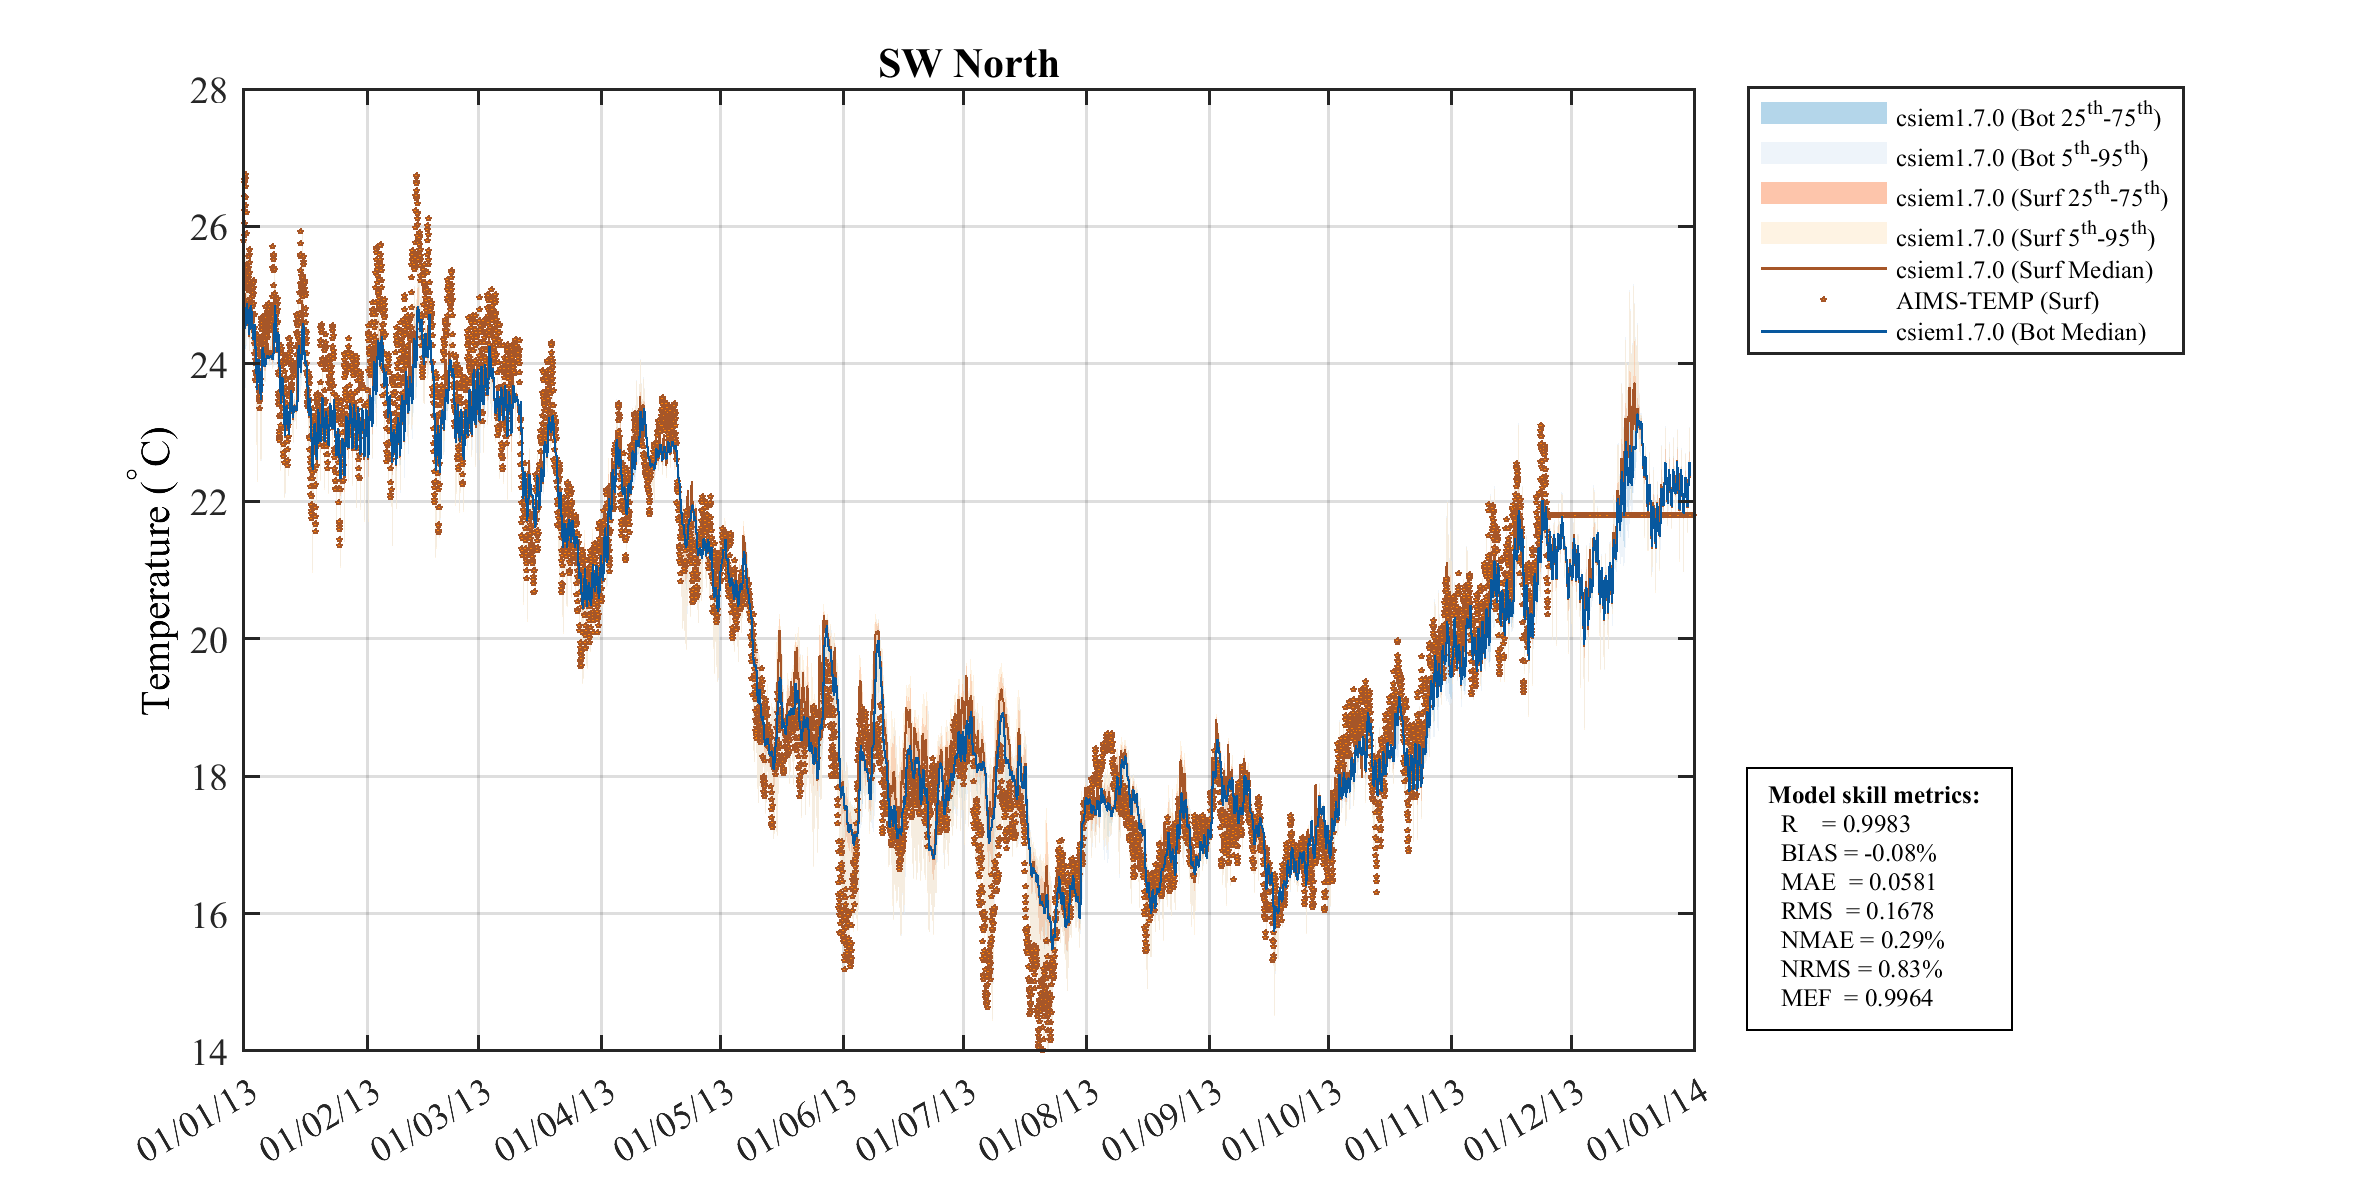
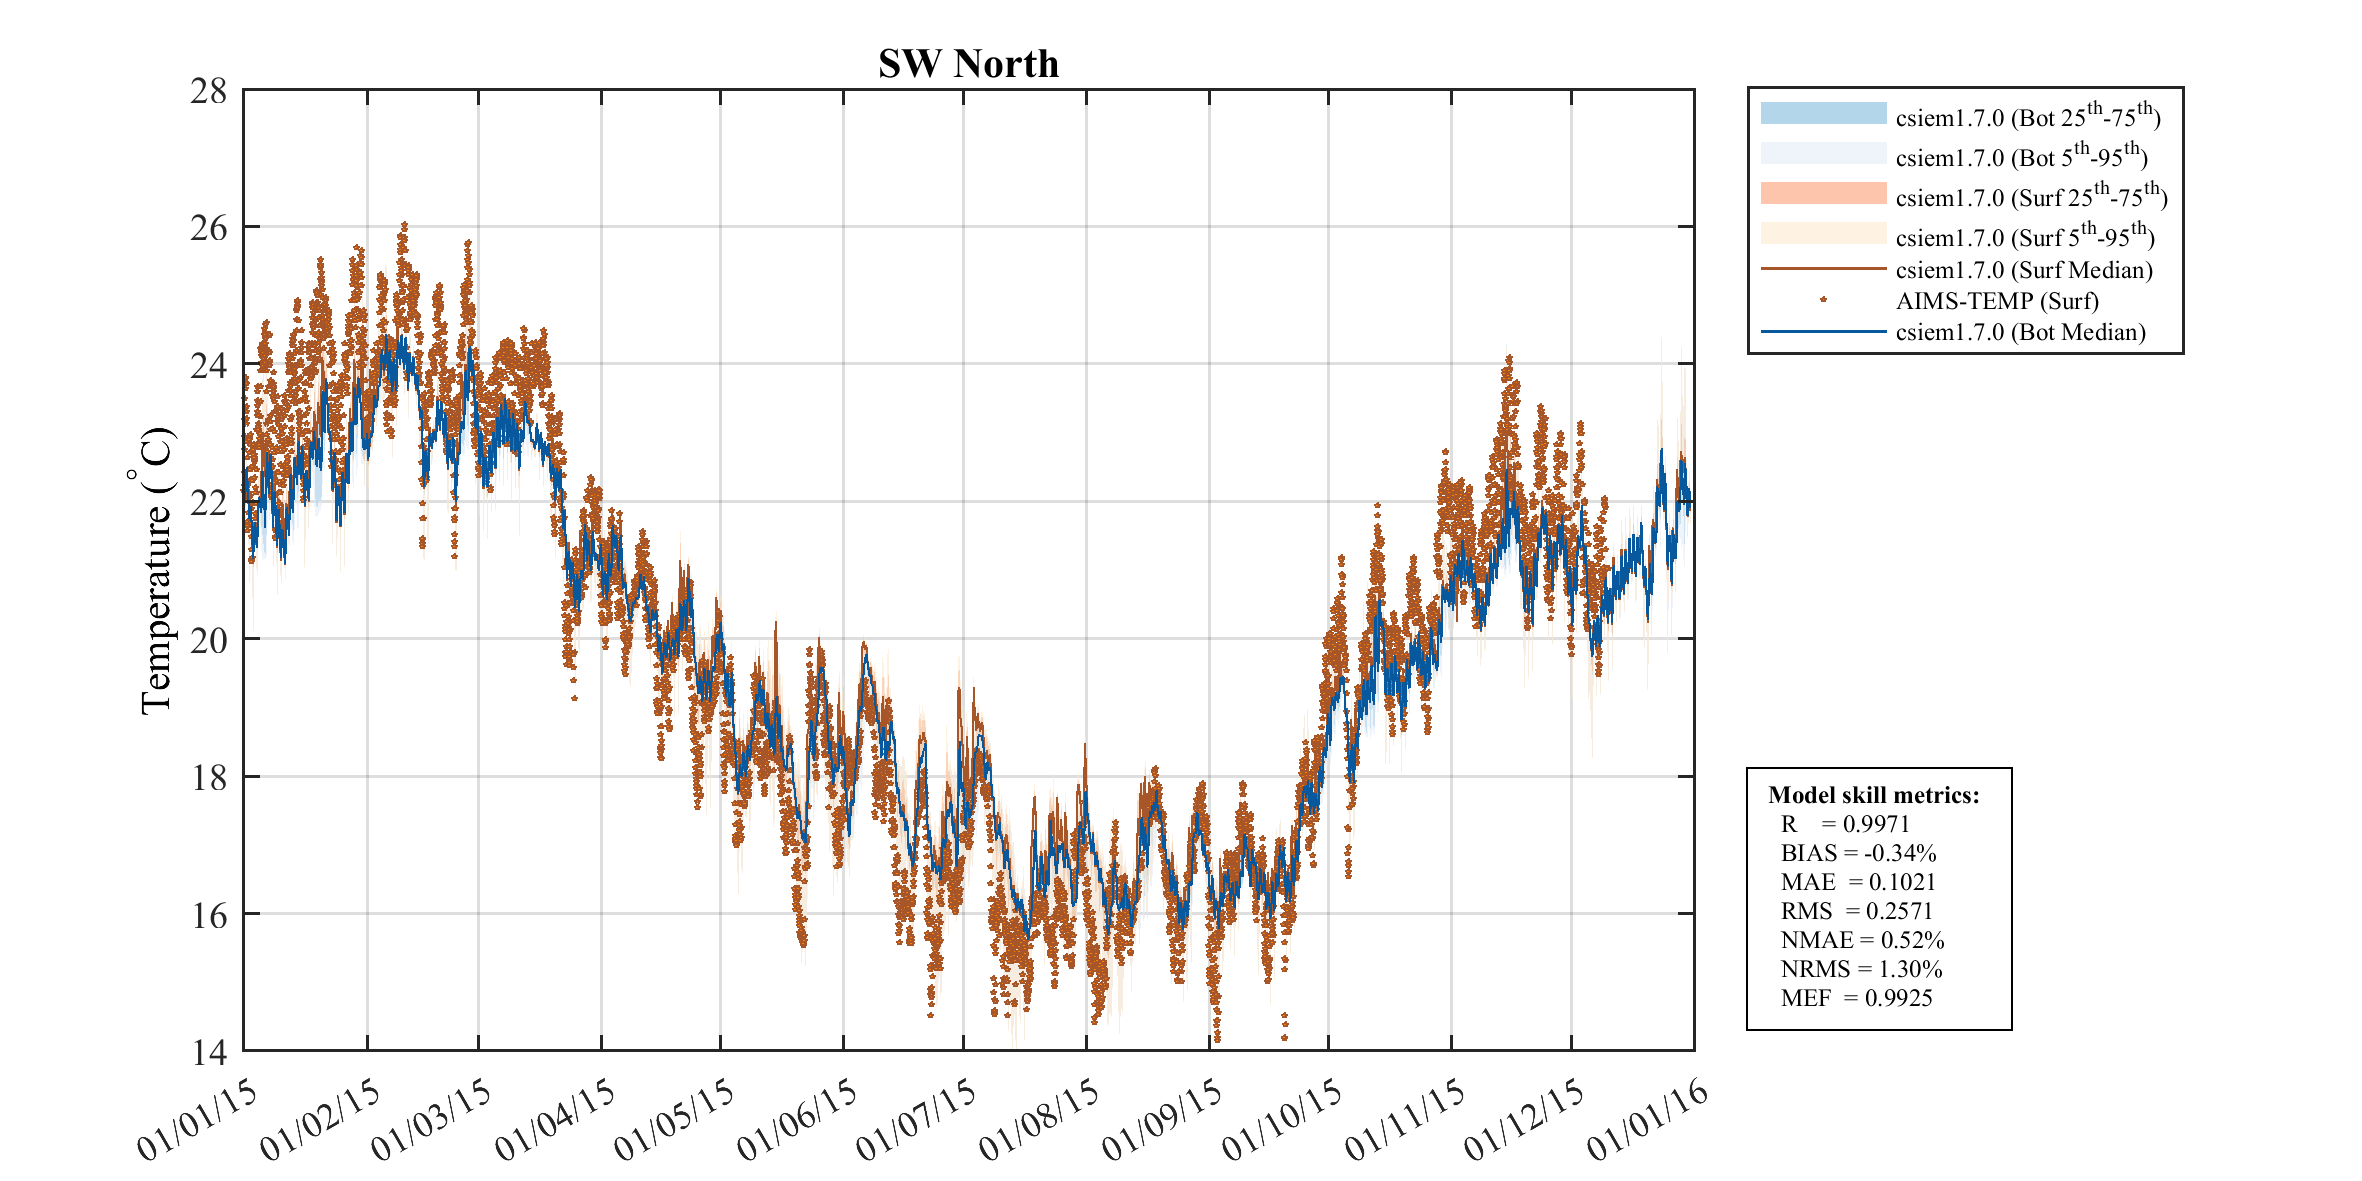
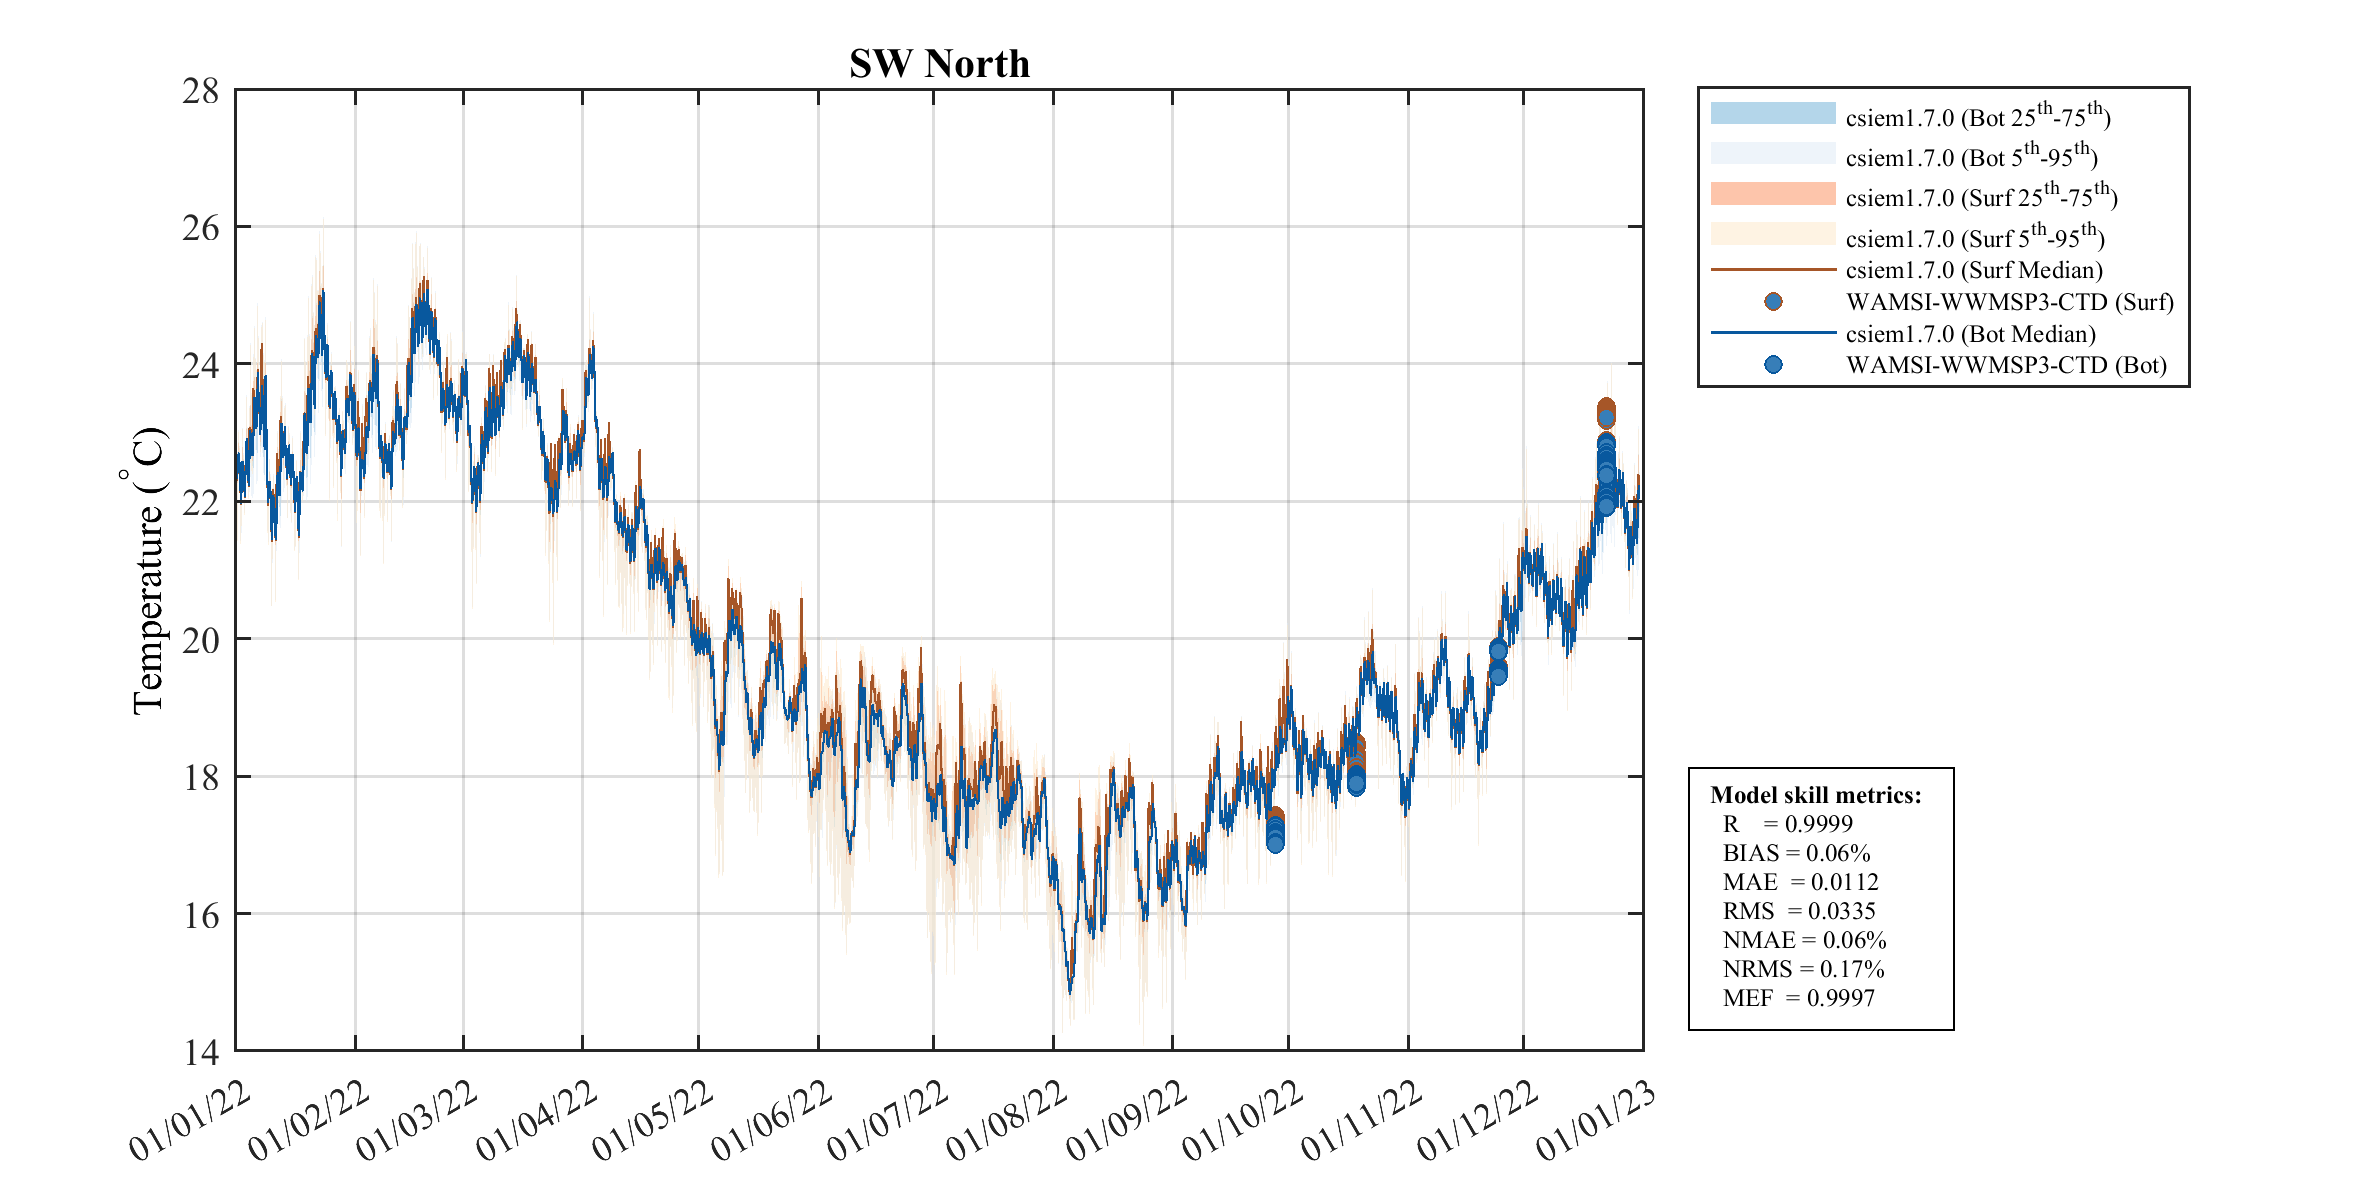
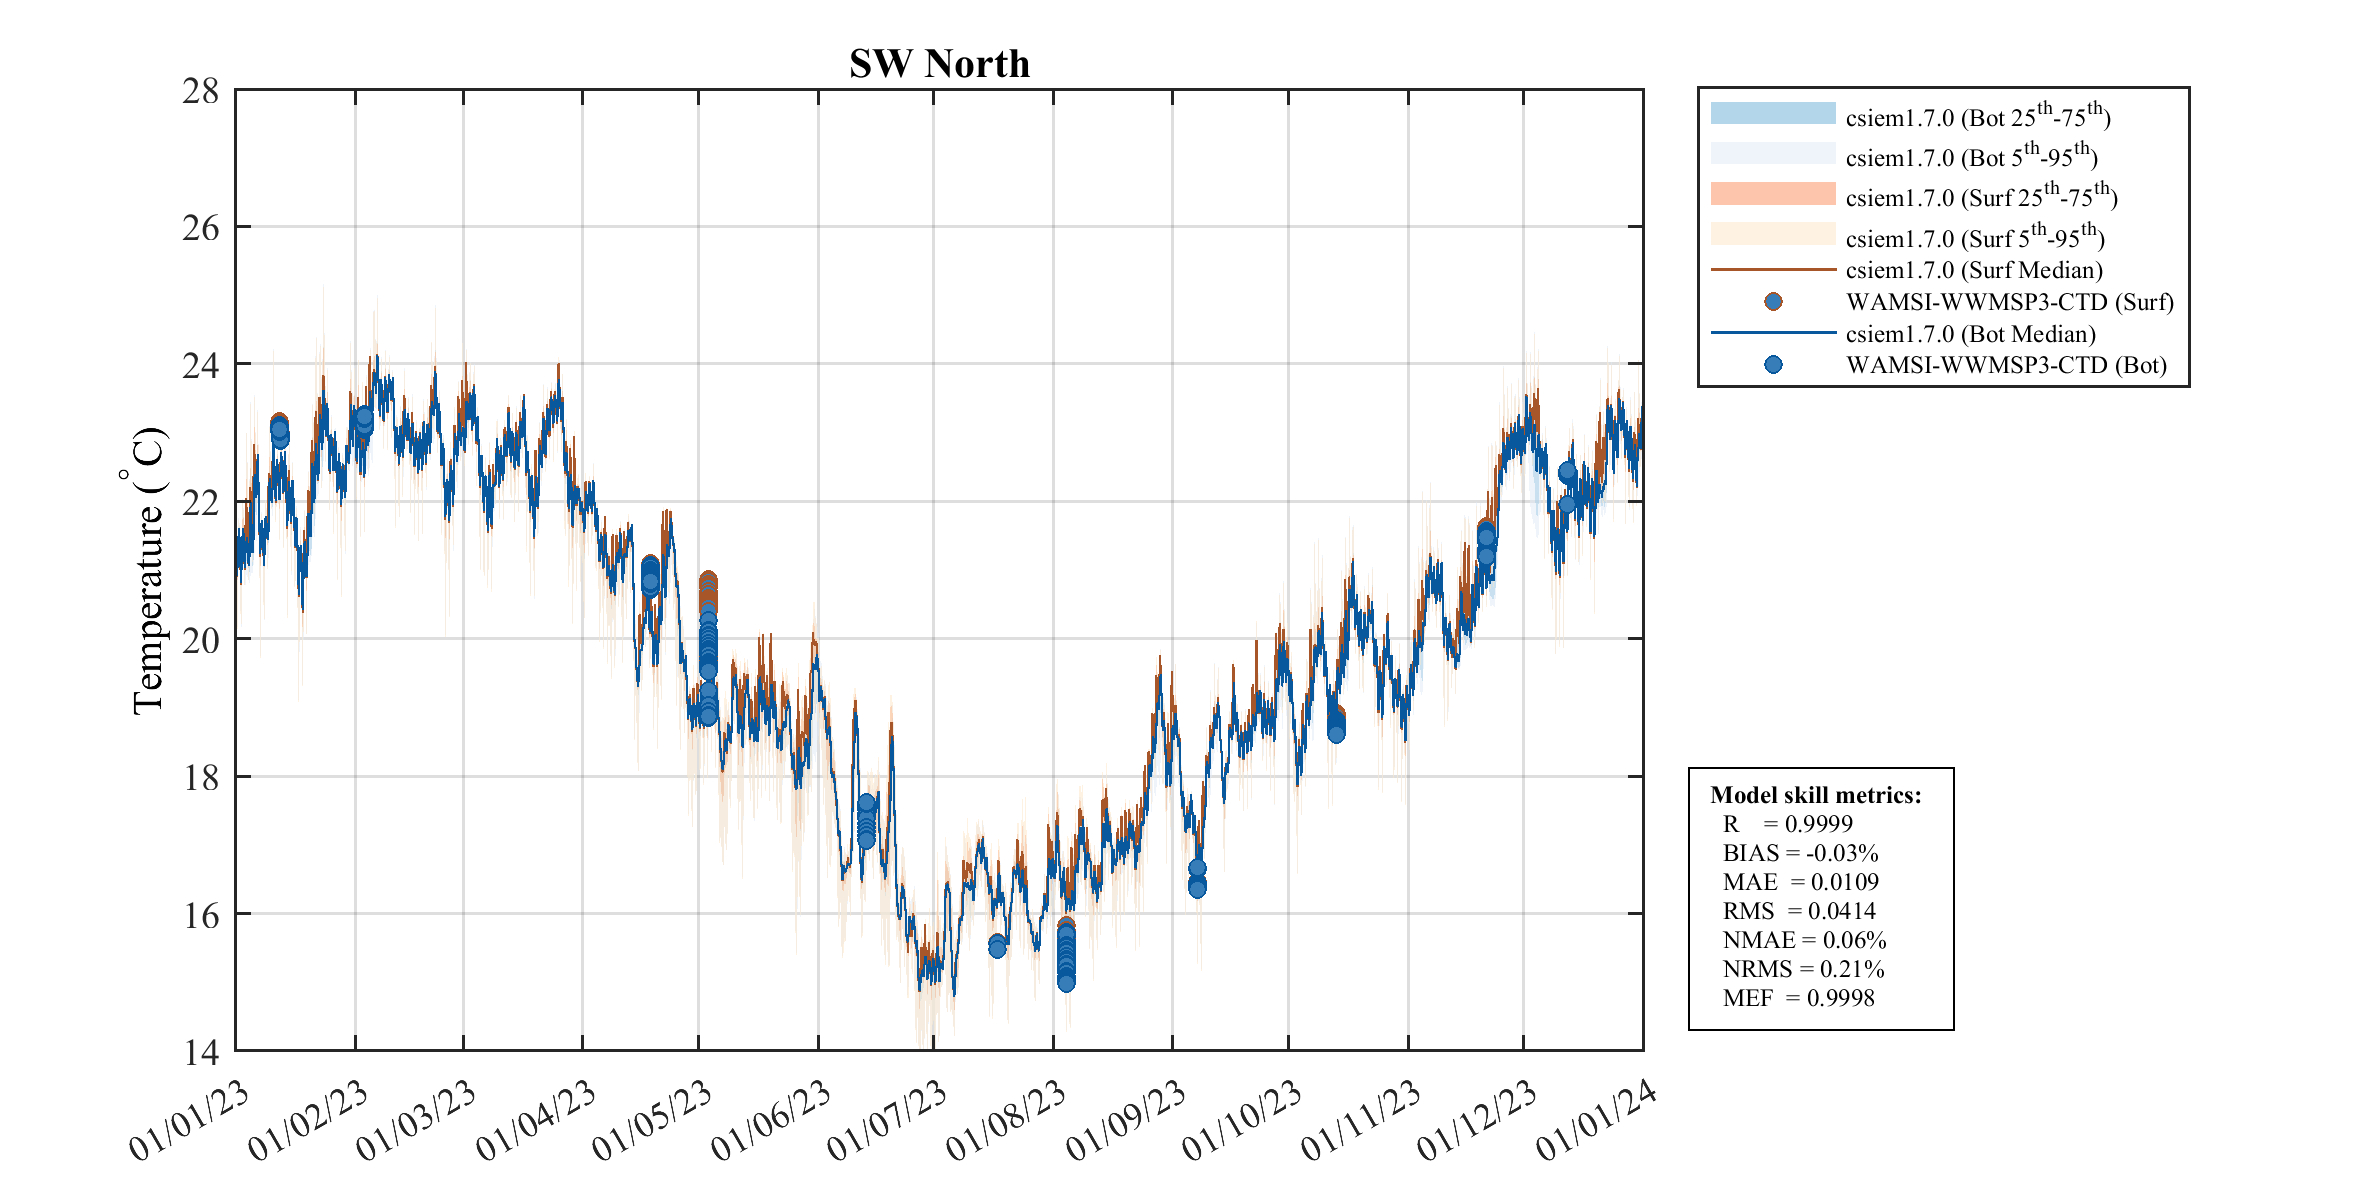
North (Gage Roads & Fremantle)
Assessment polygons for North (Gage Roads & Fremantle)
Owen Anchorage
Assessment polygons for Owen Anchorage
NO VALIDATION DATA
NO VALIDATION DATA
NO VALIDATION DATA
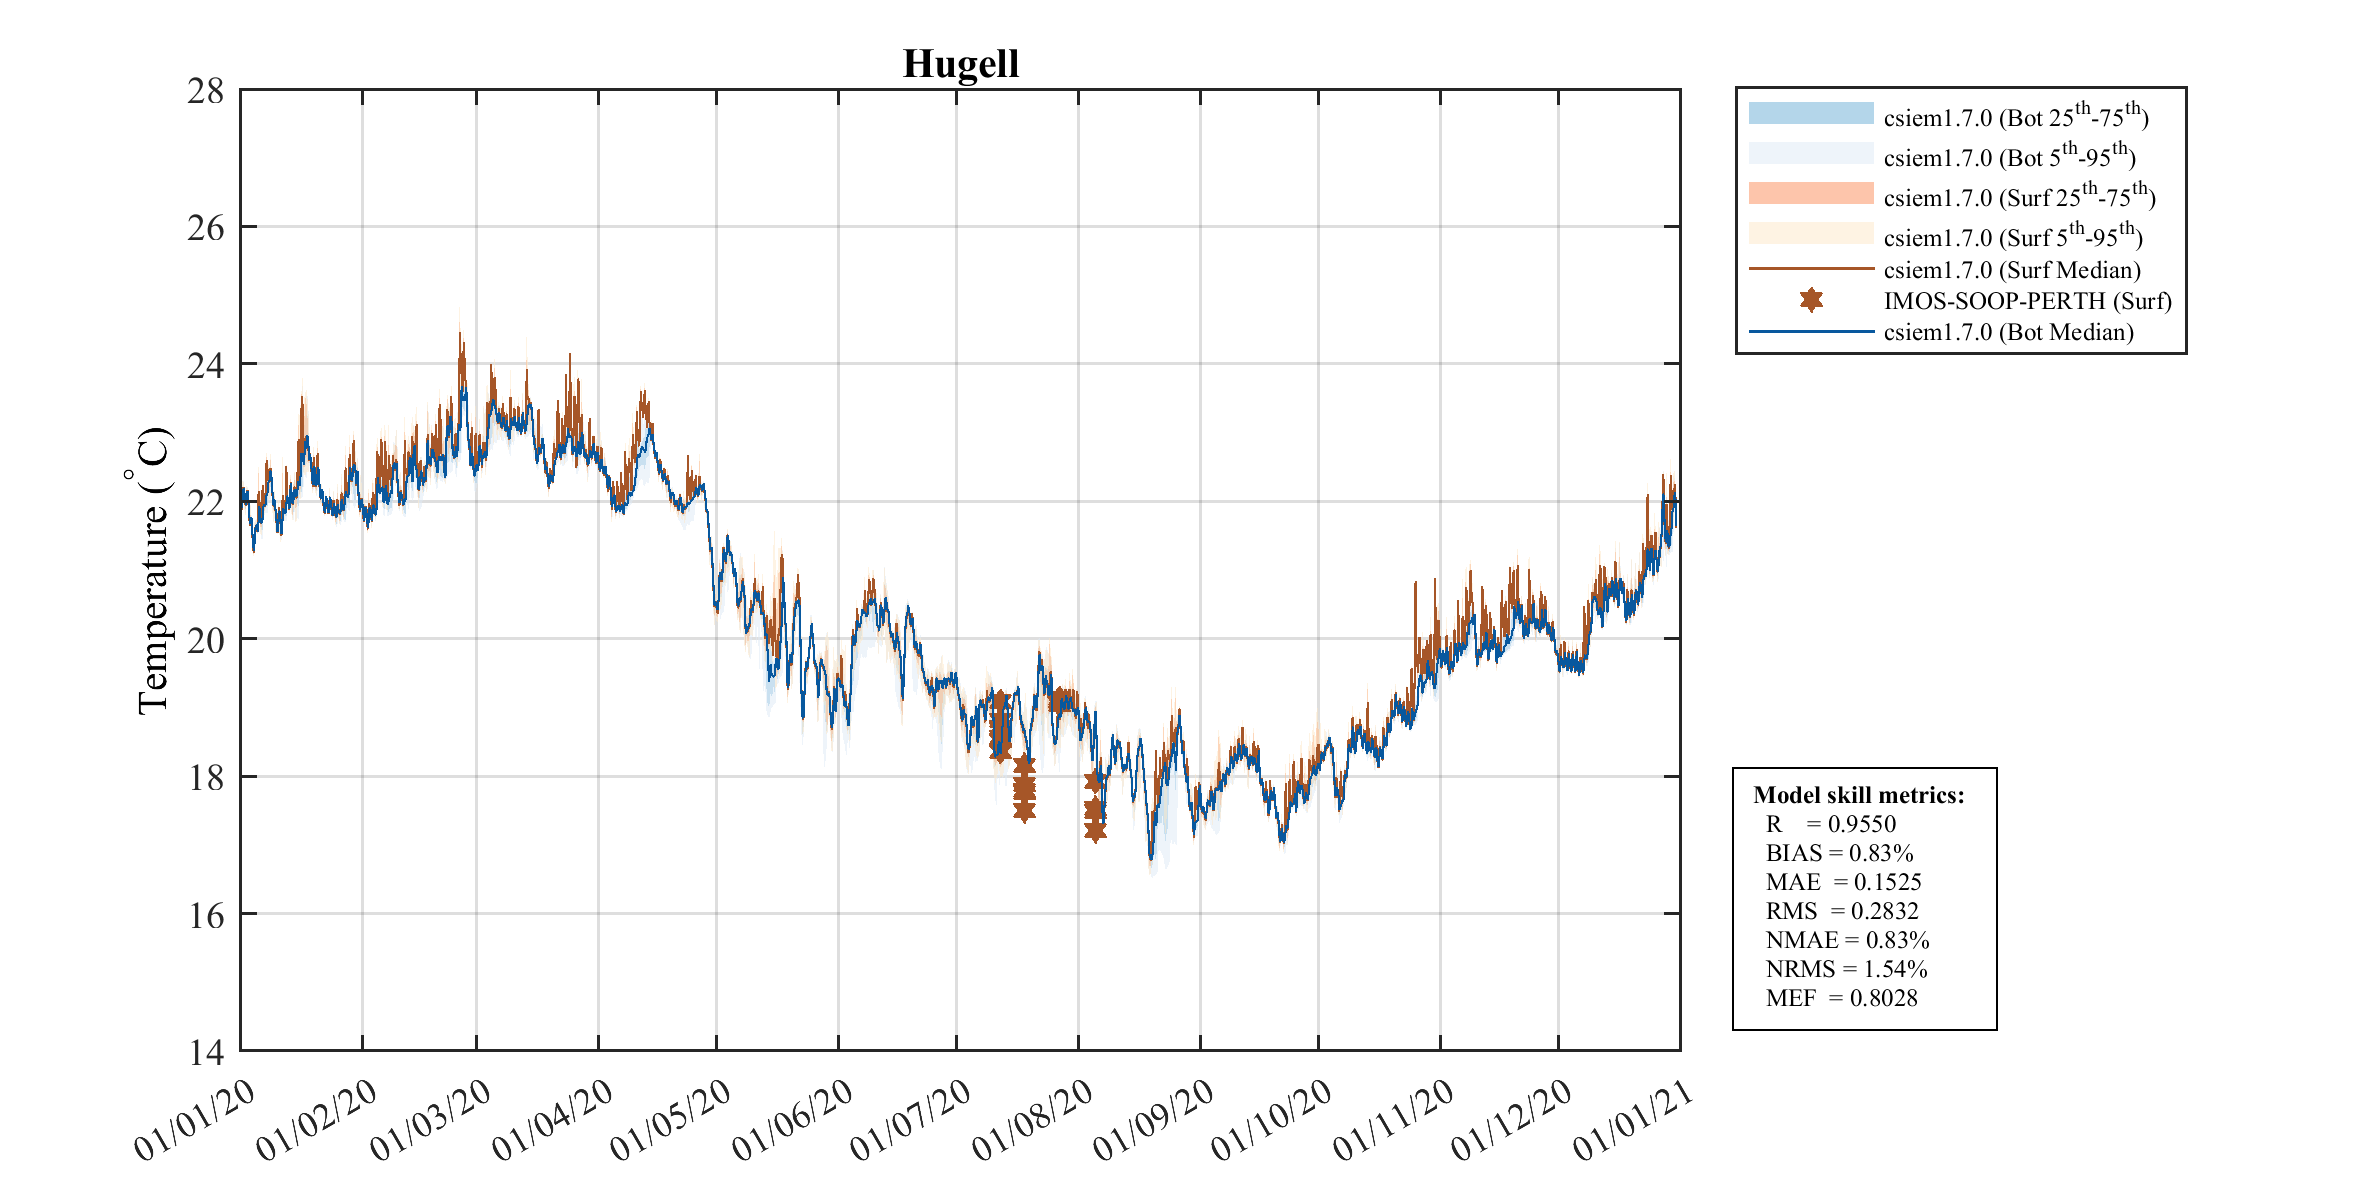
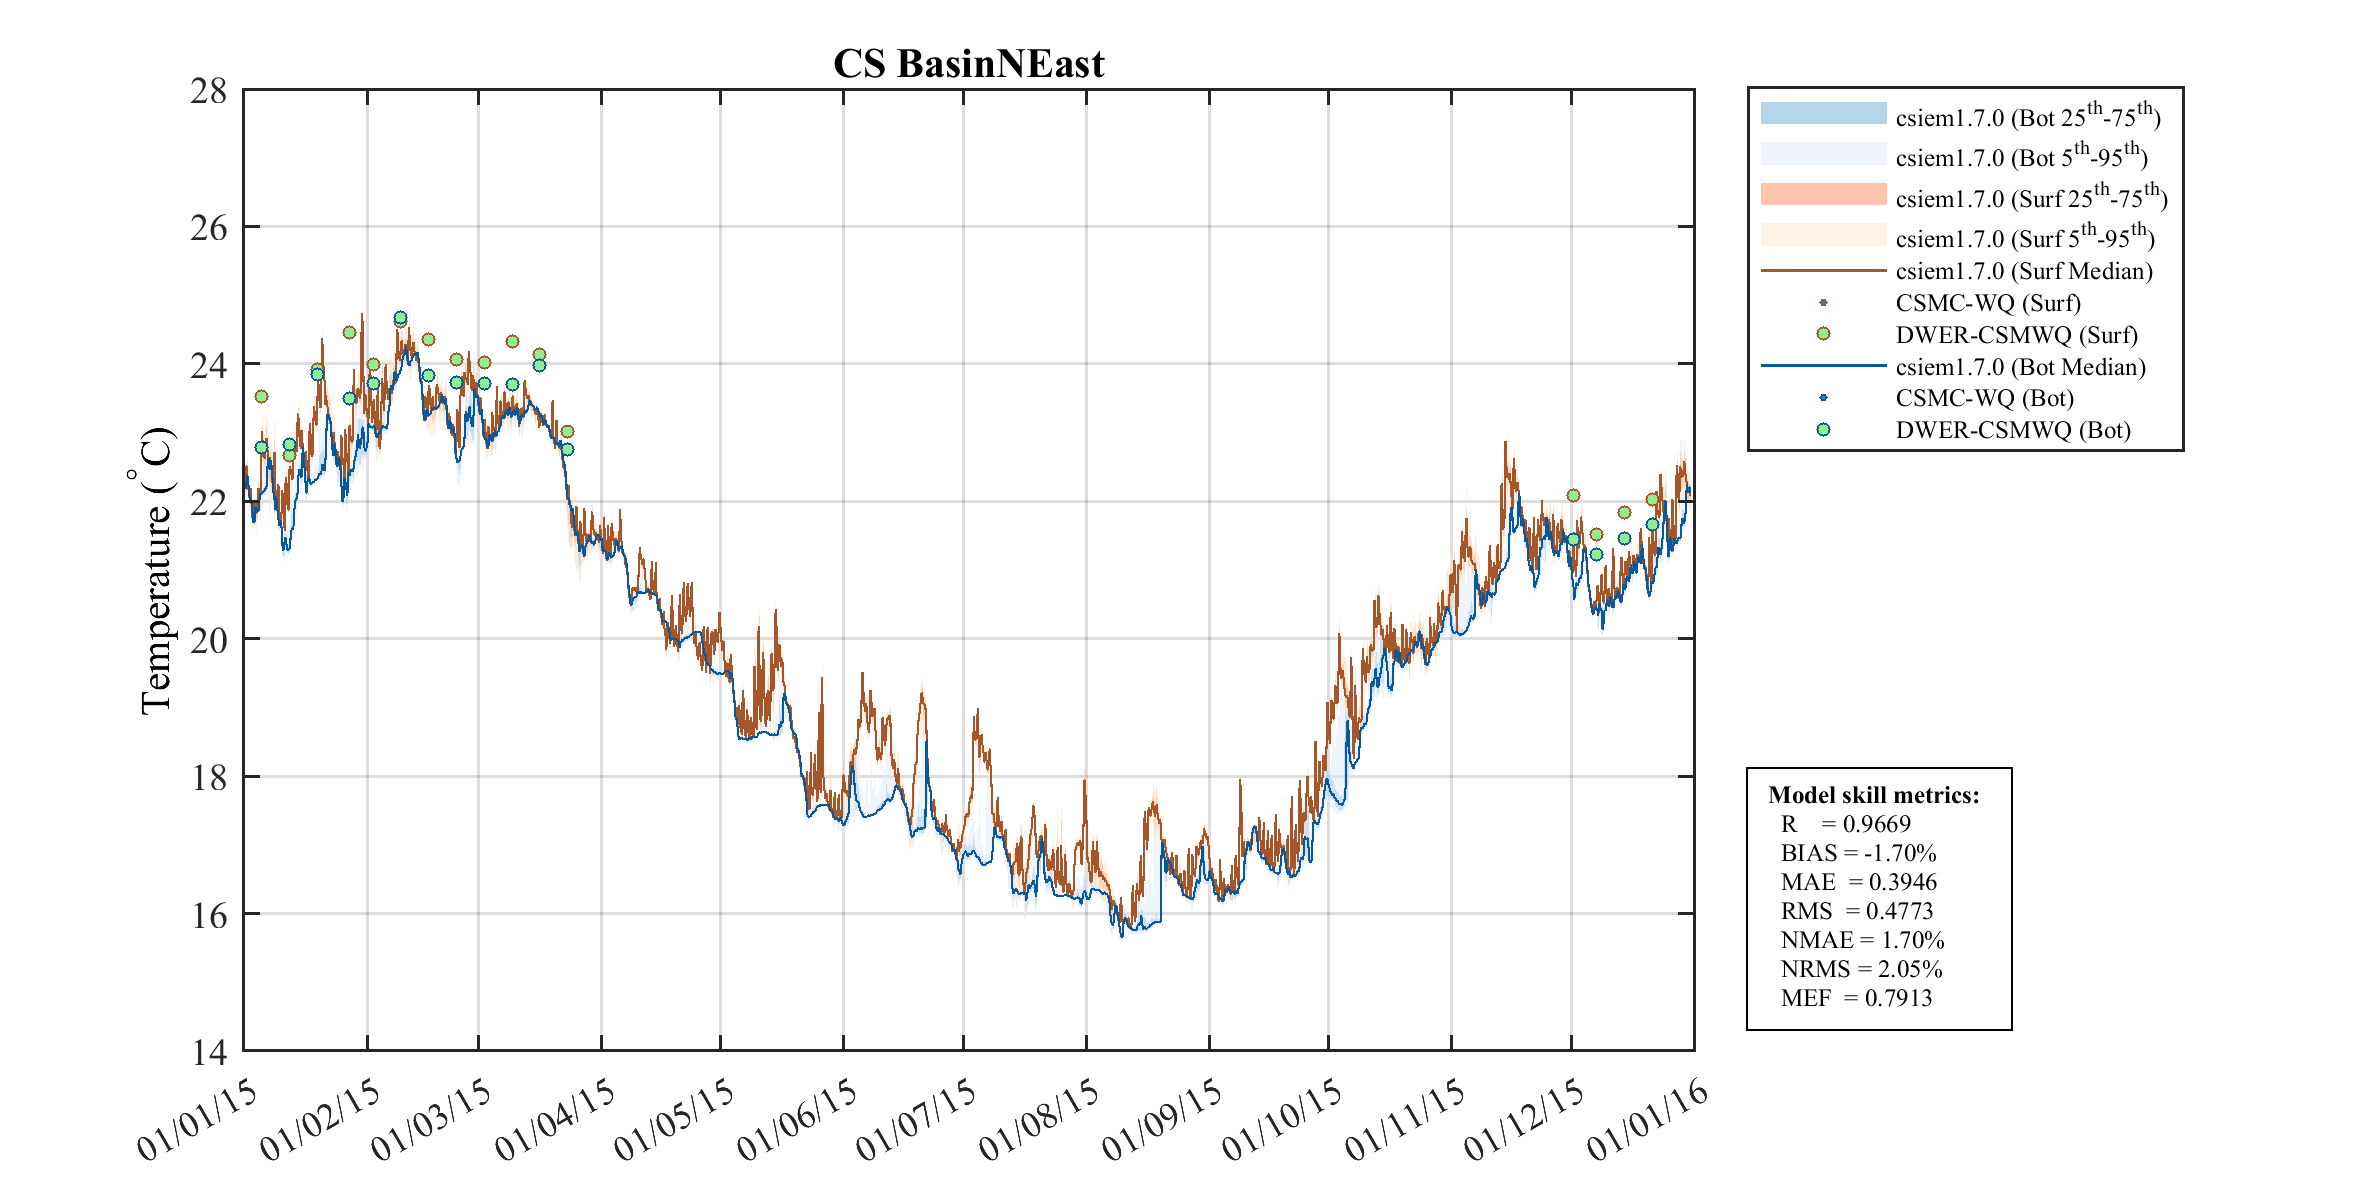
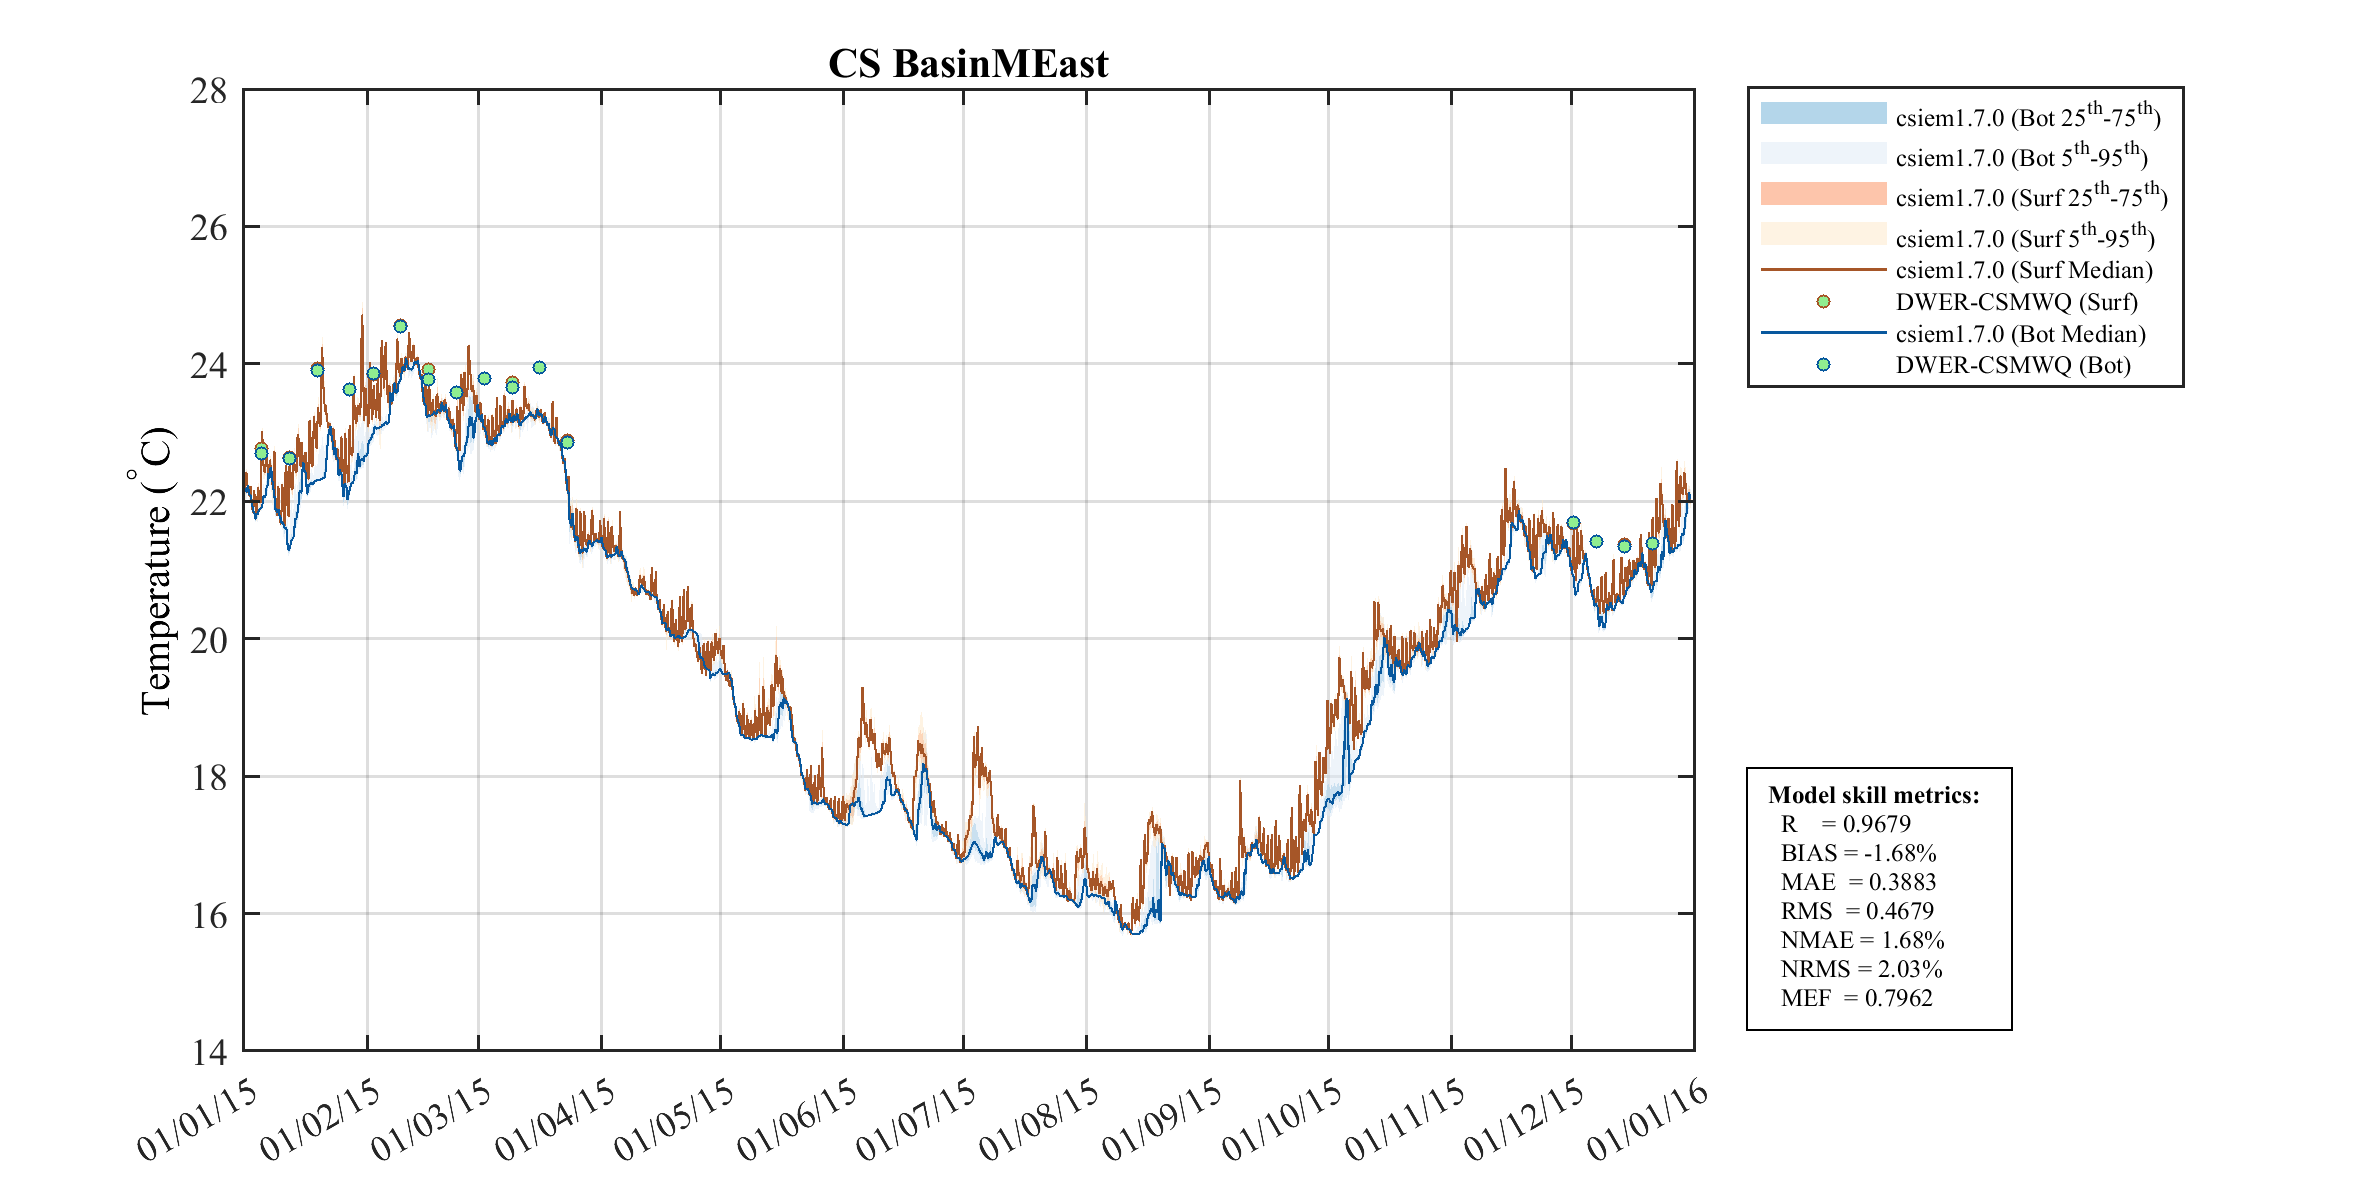
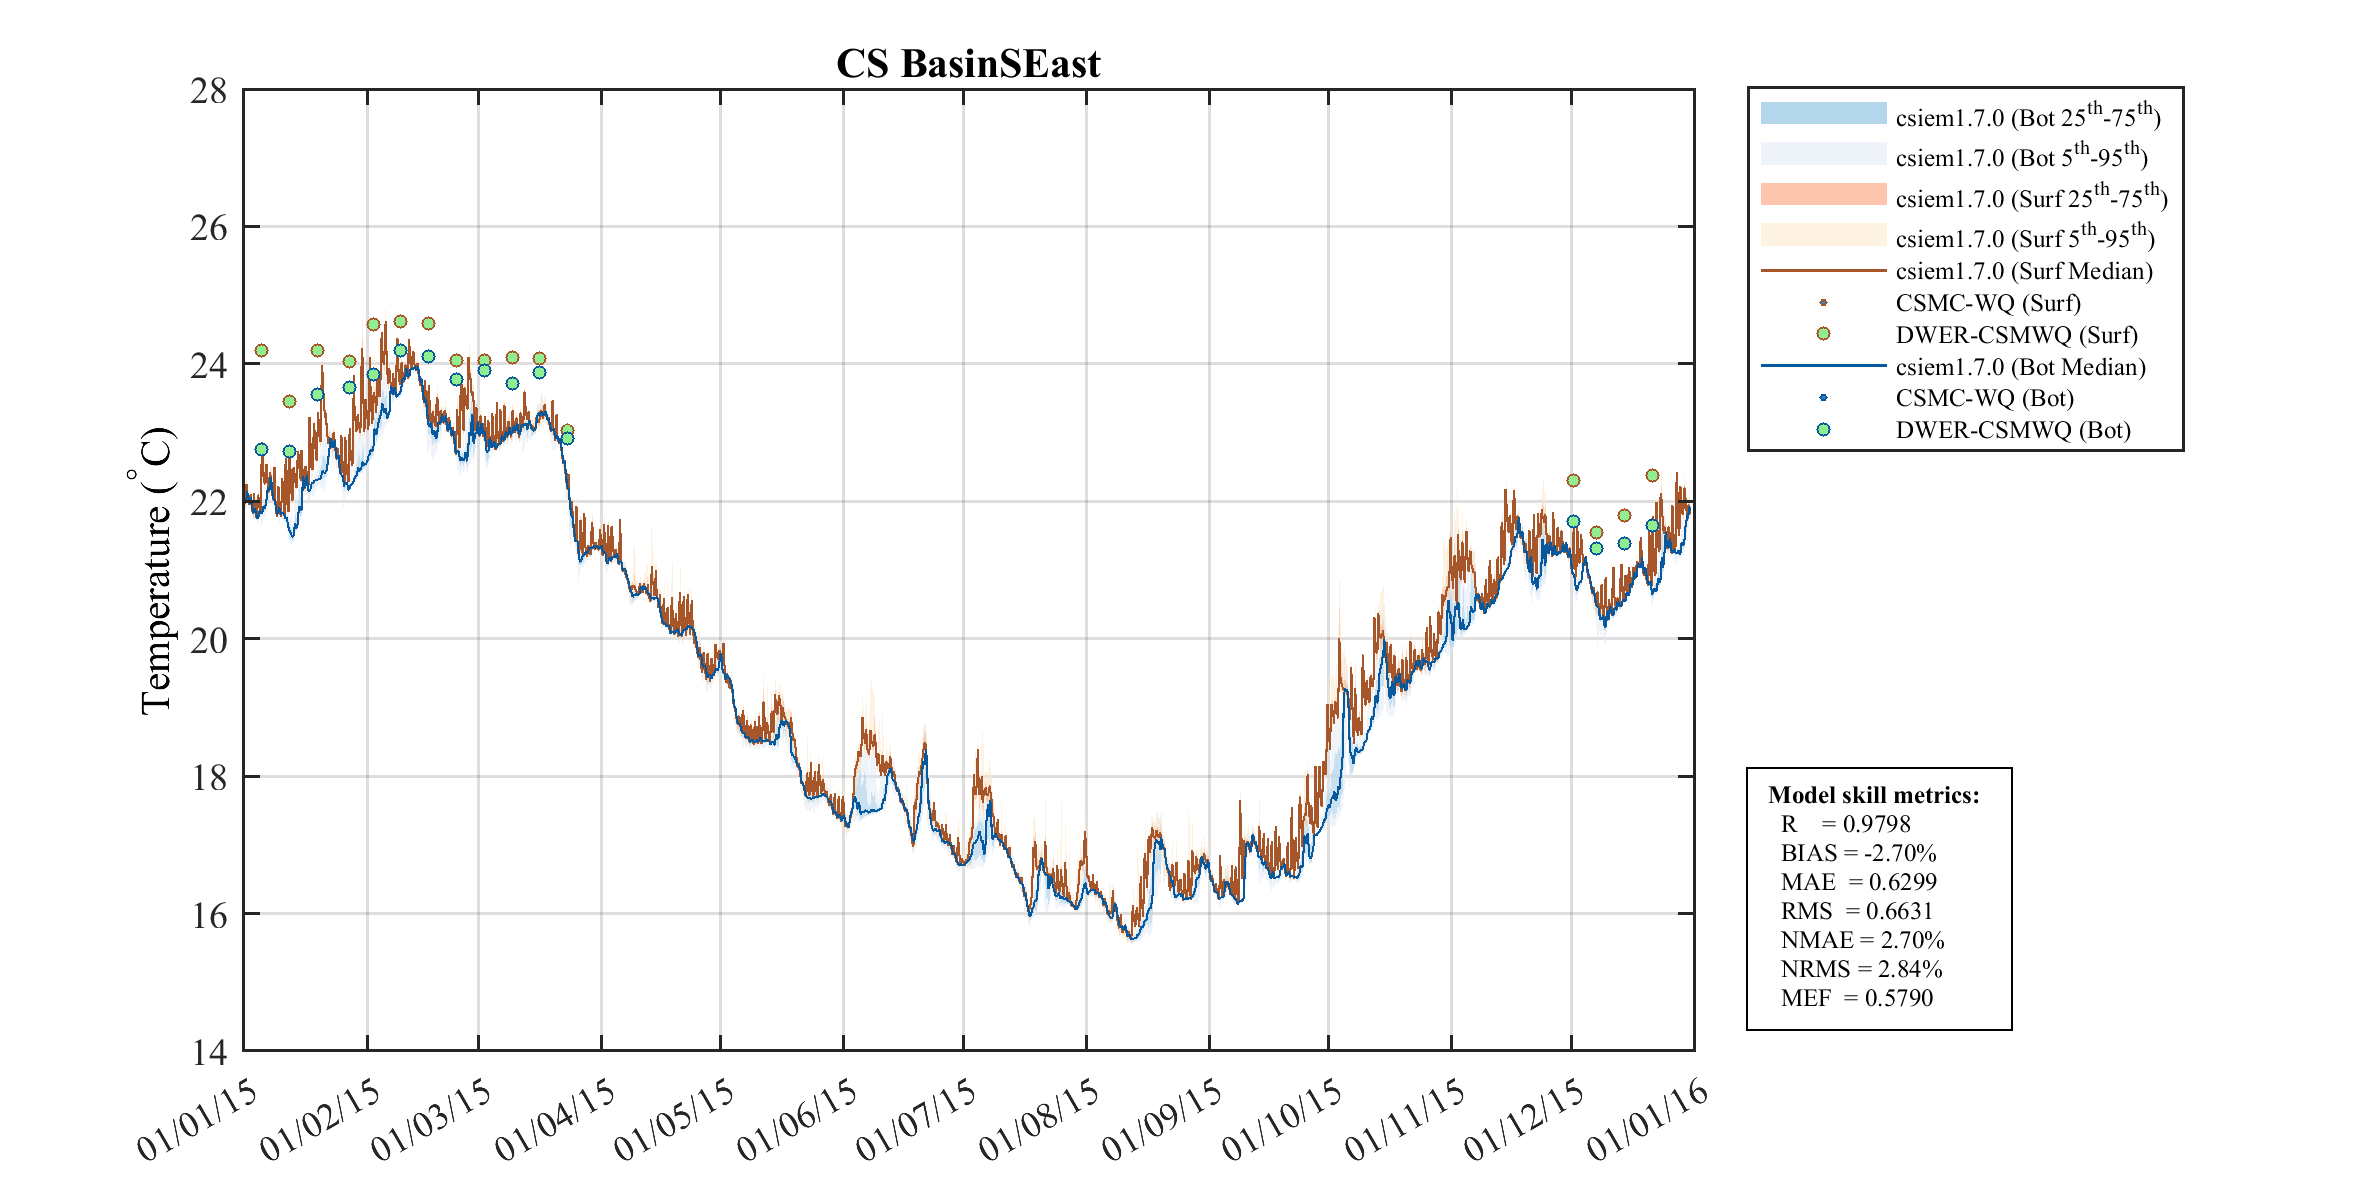
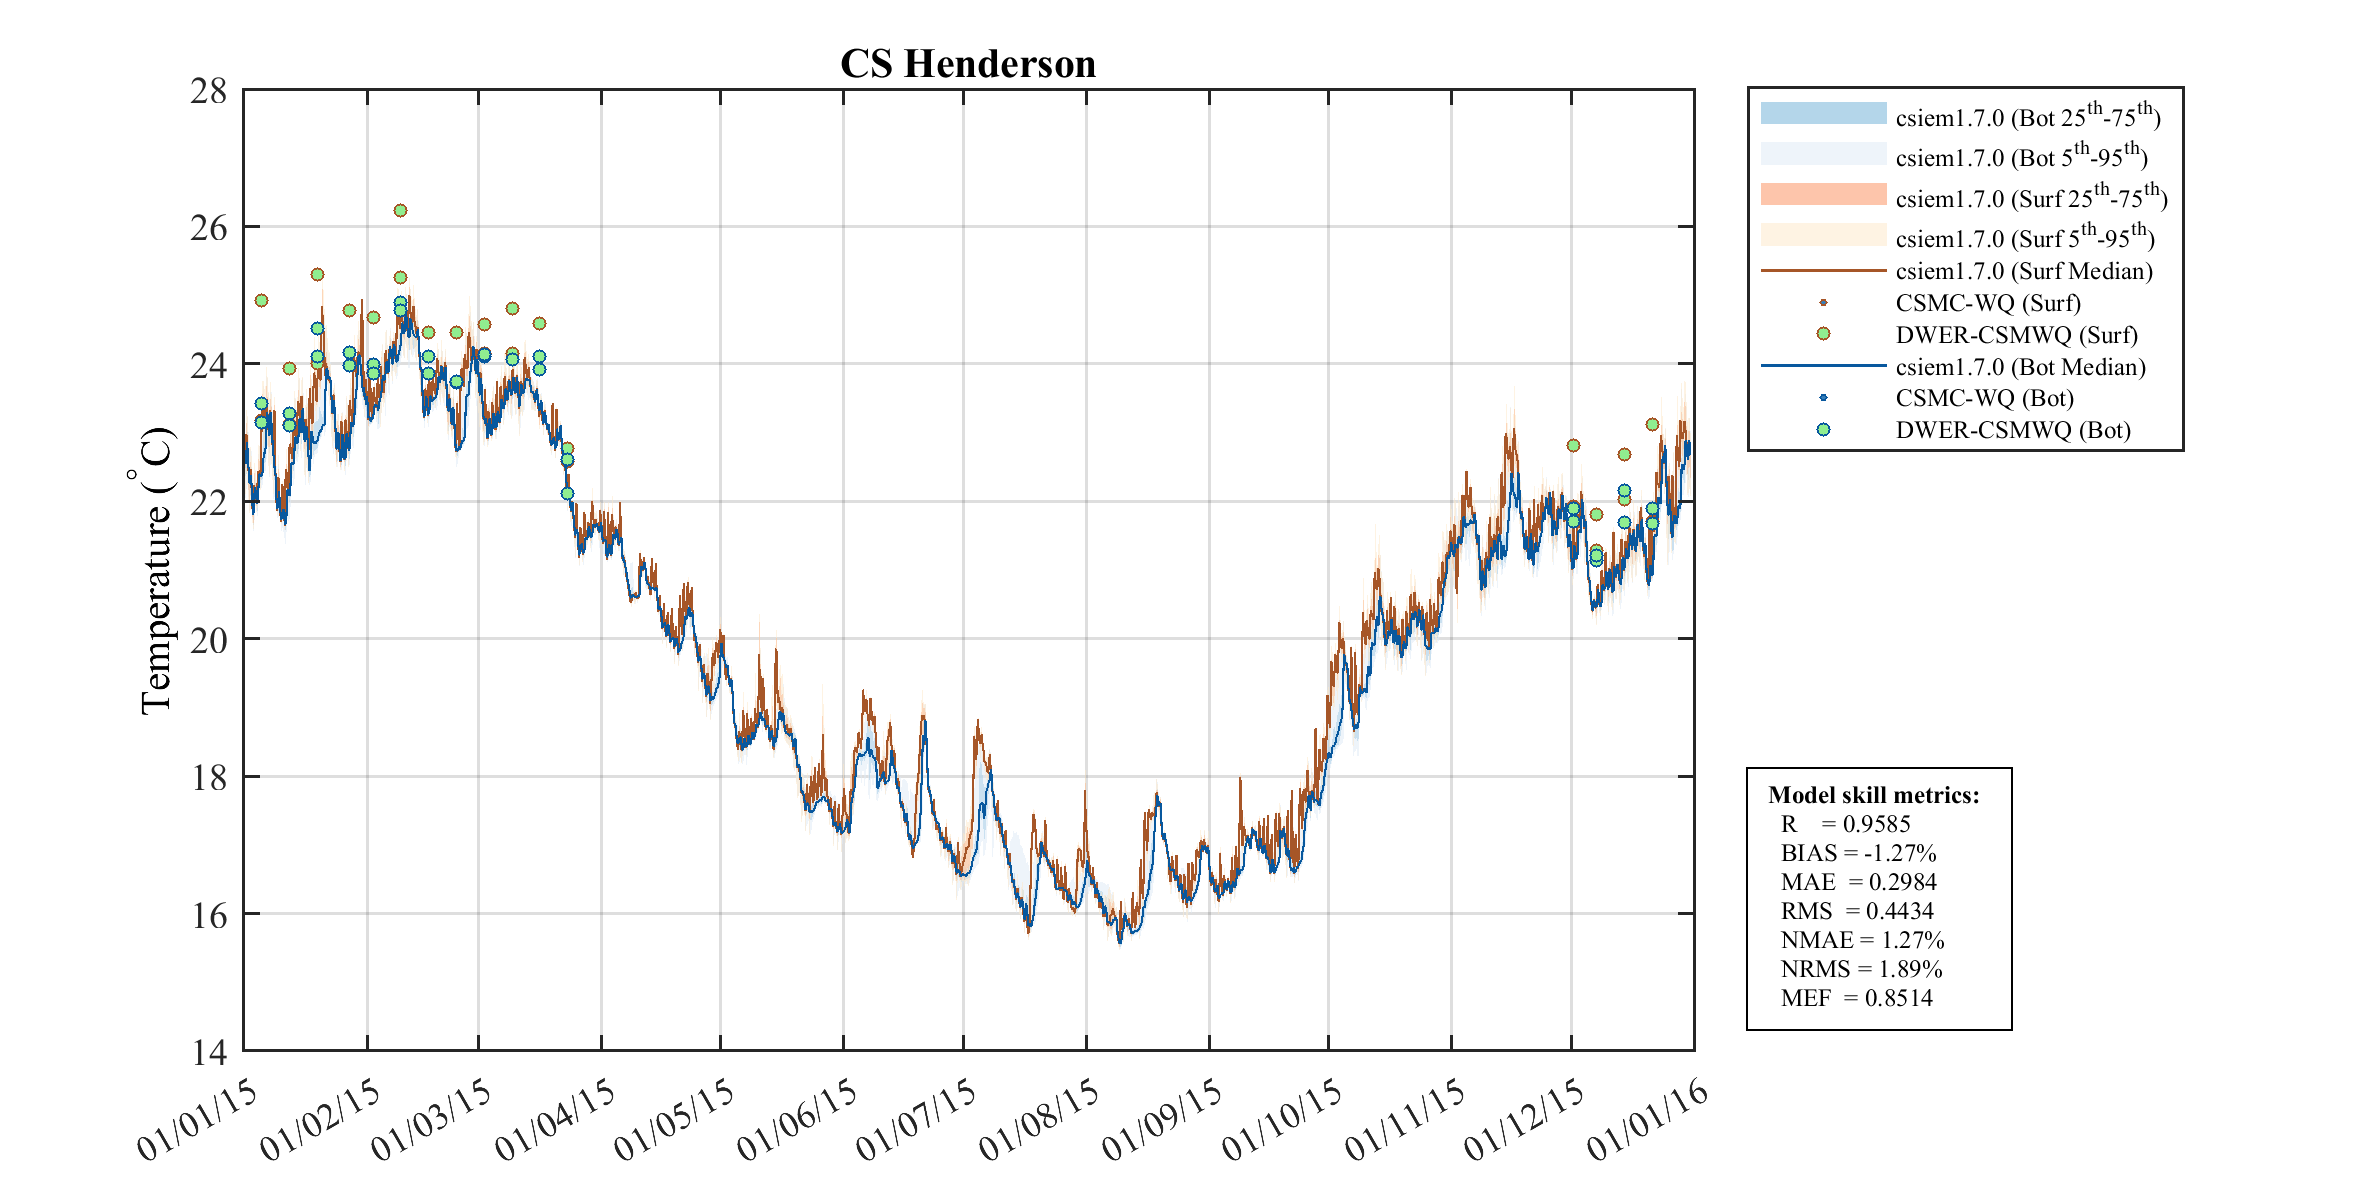
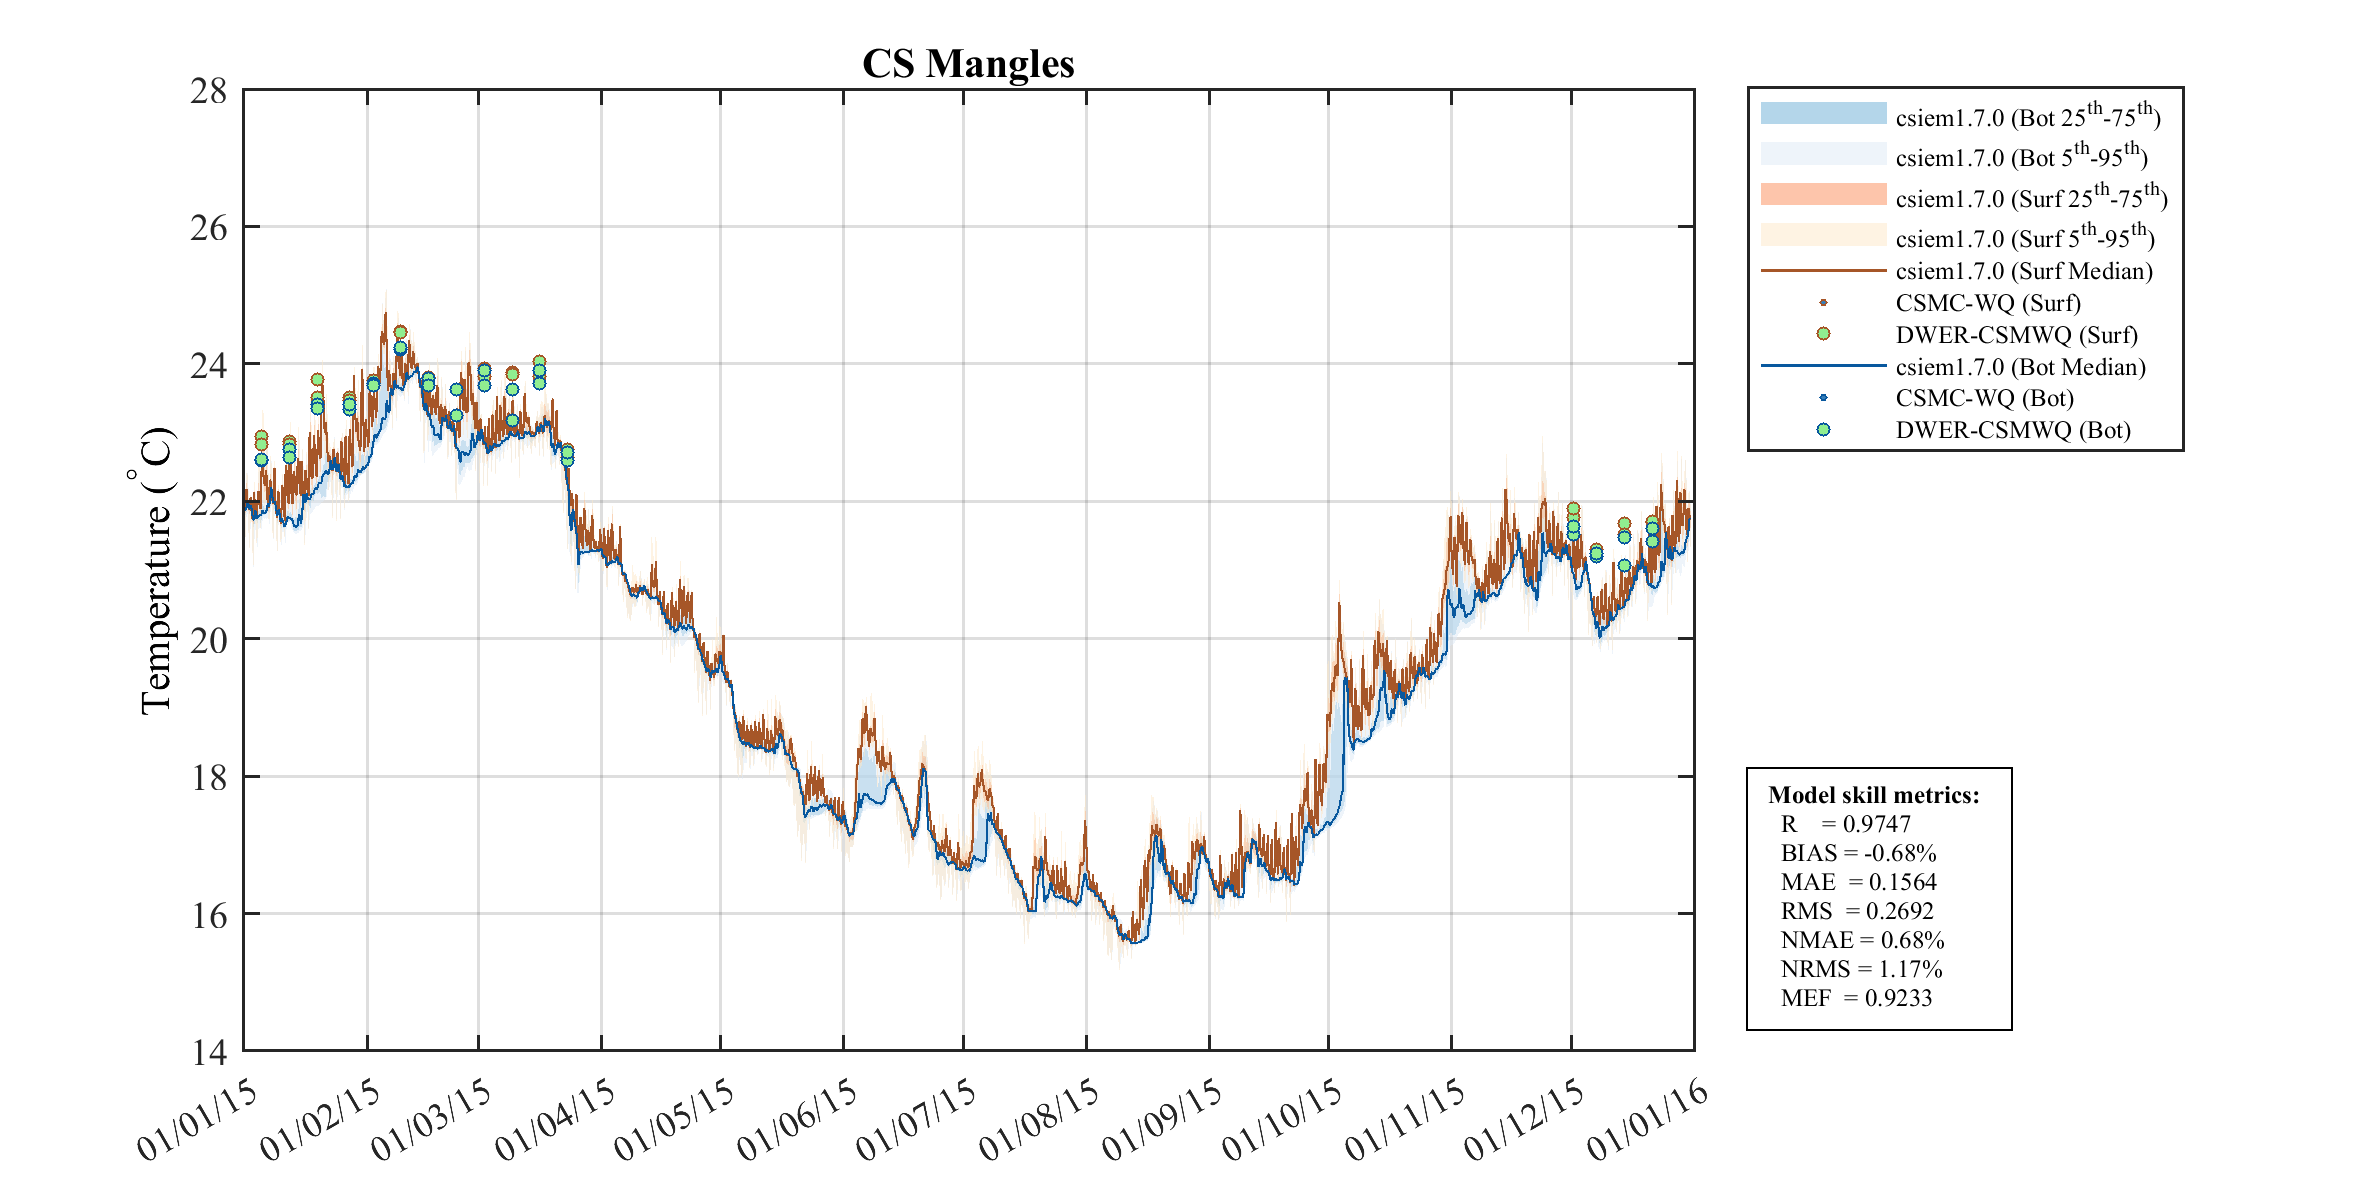
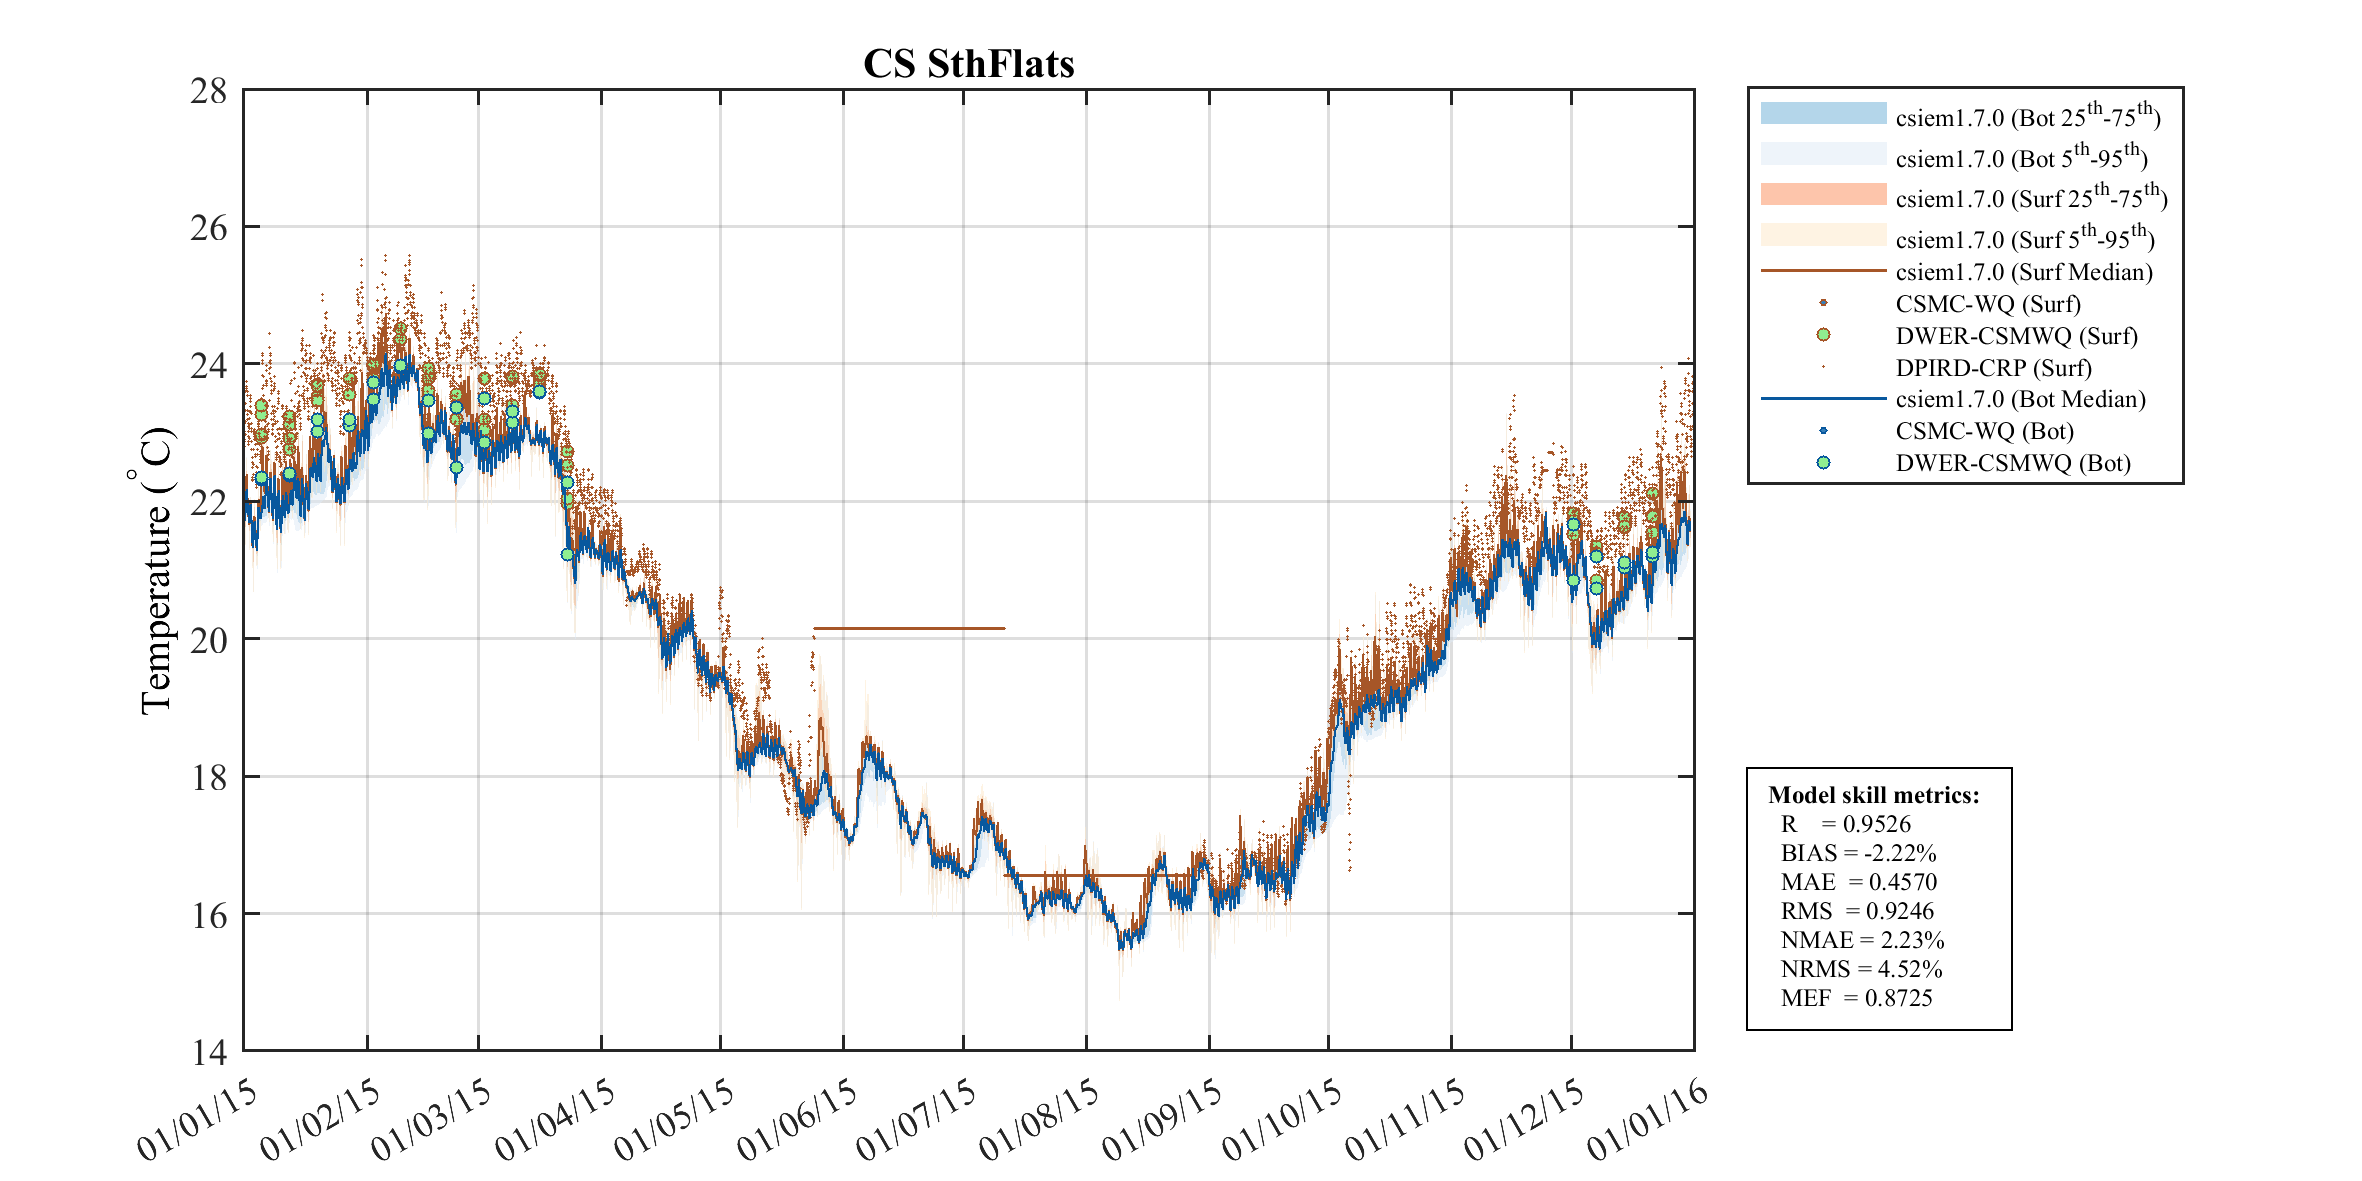
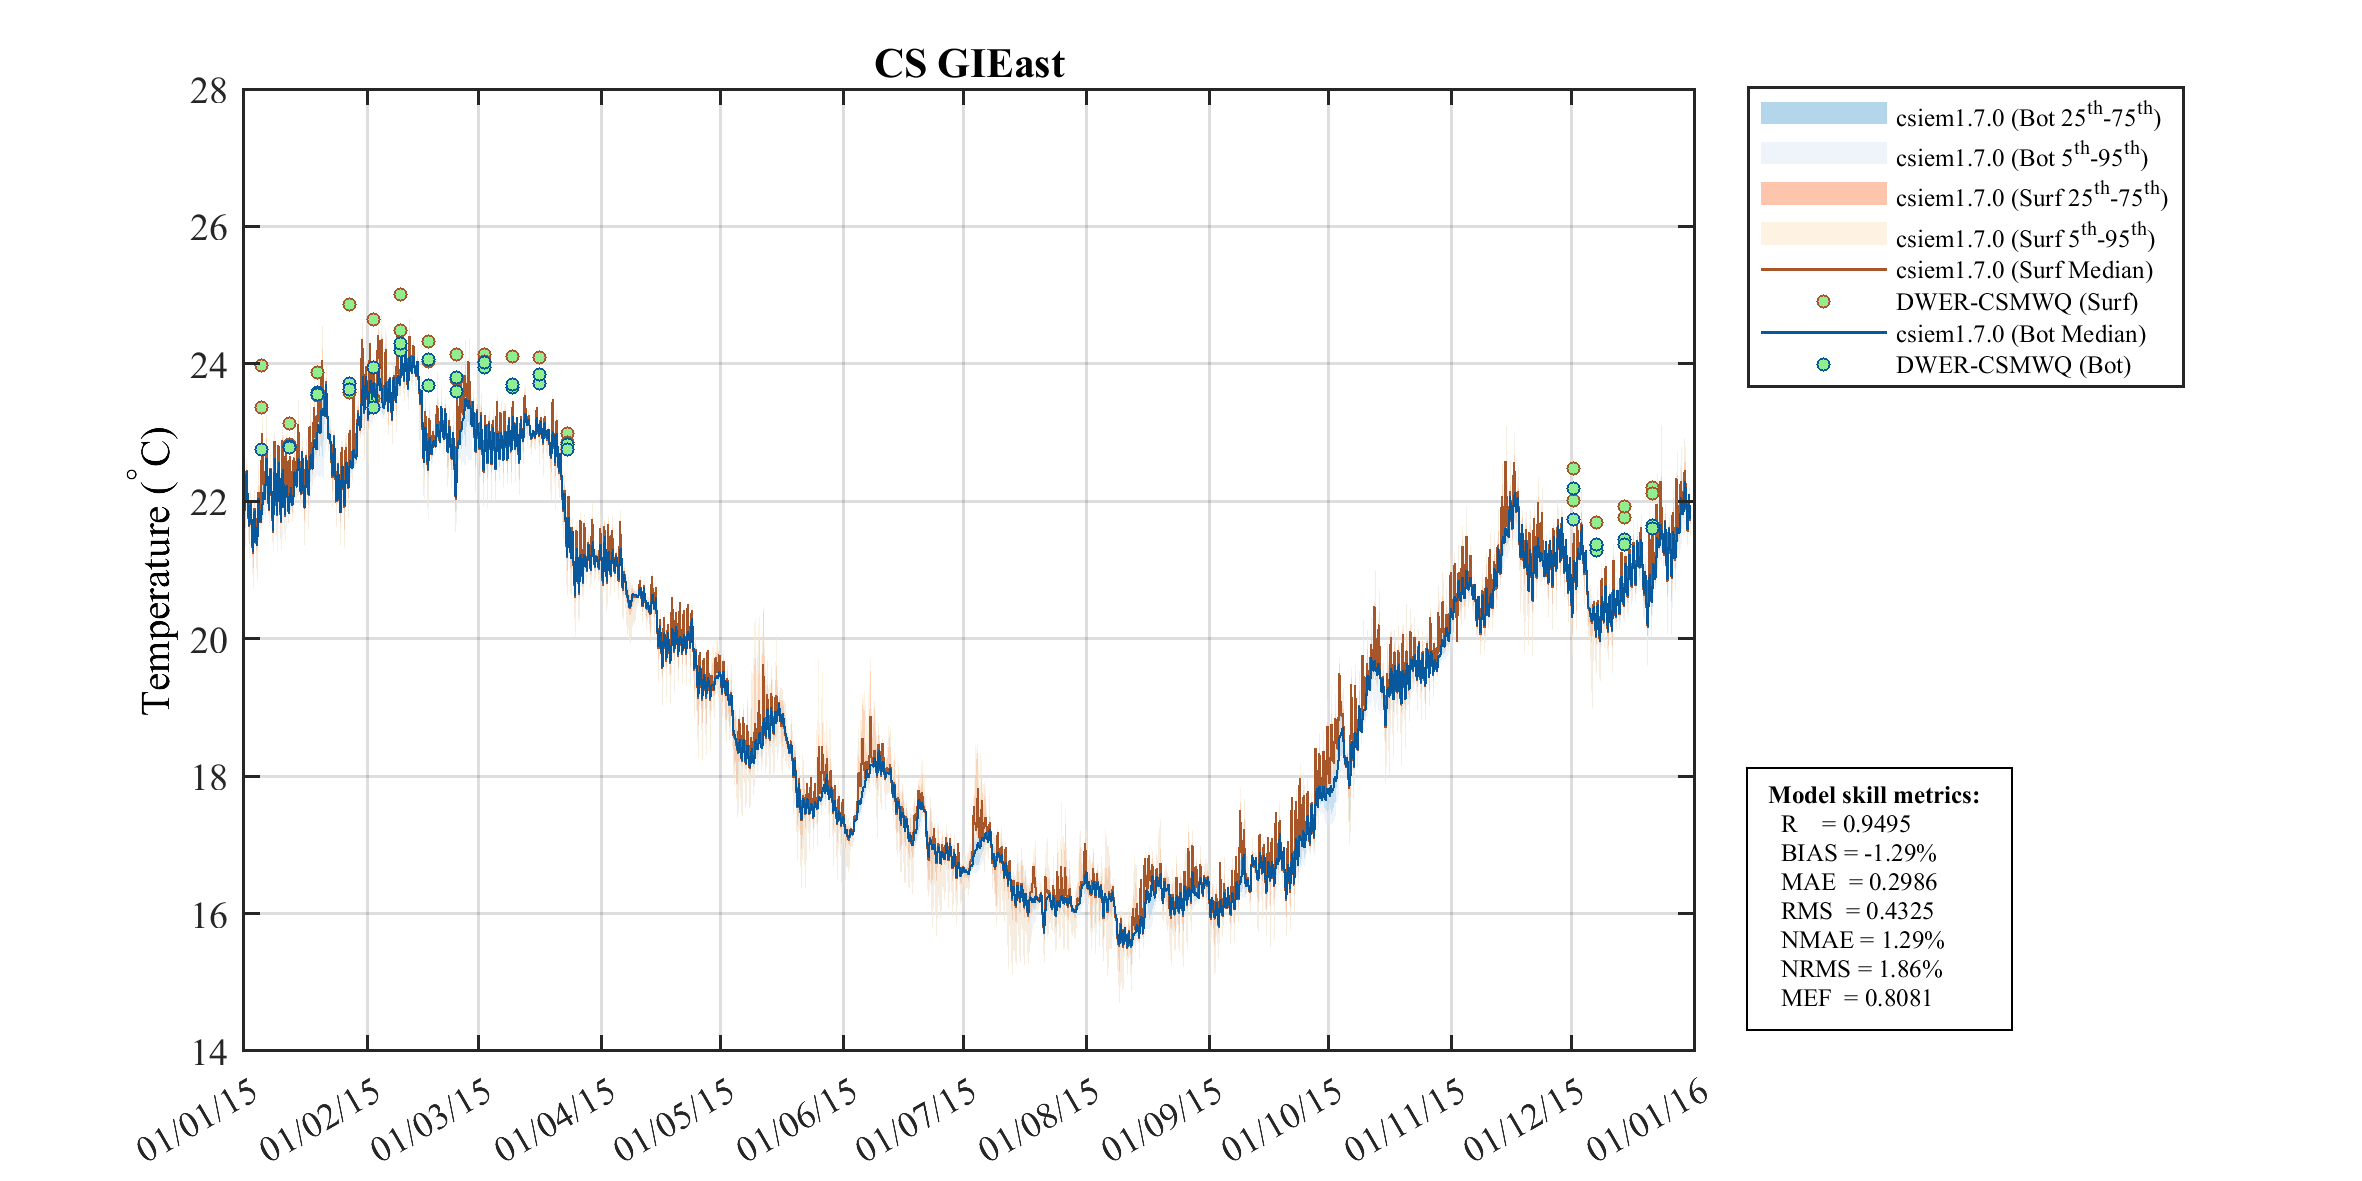
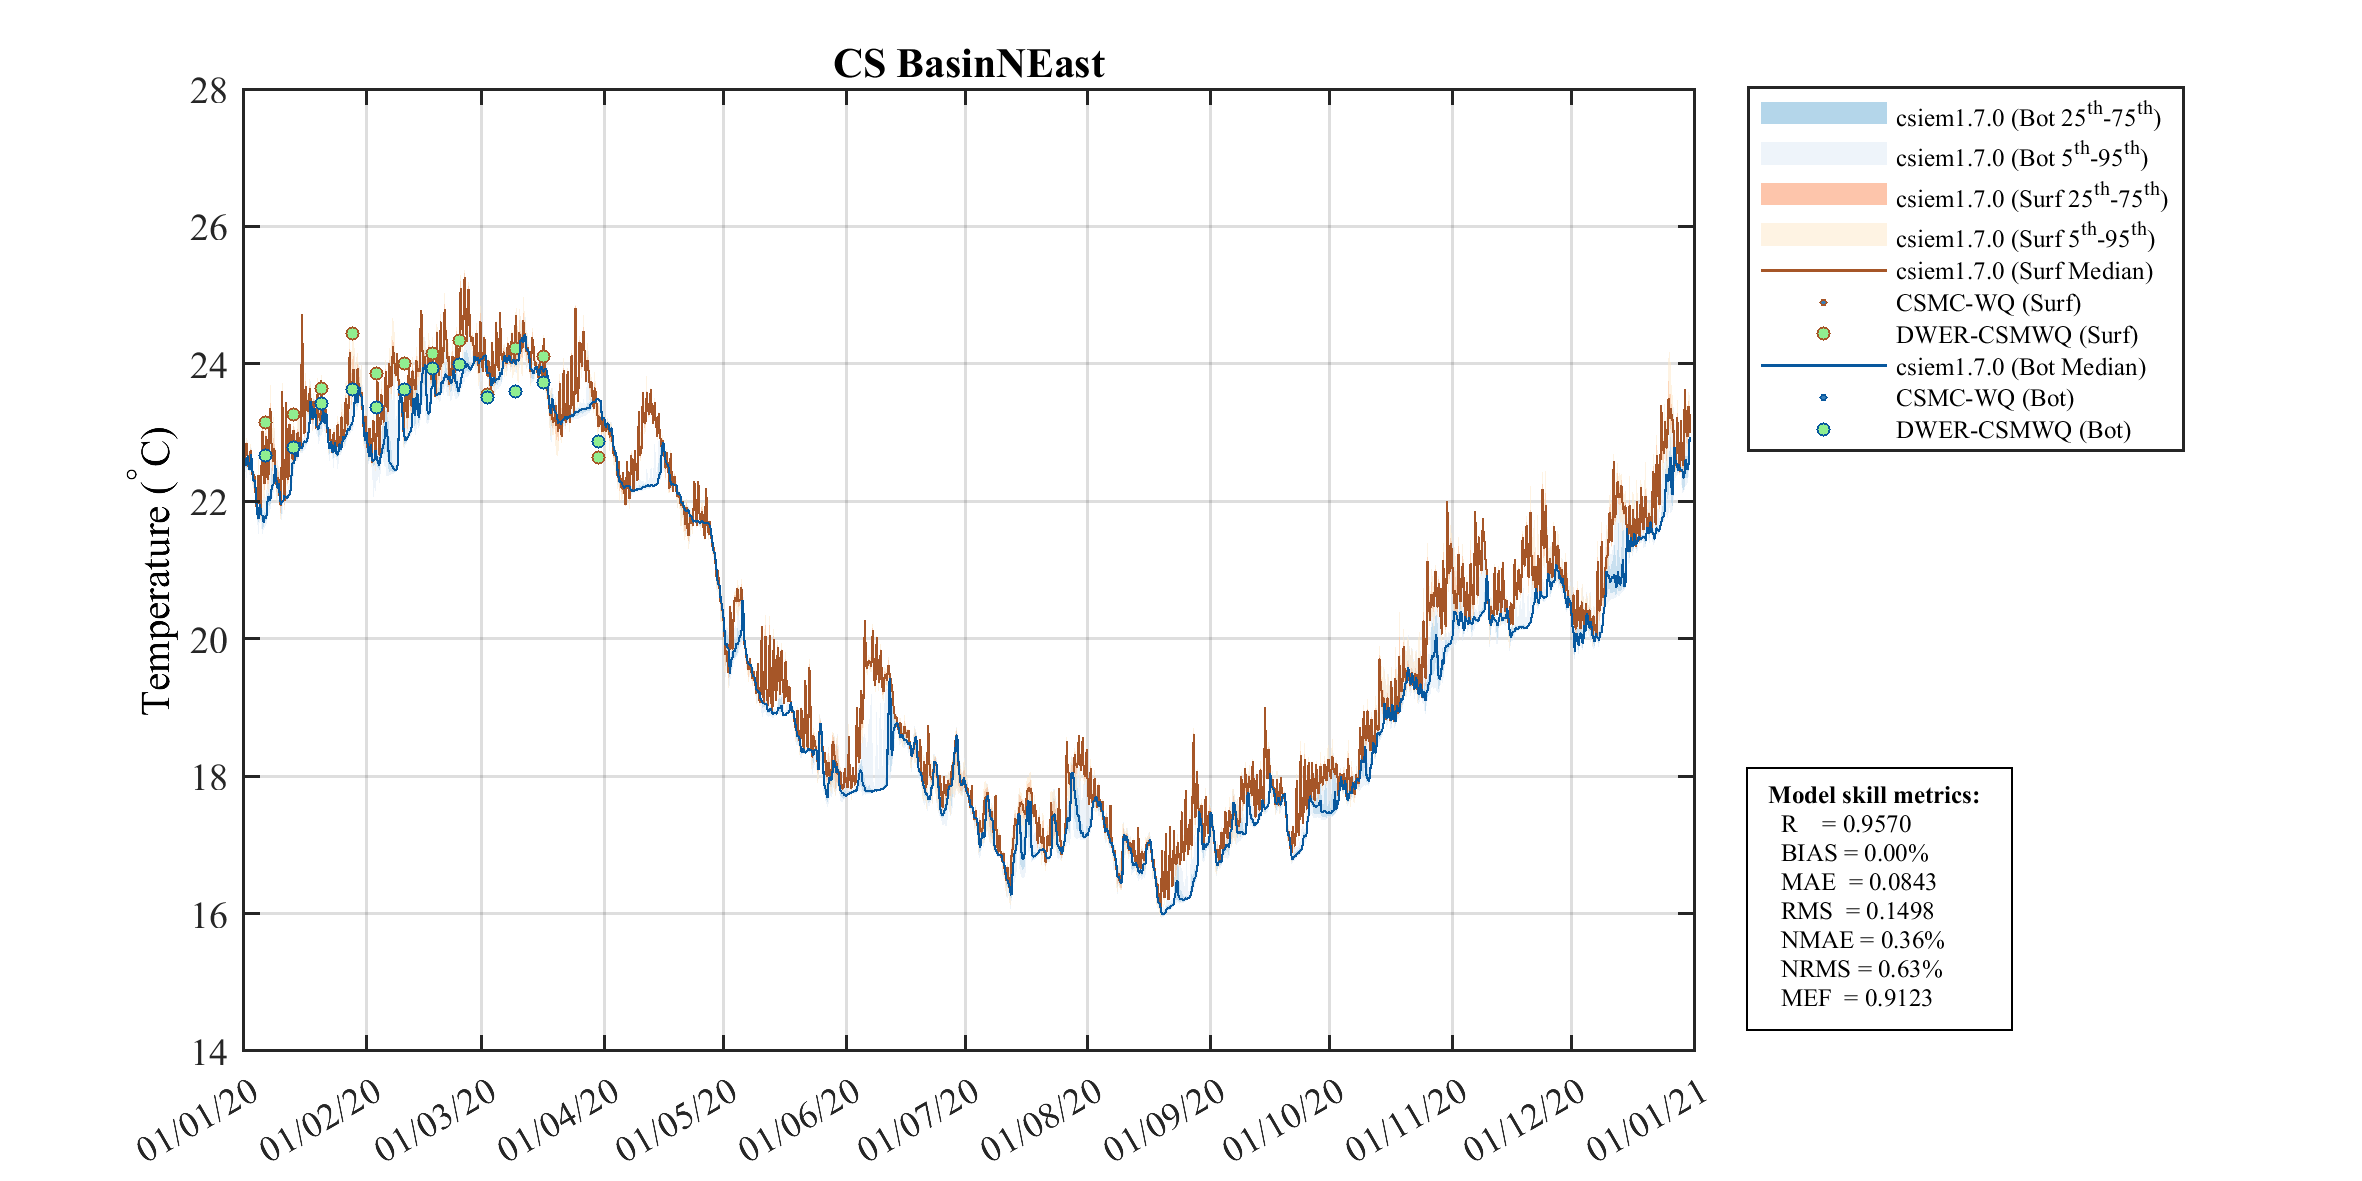
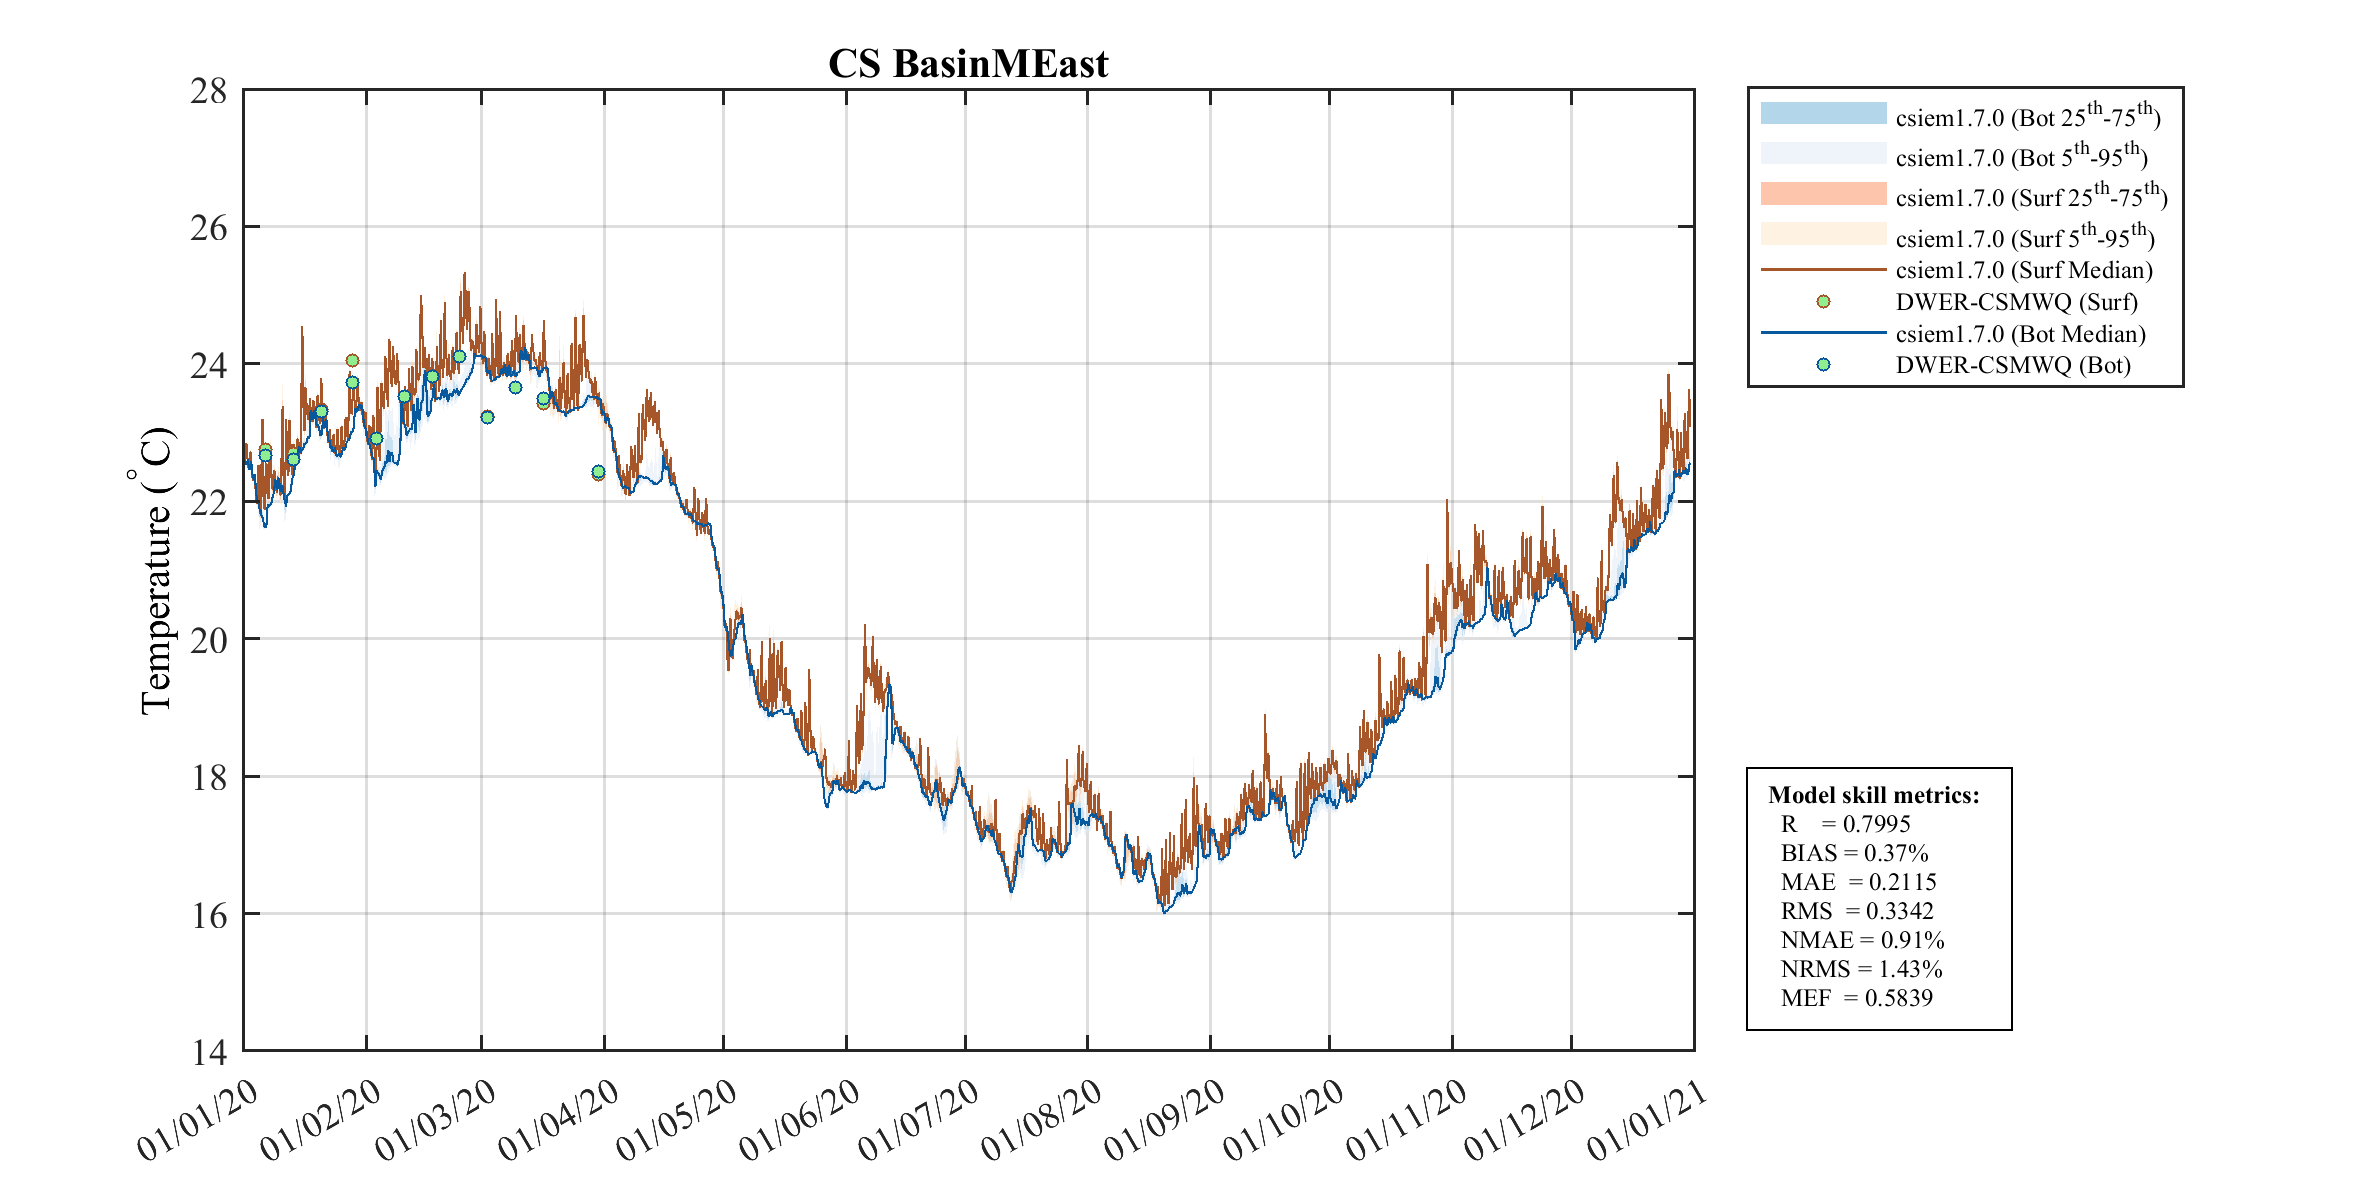
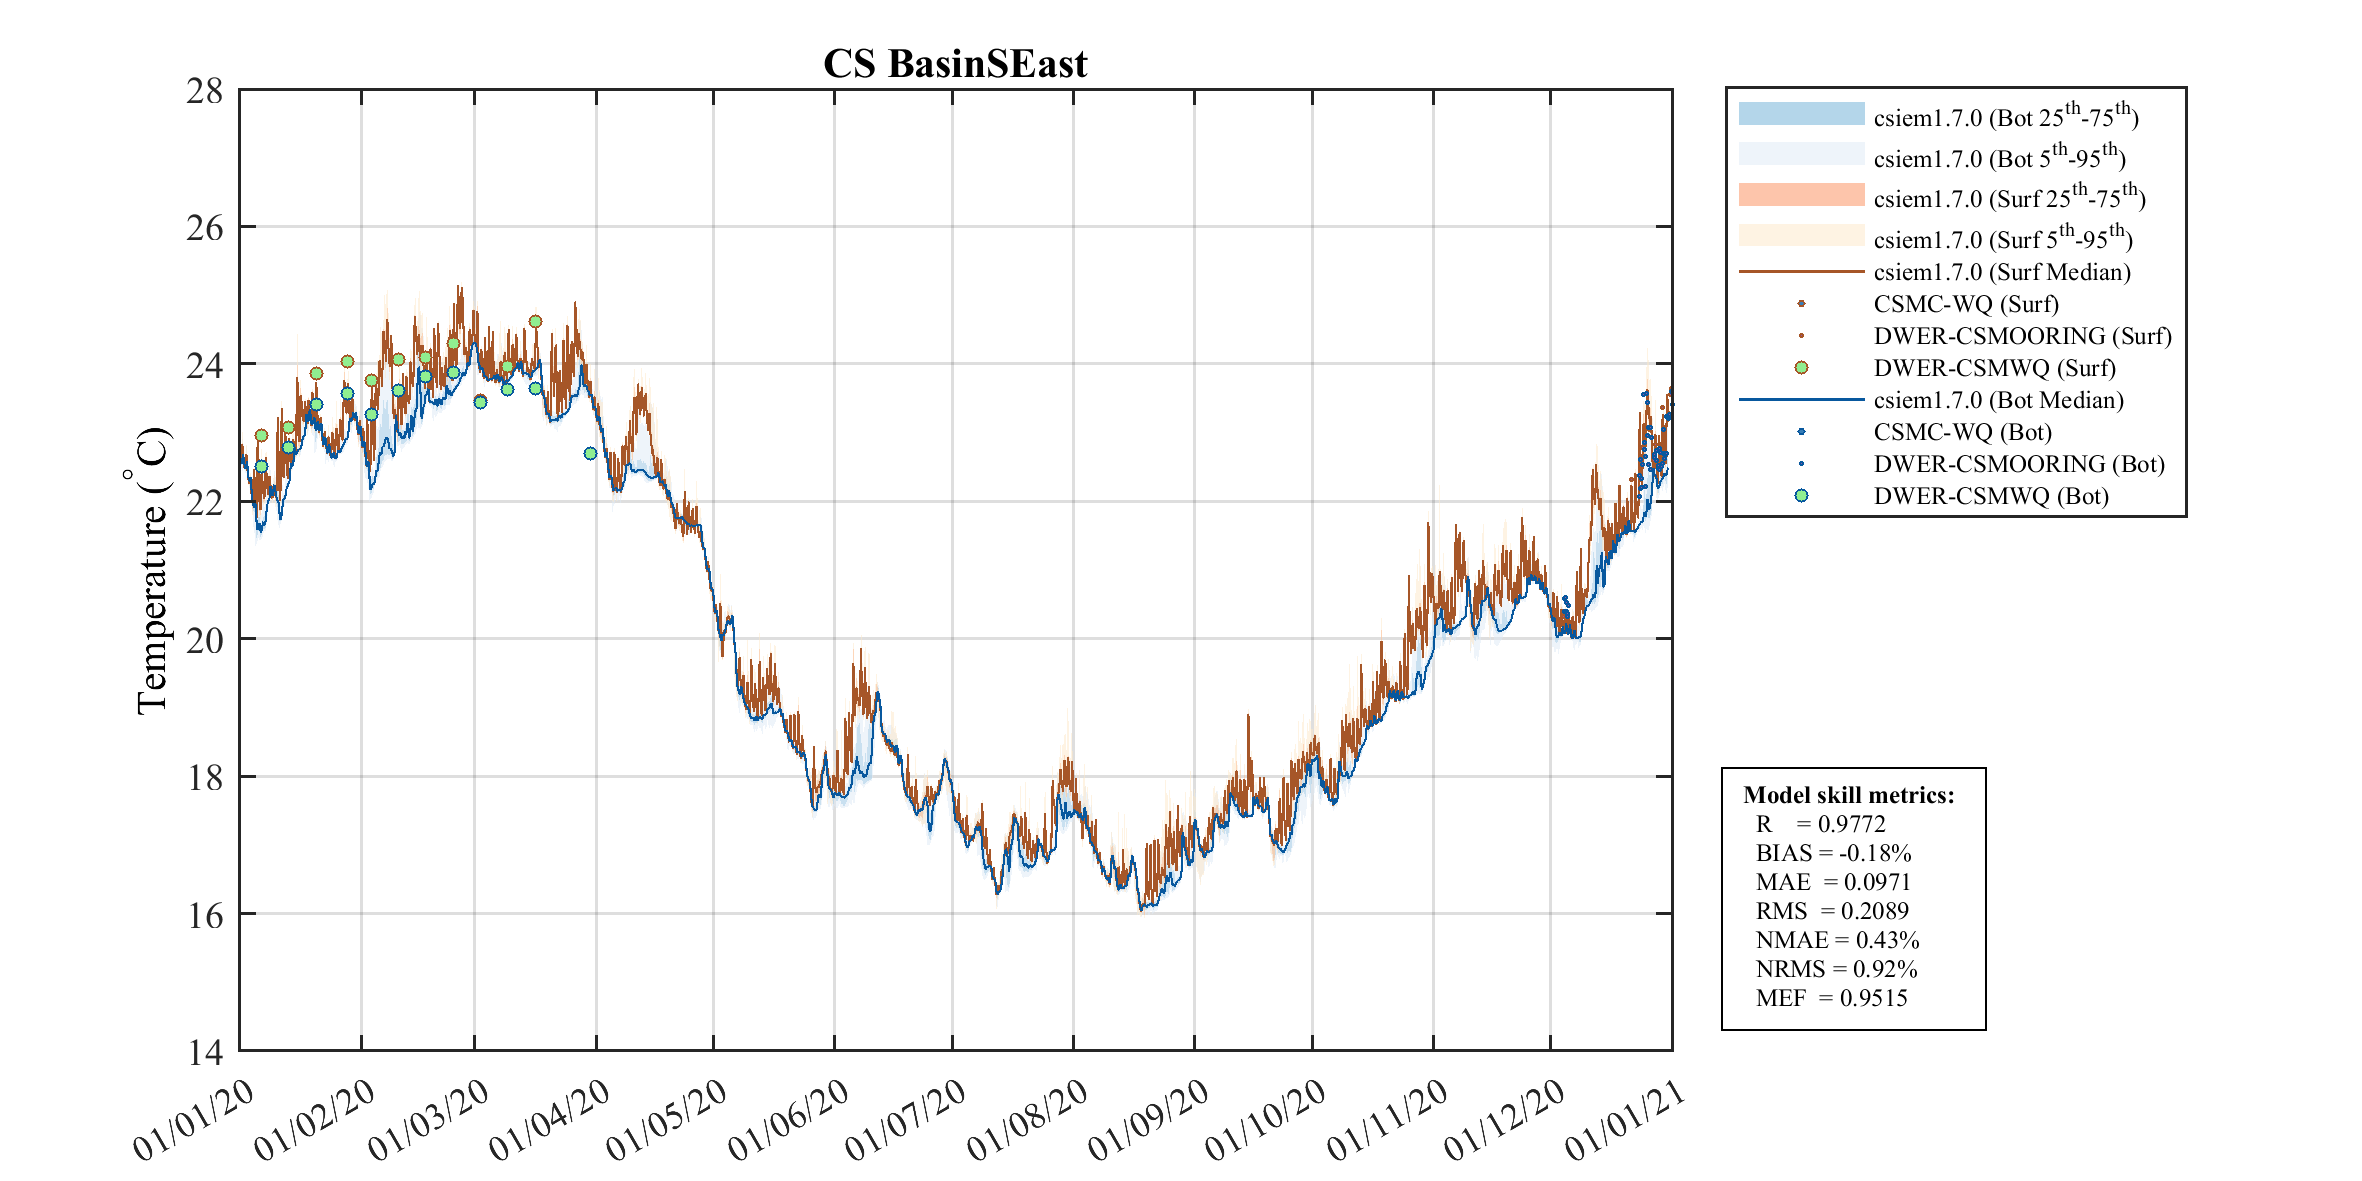
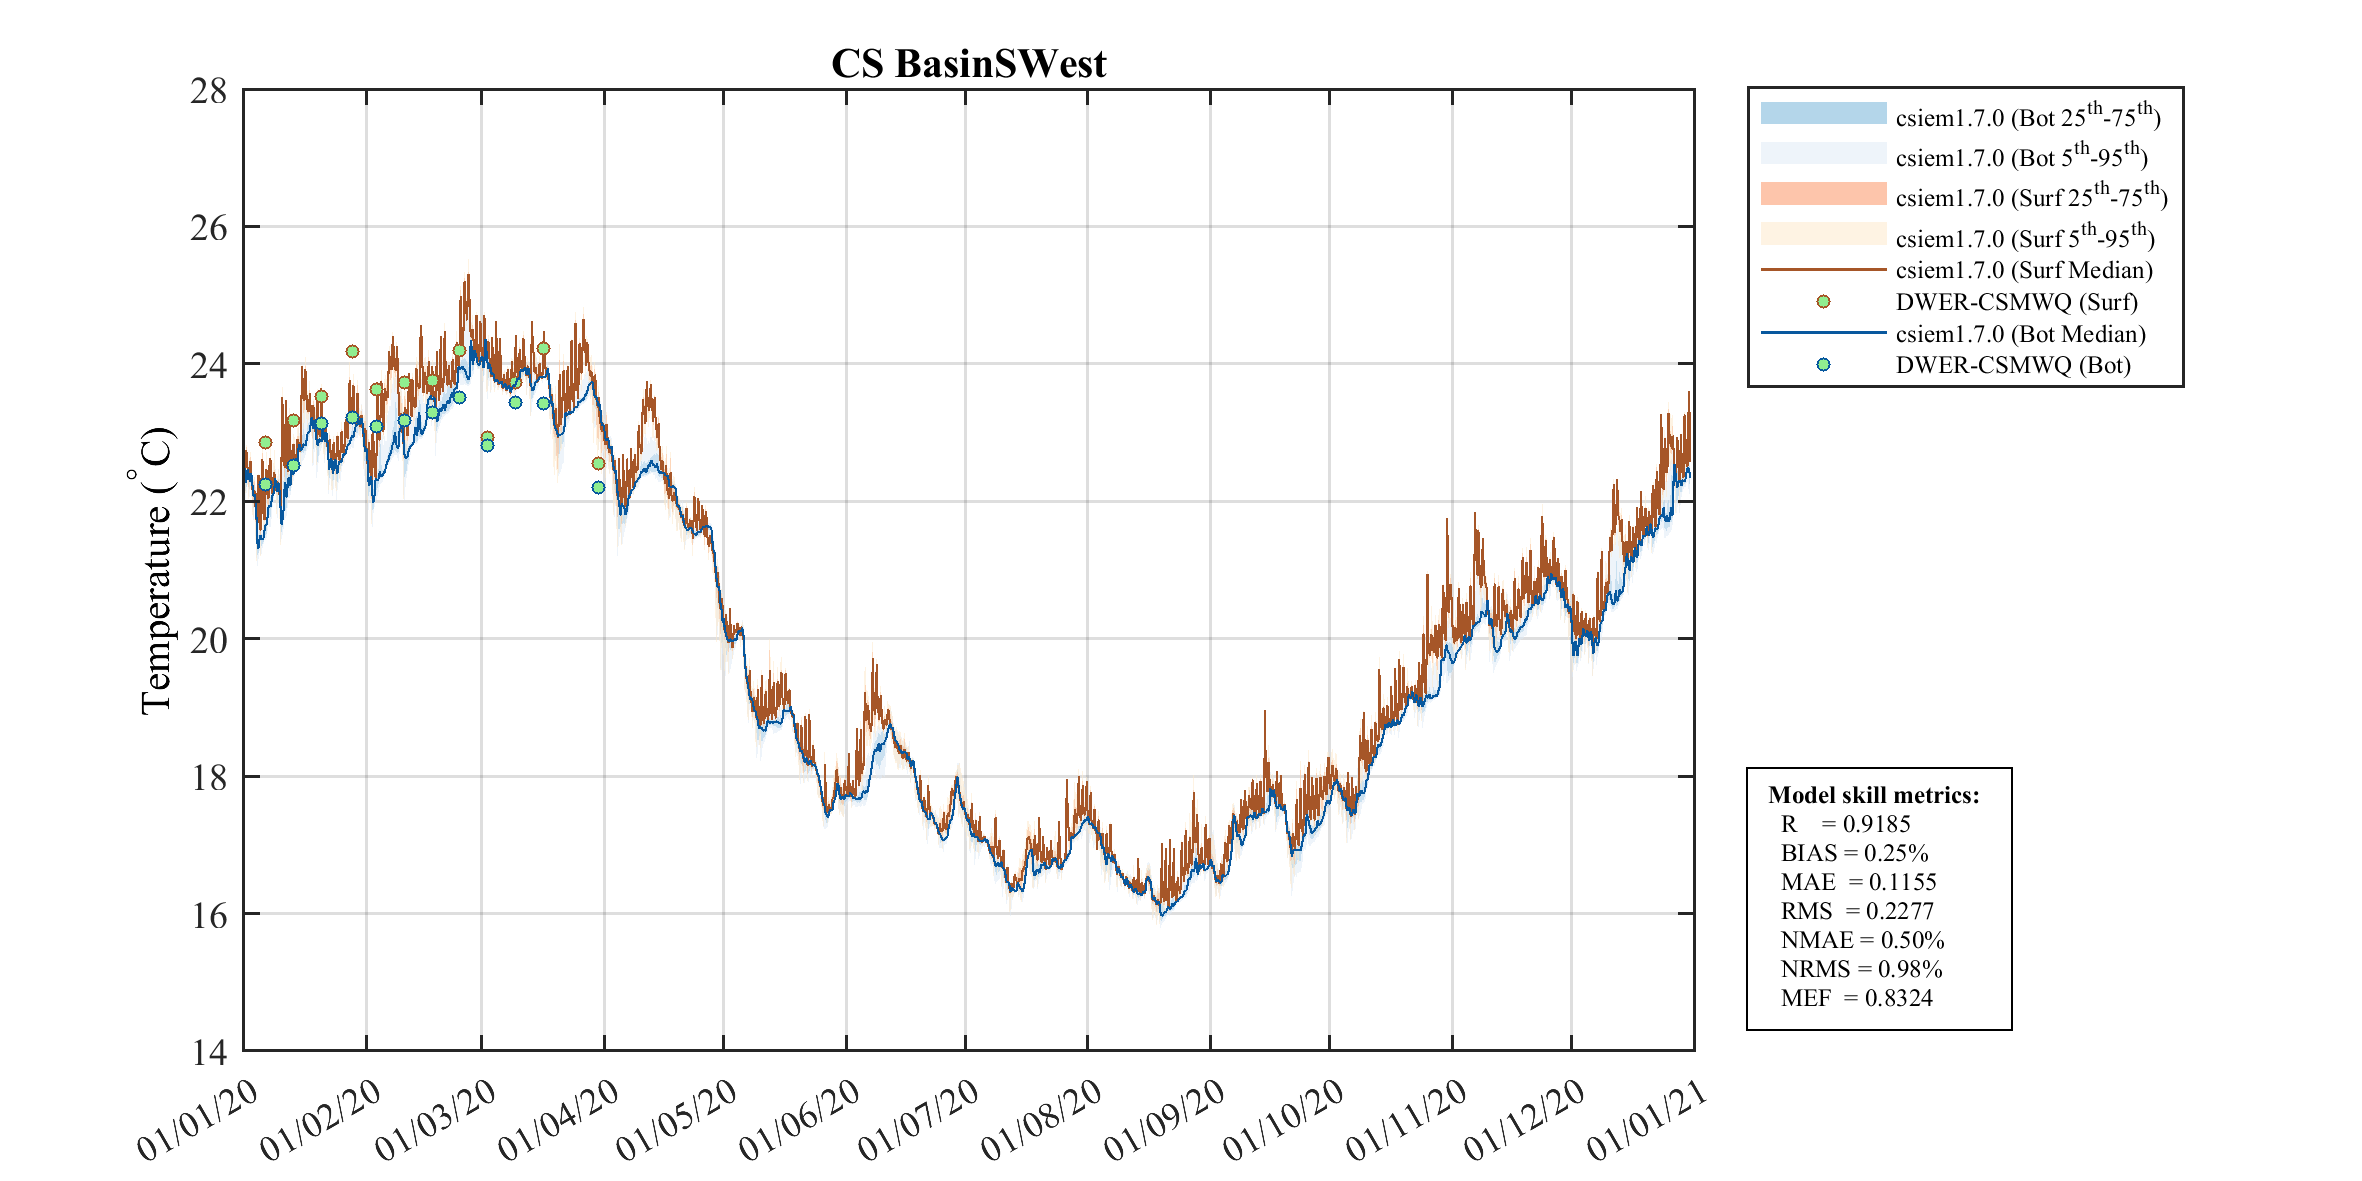
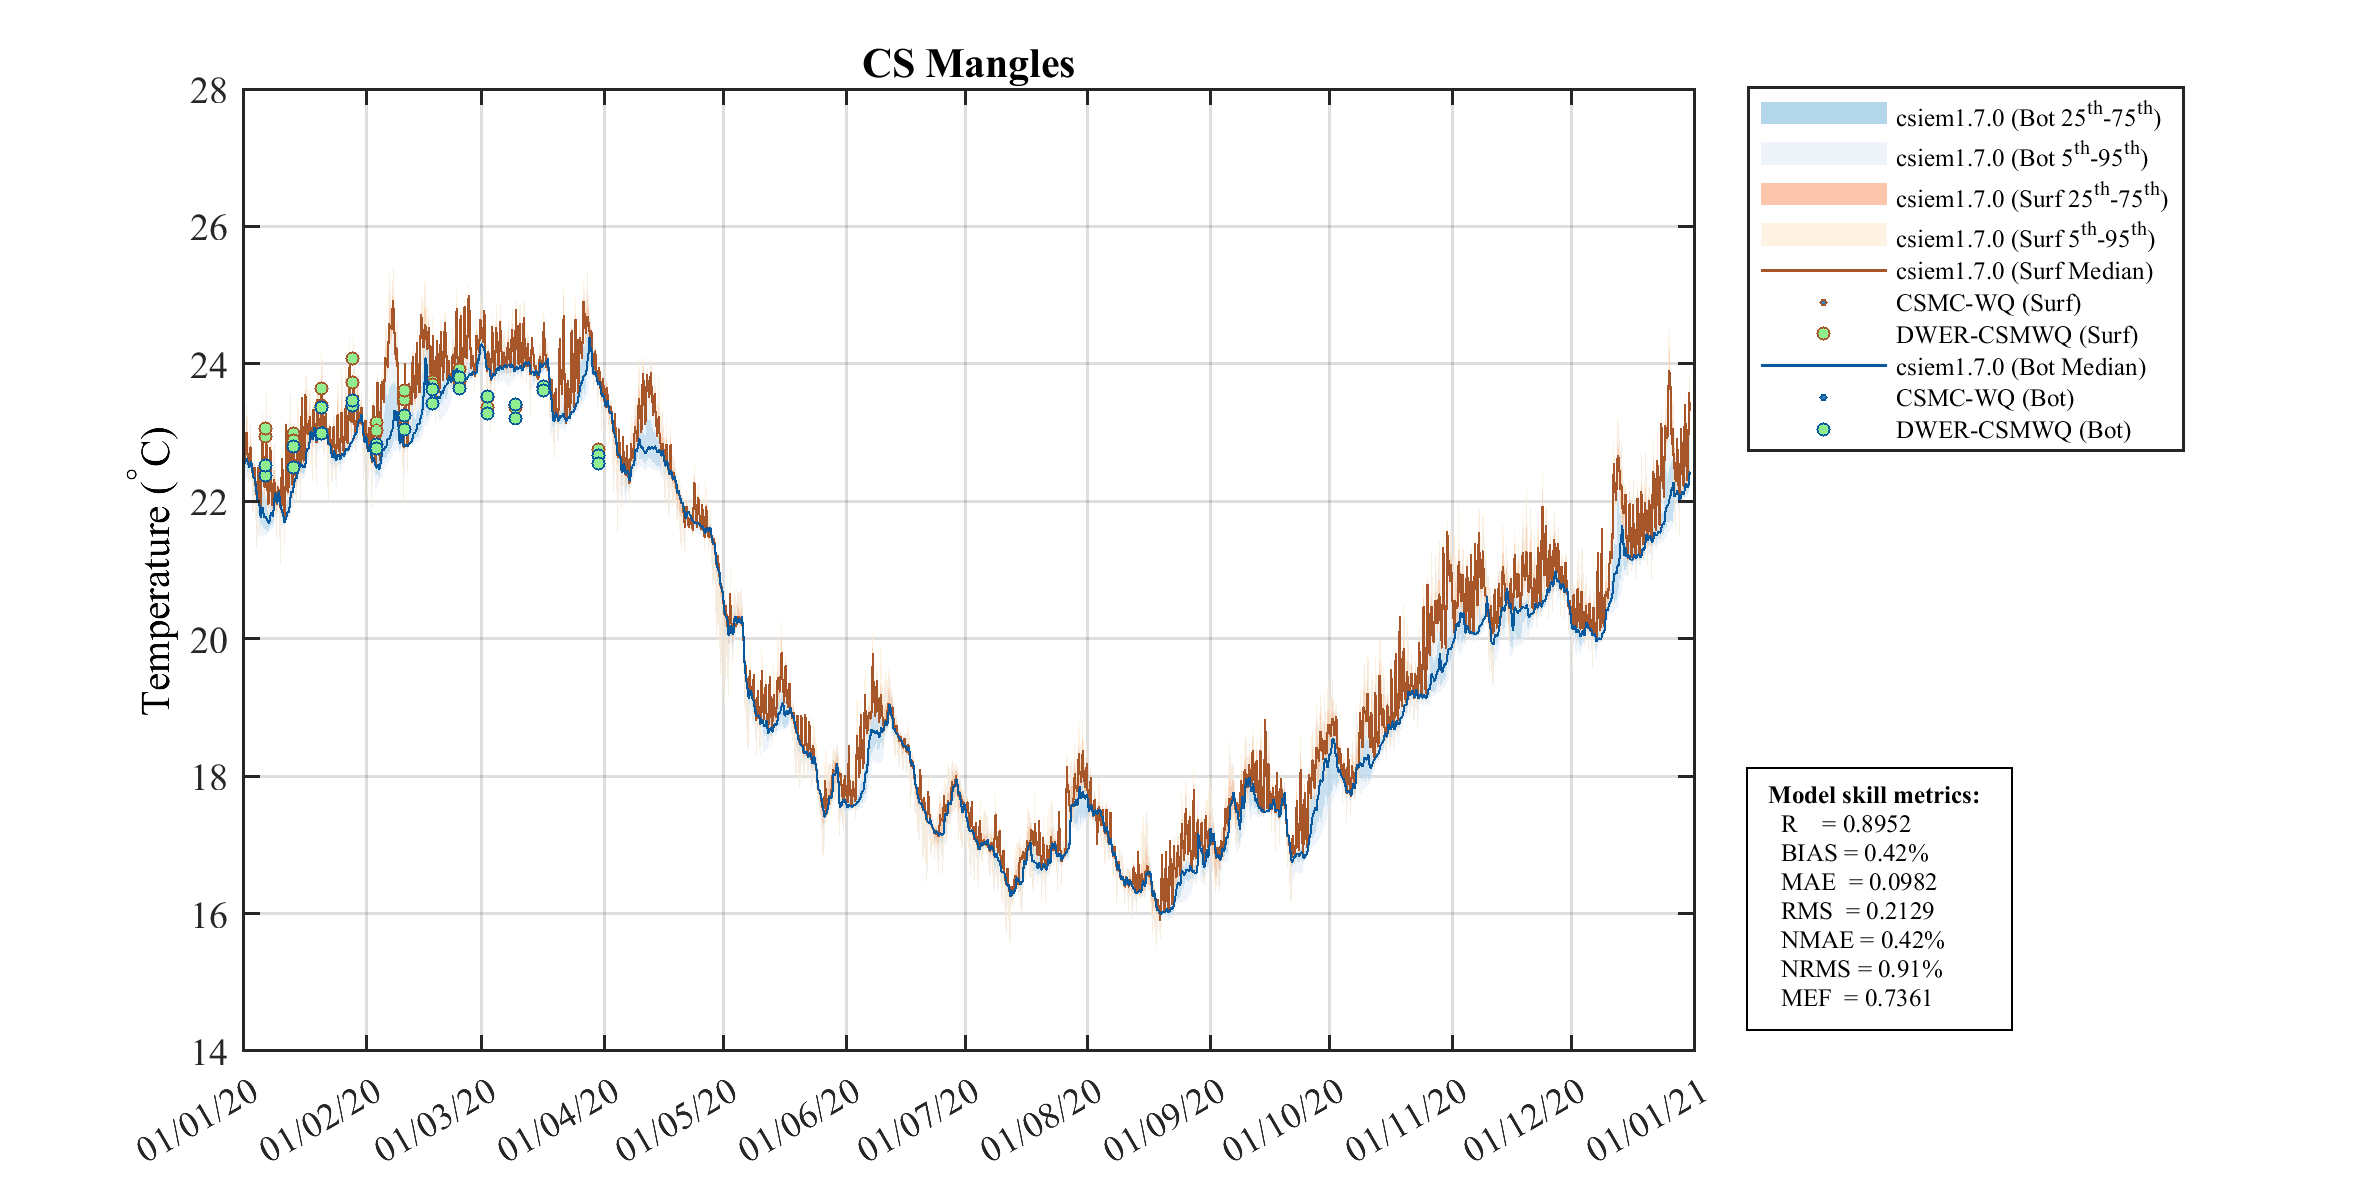
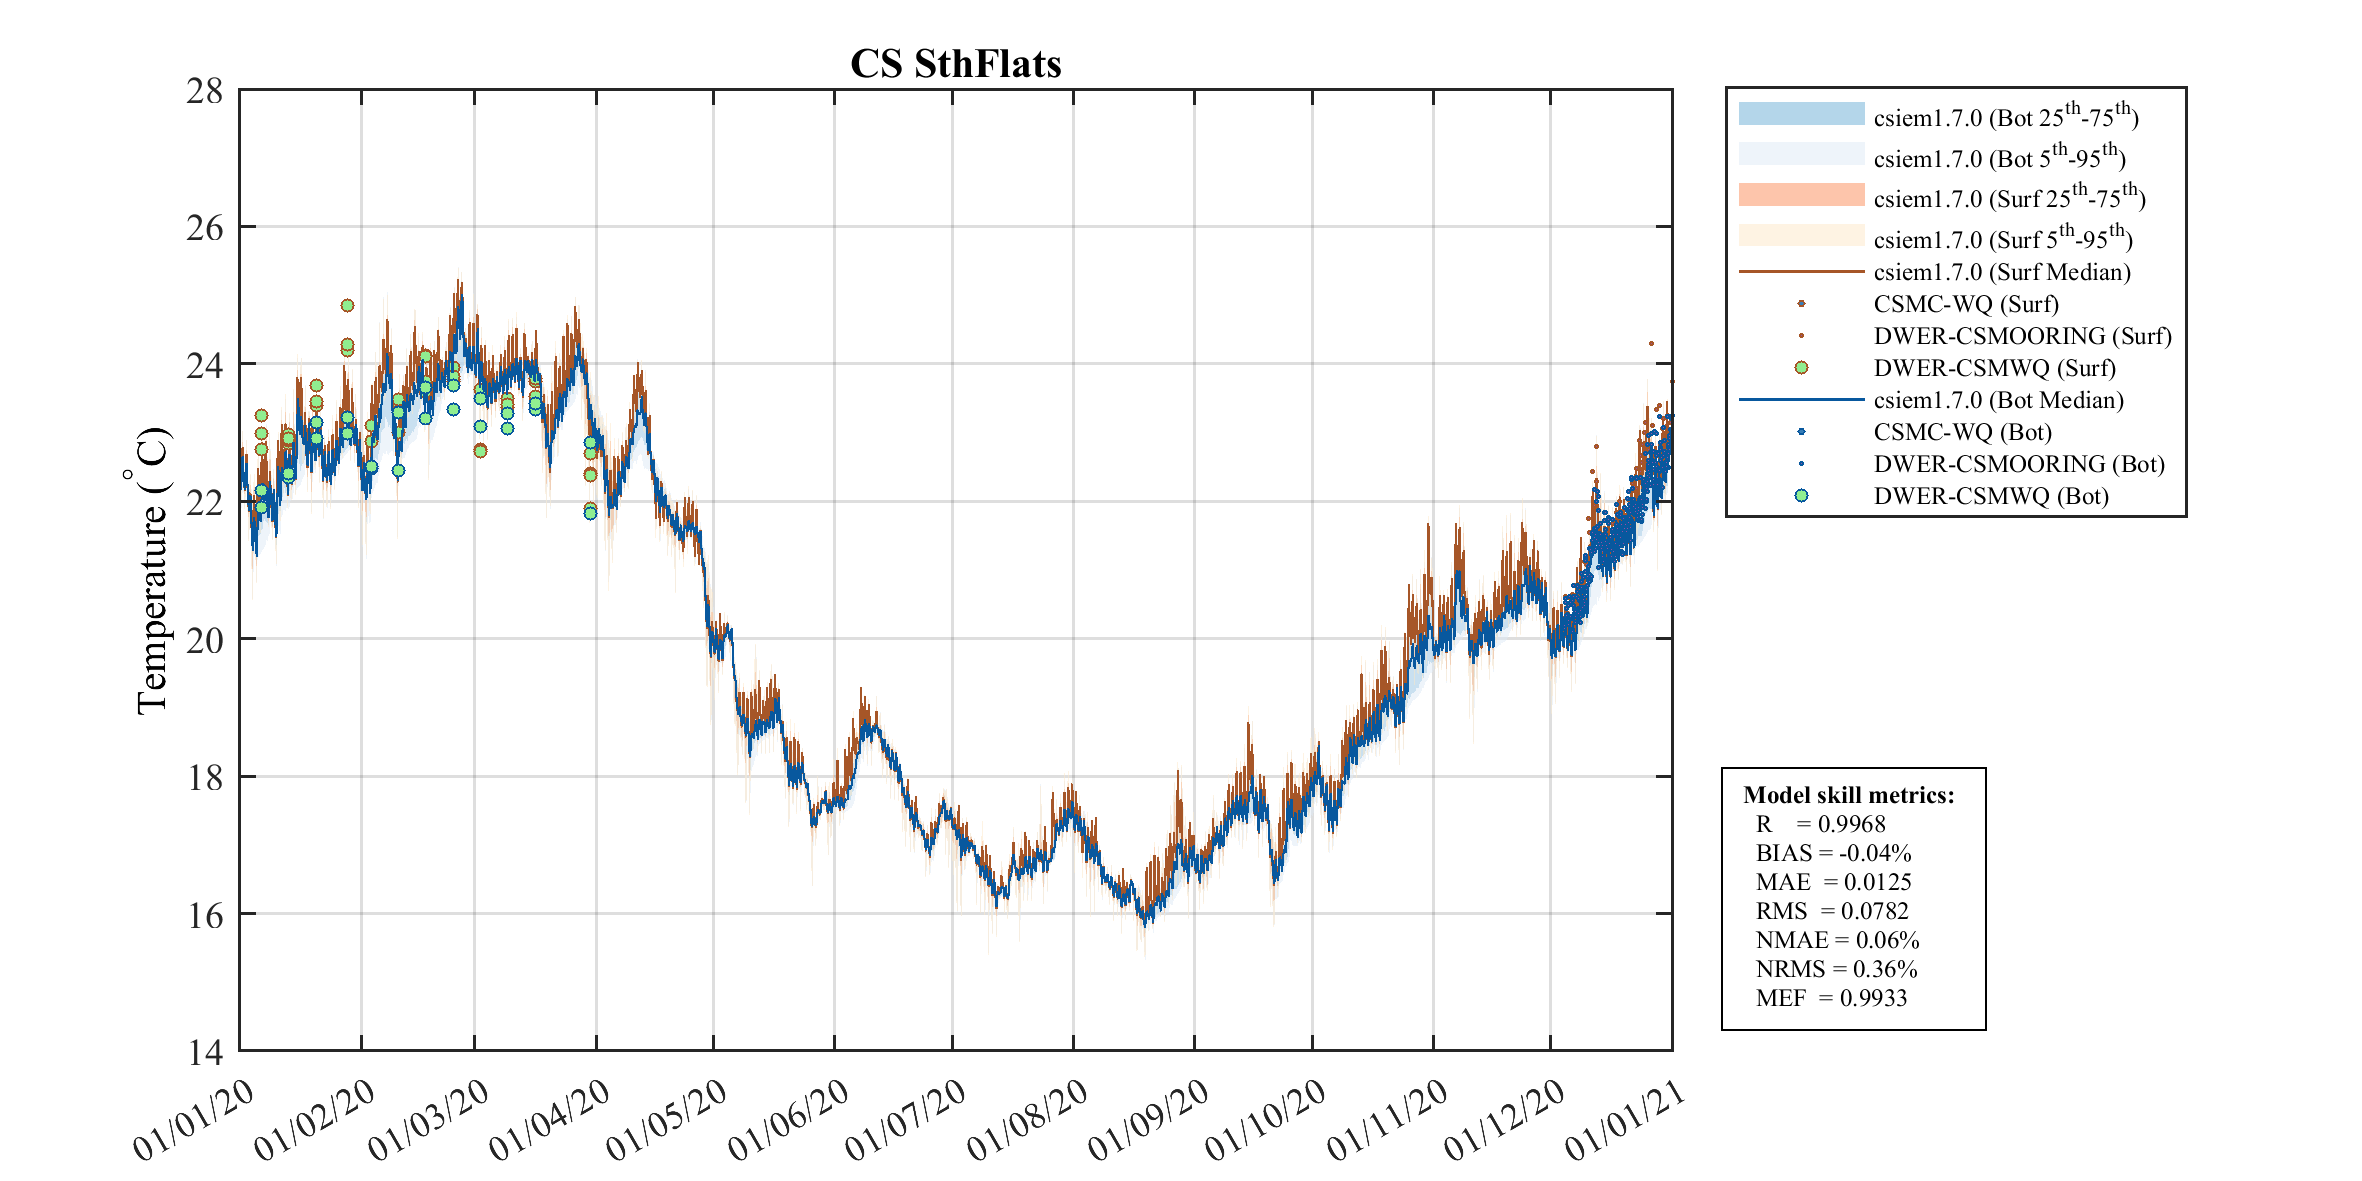
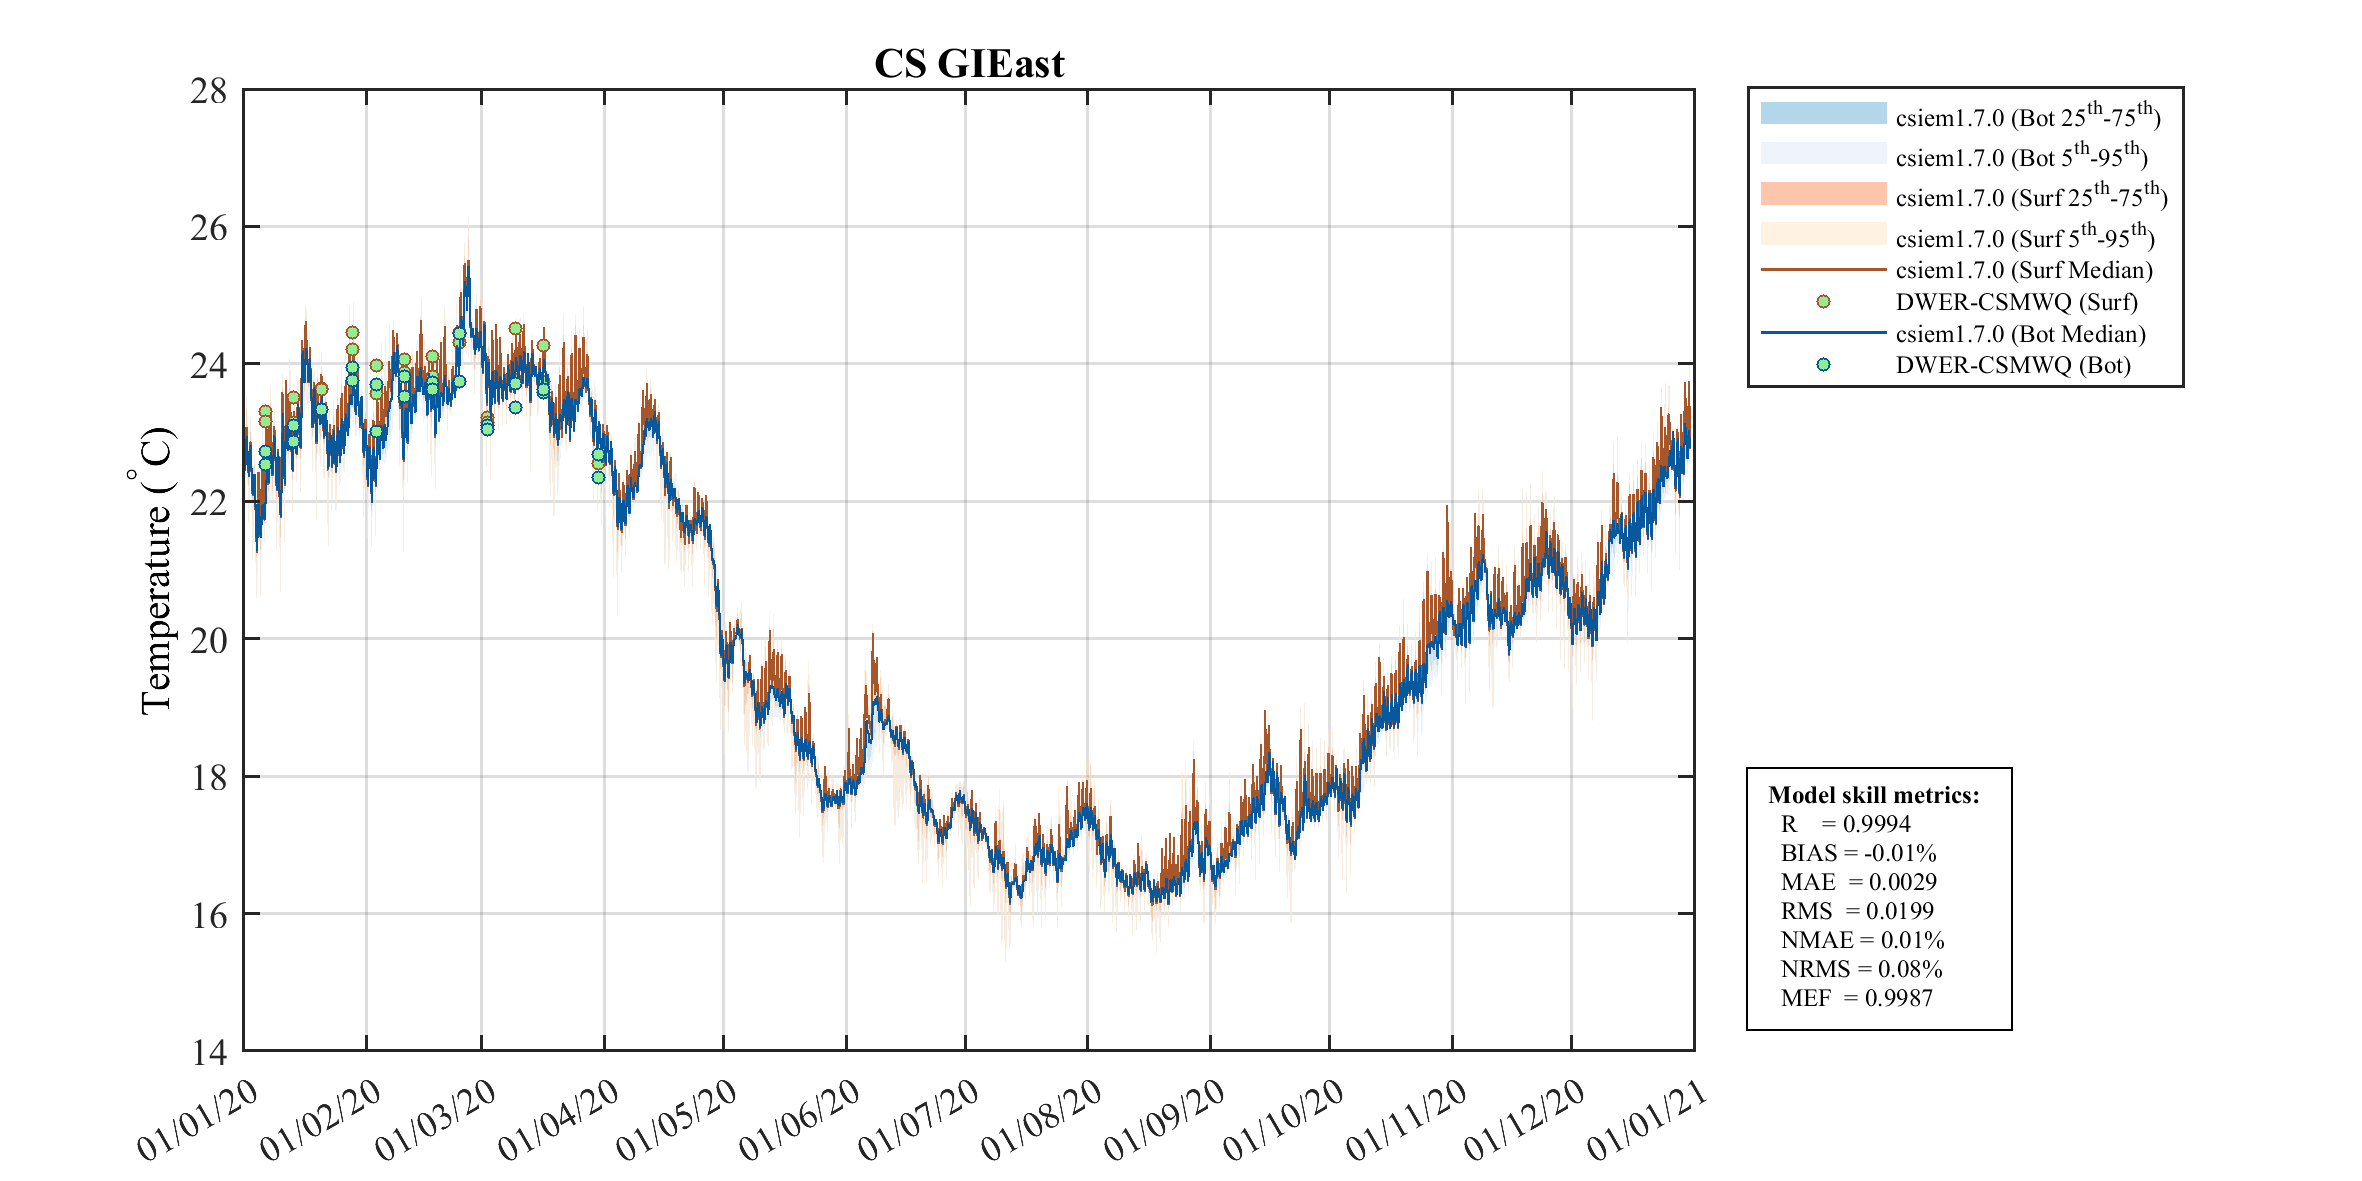
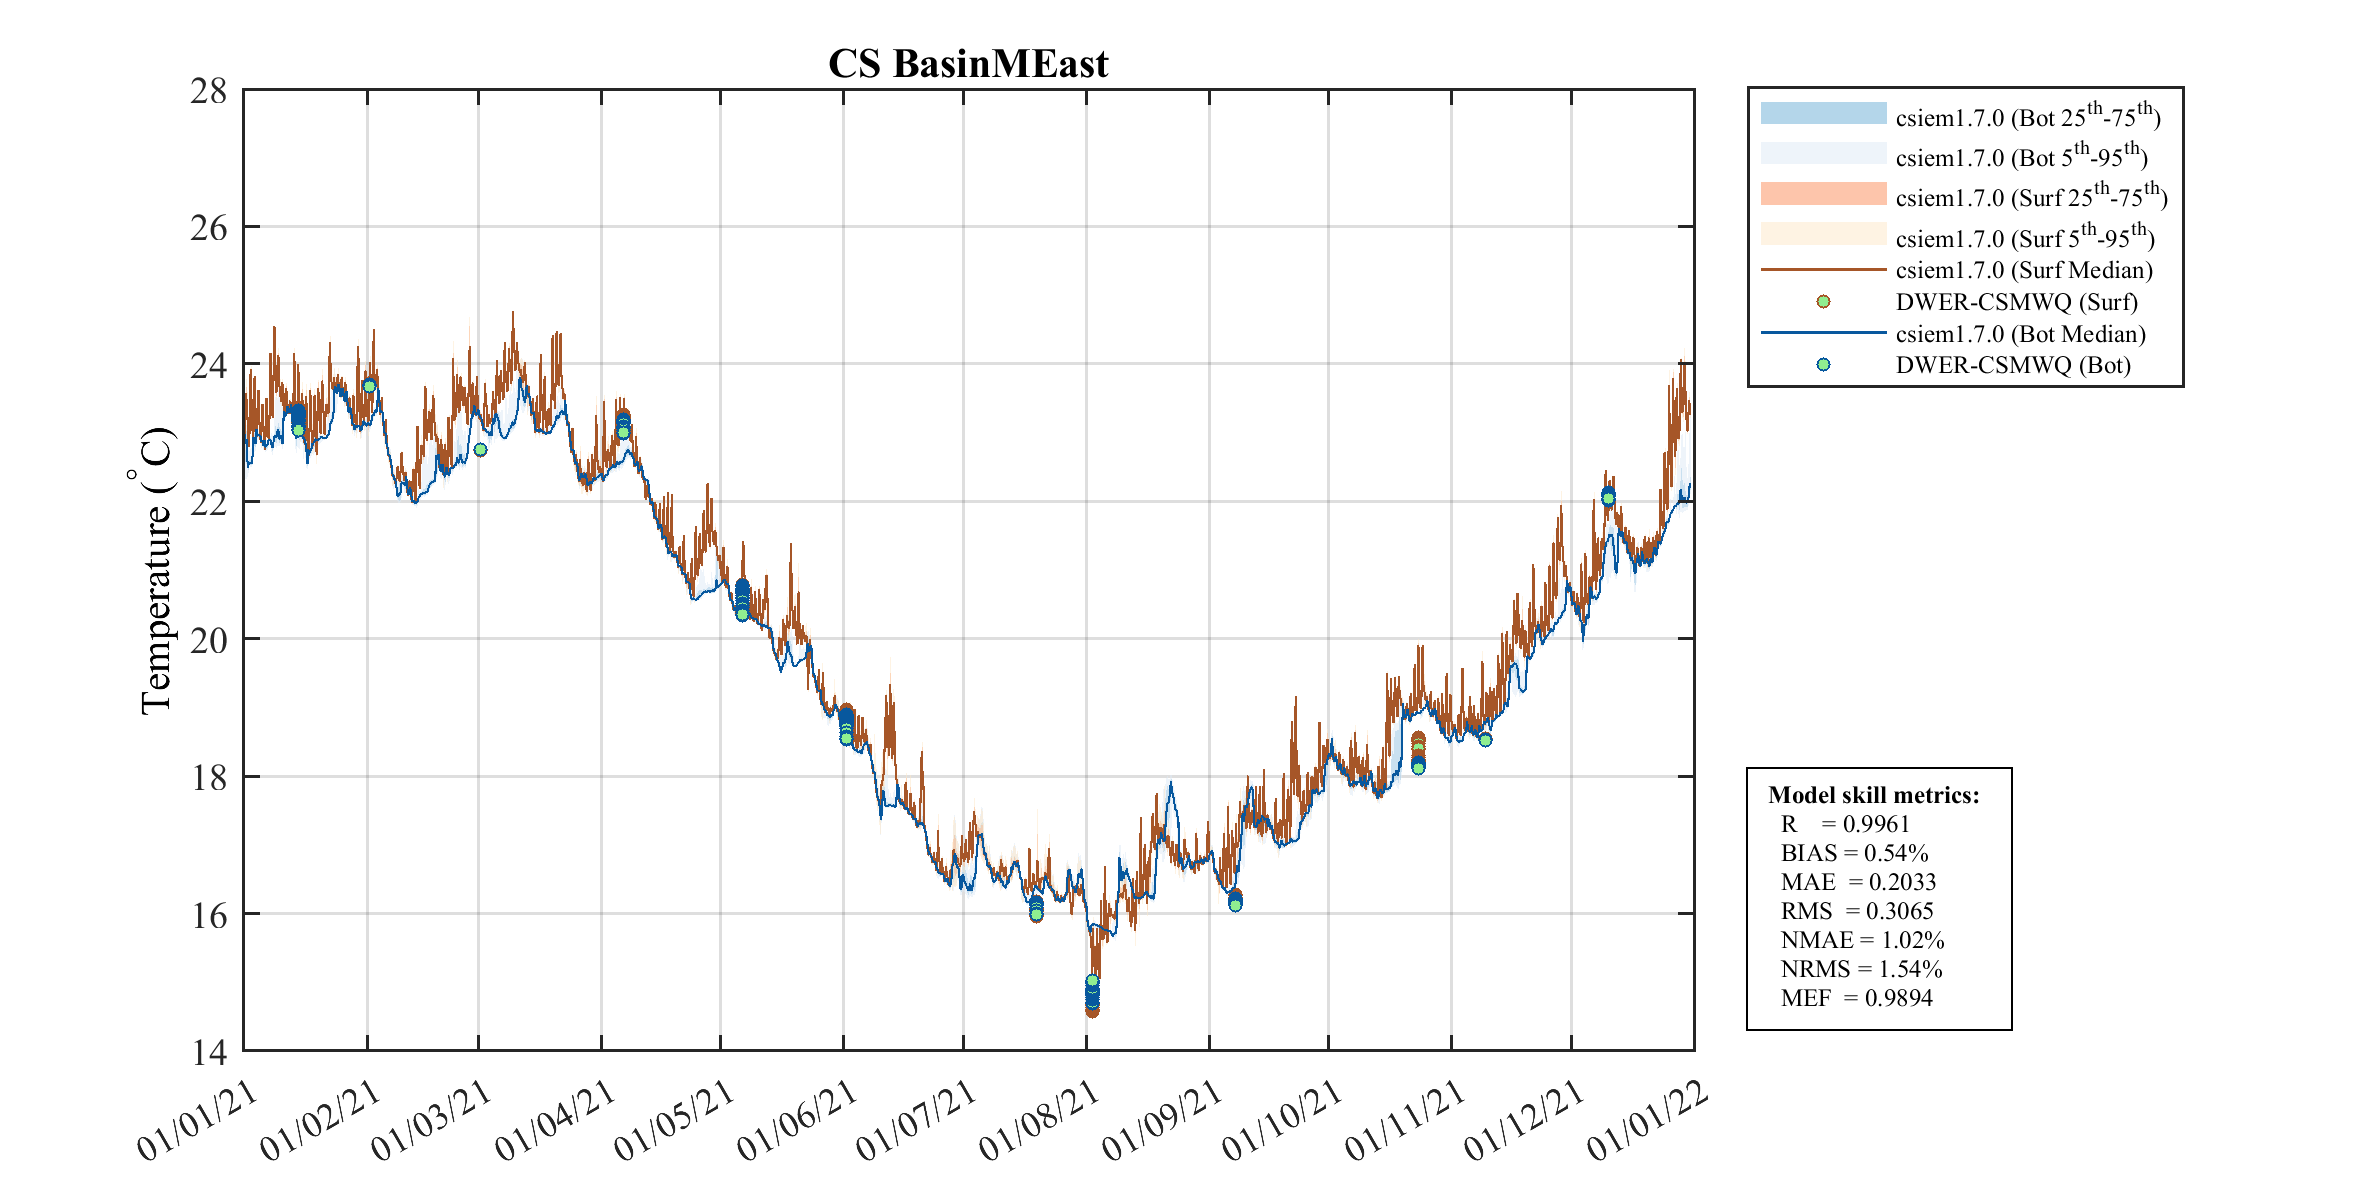
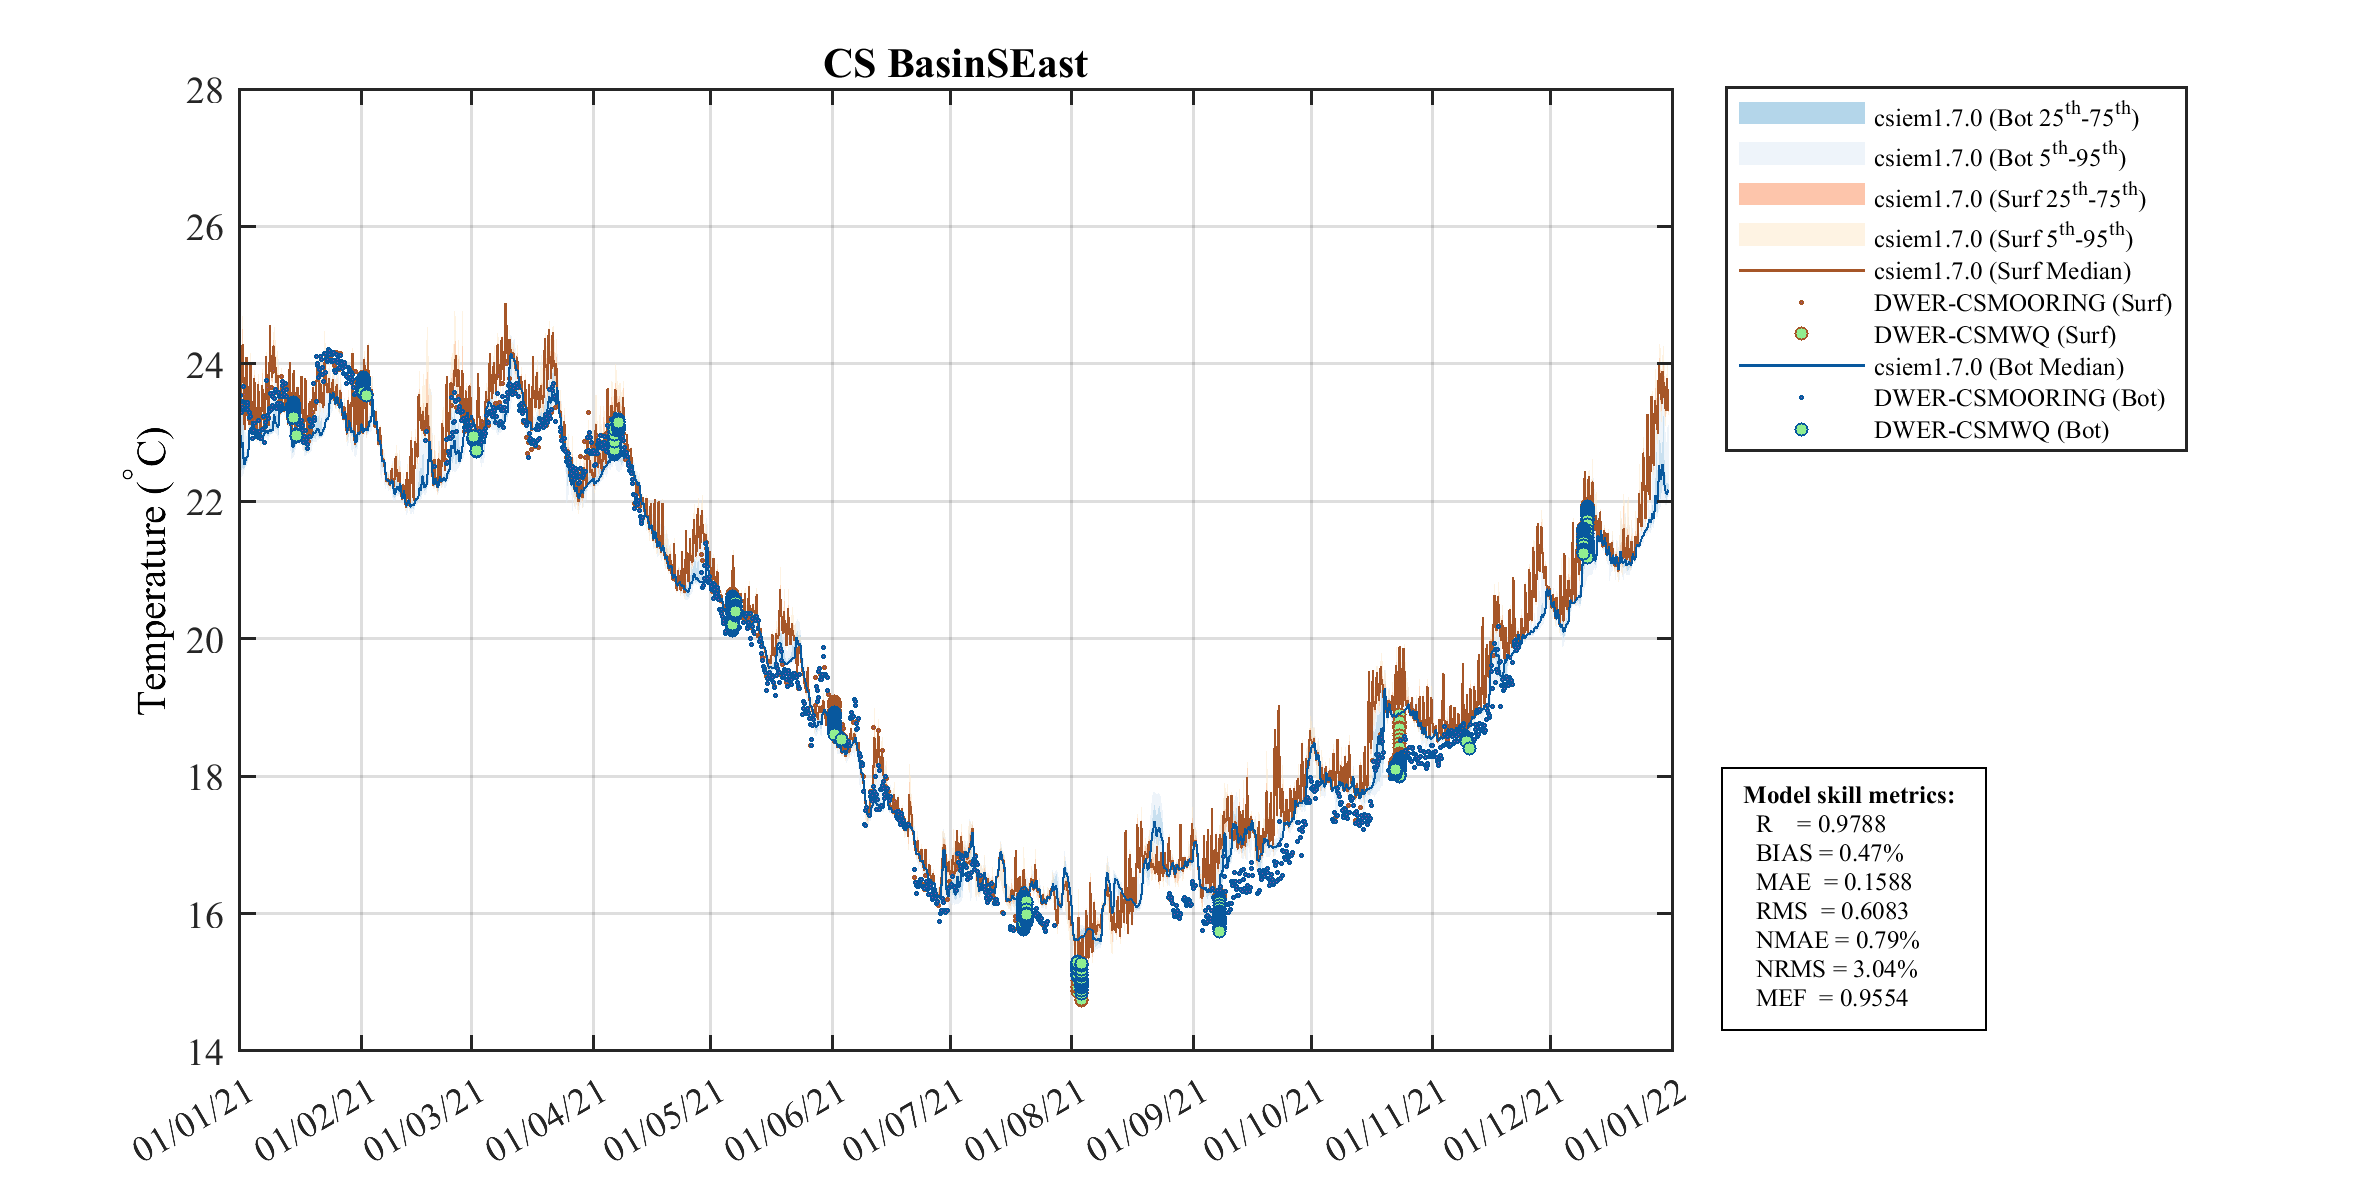
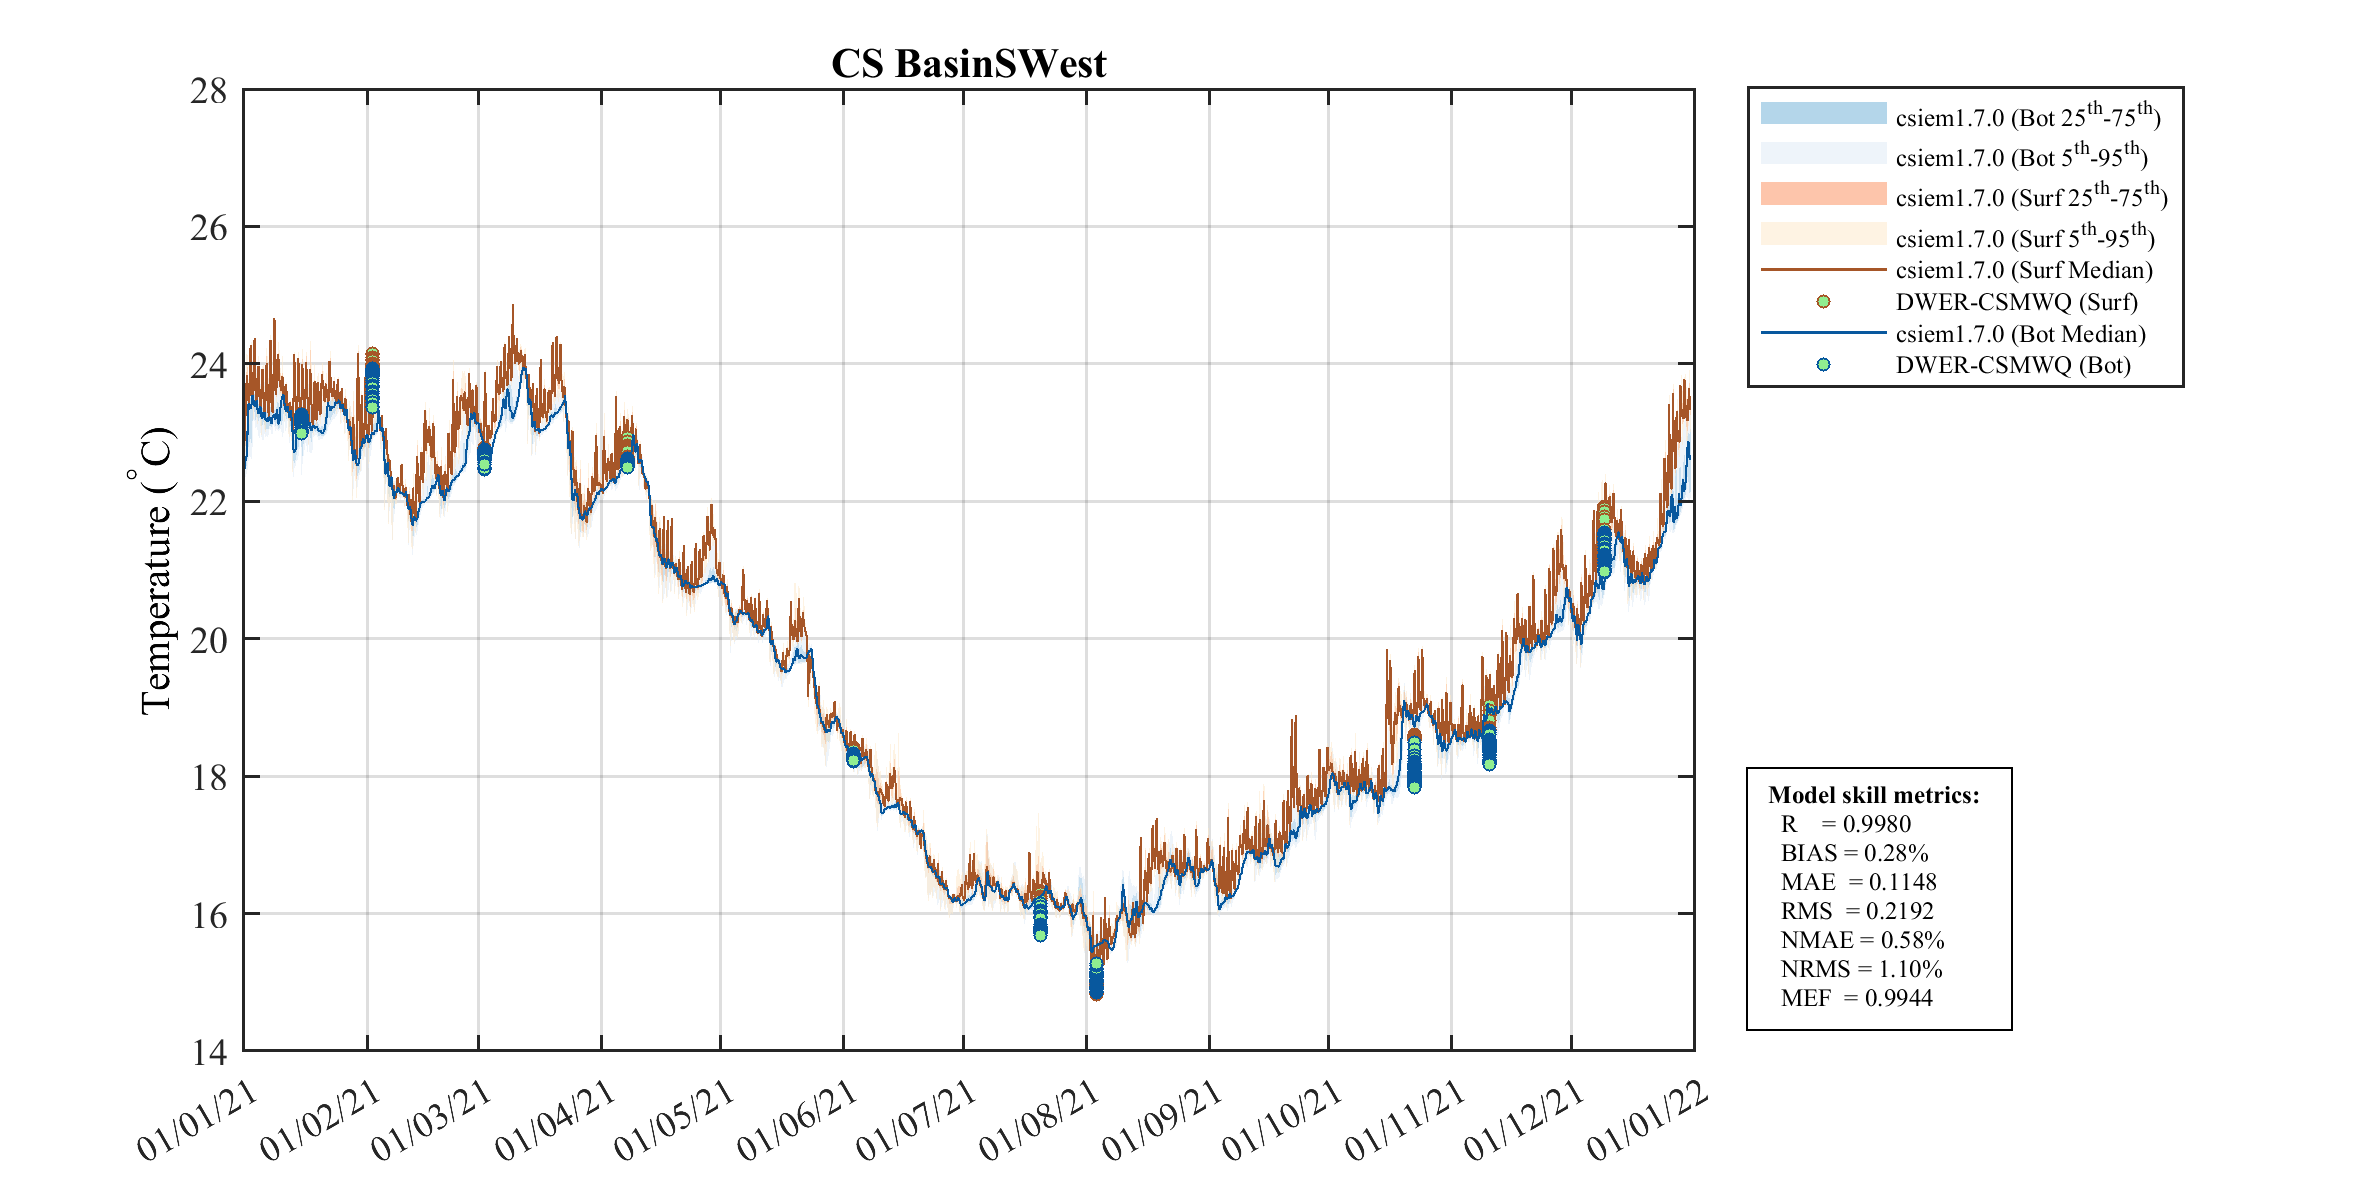
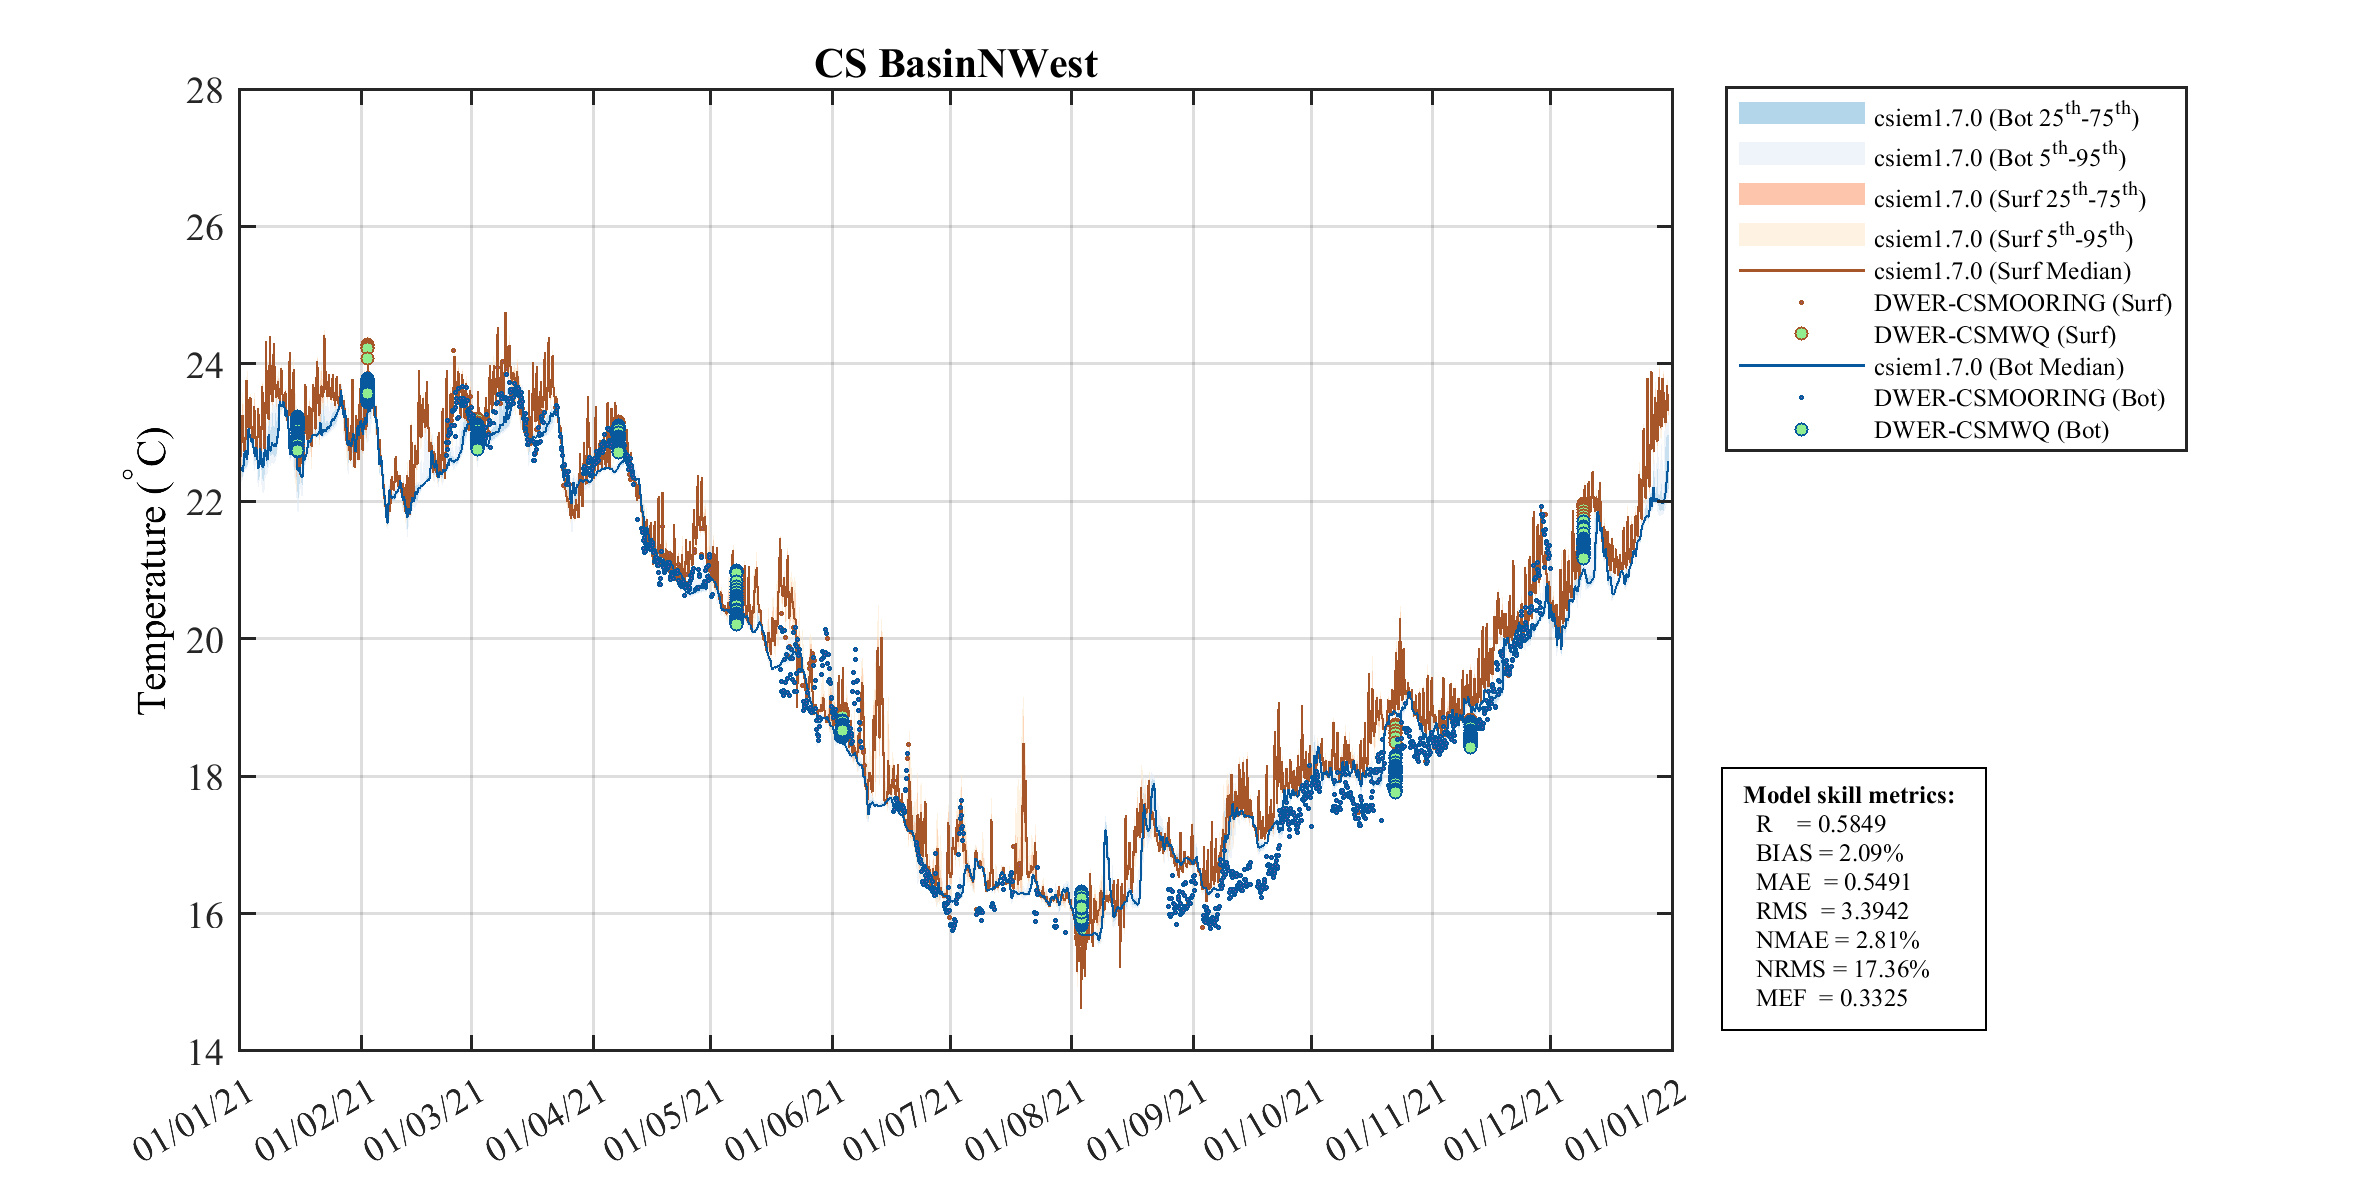
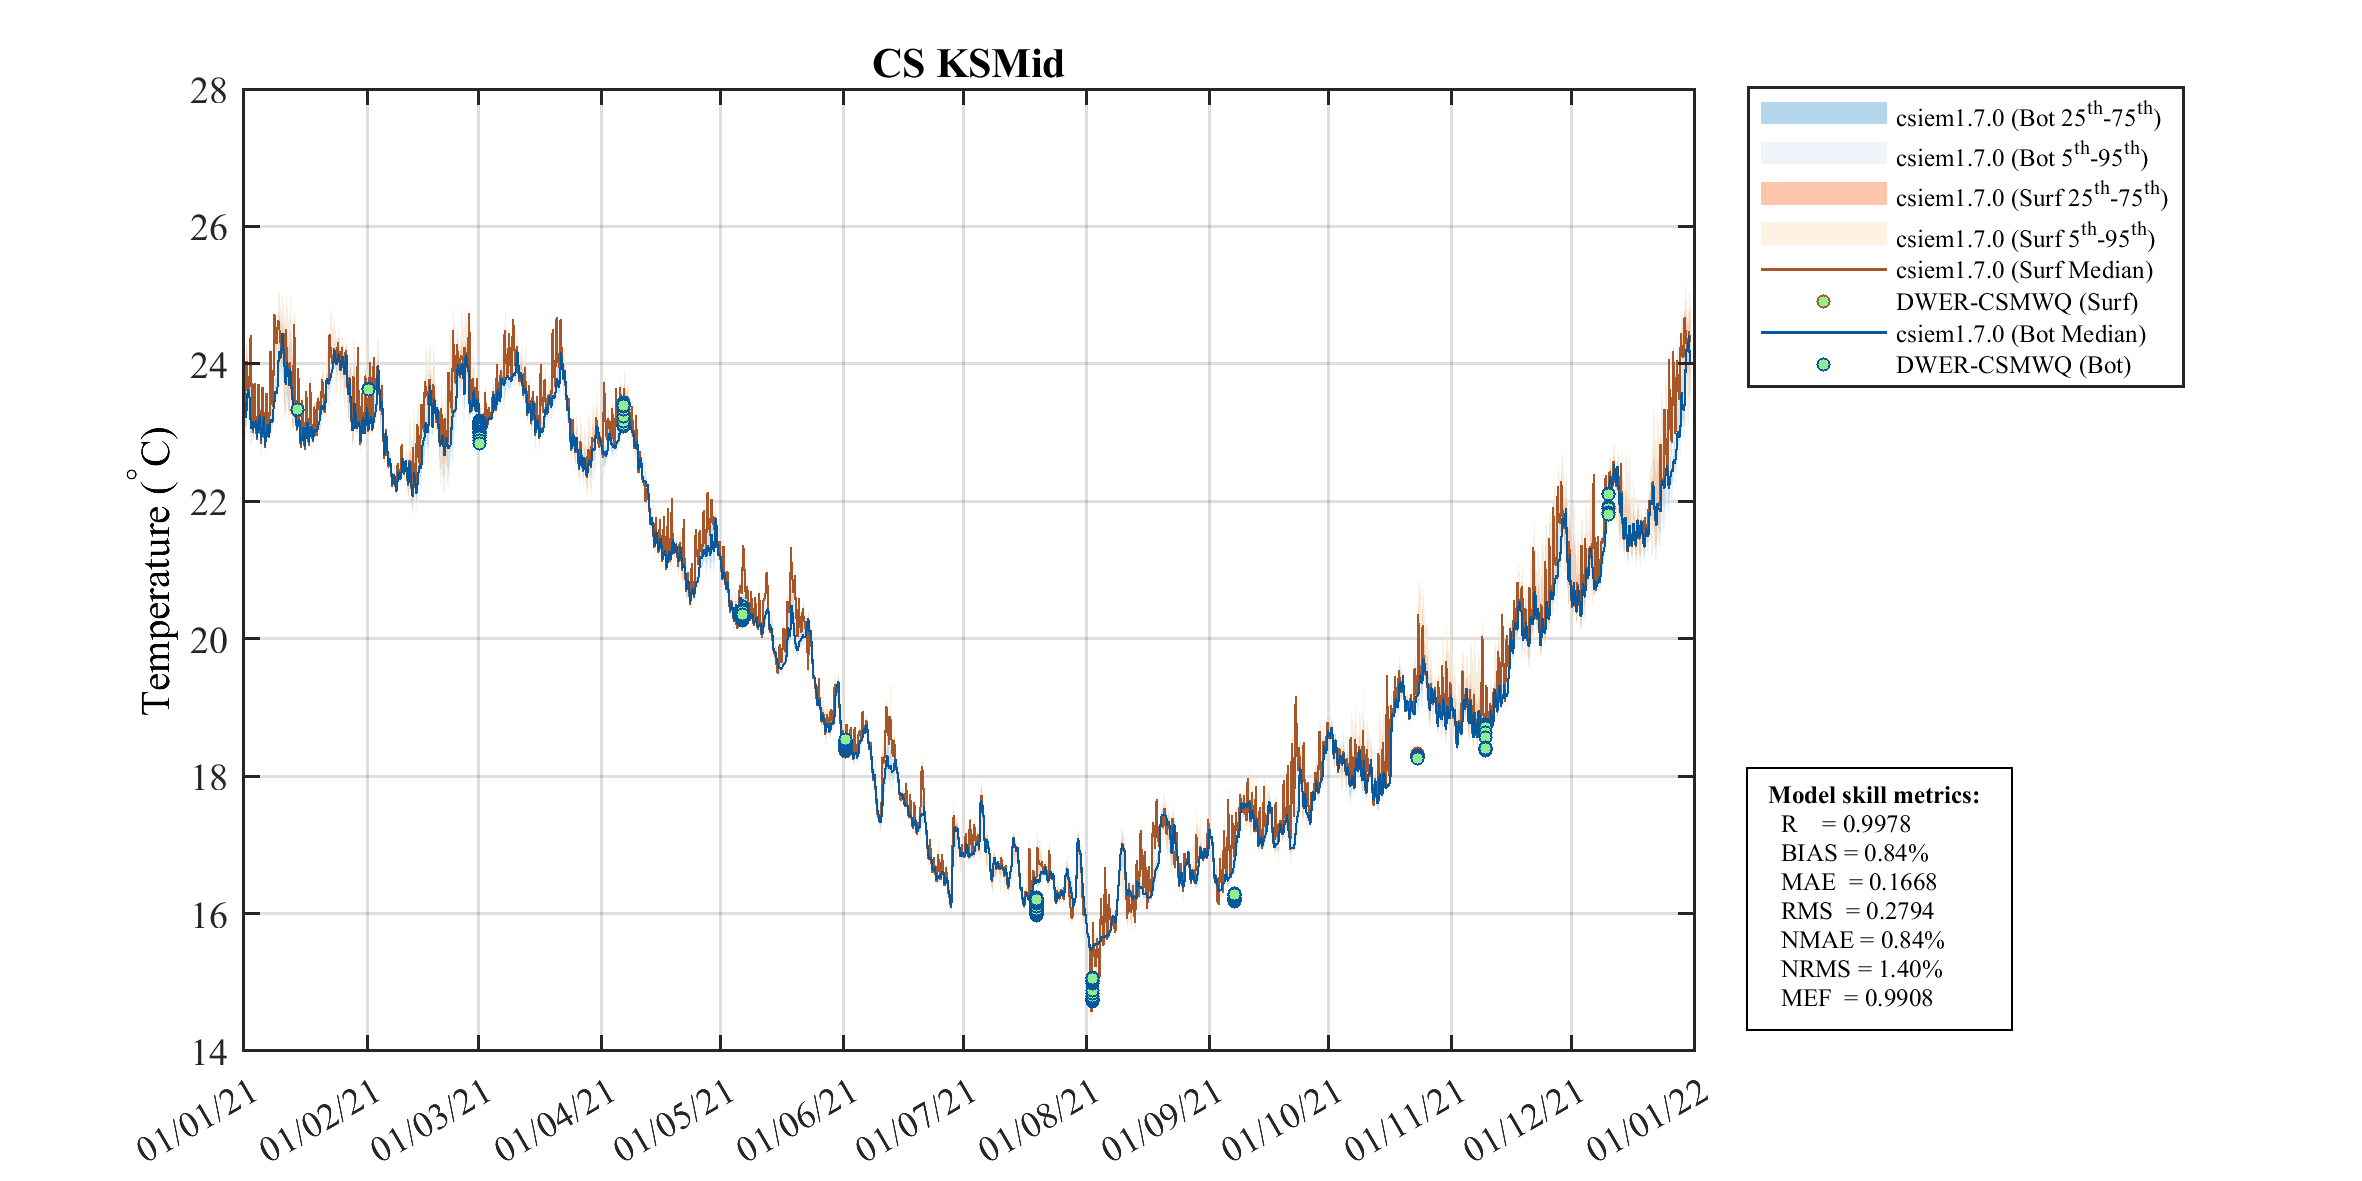
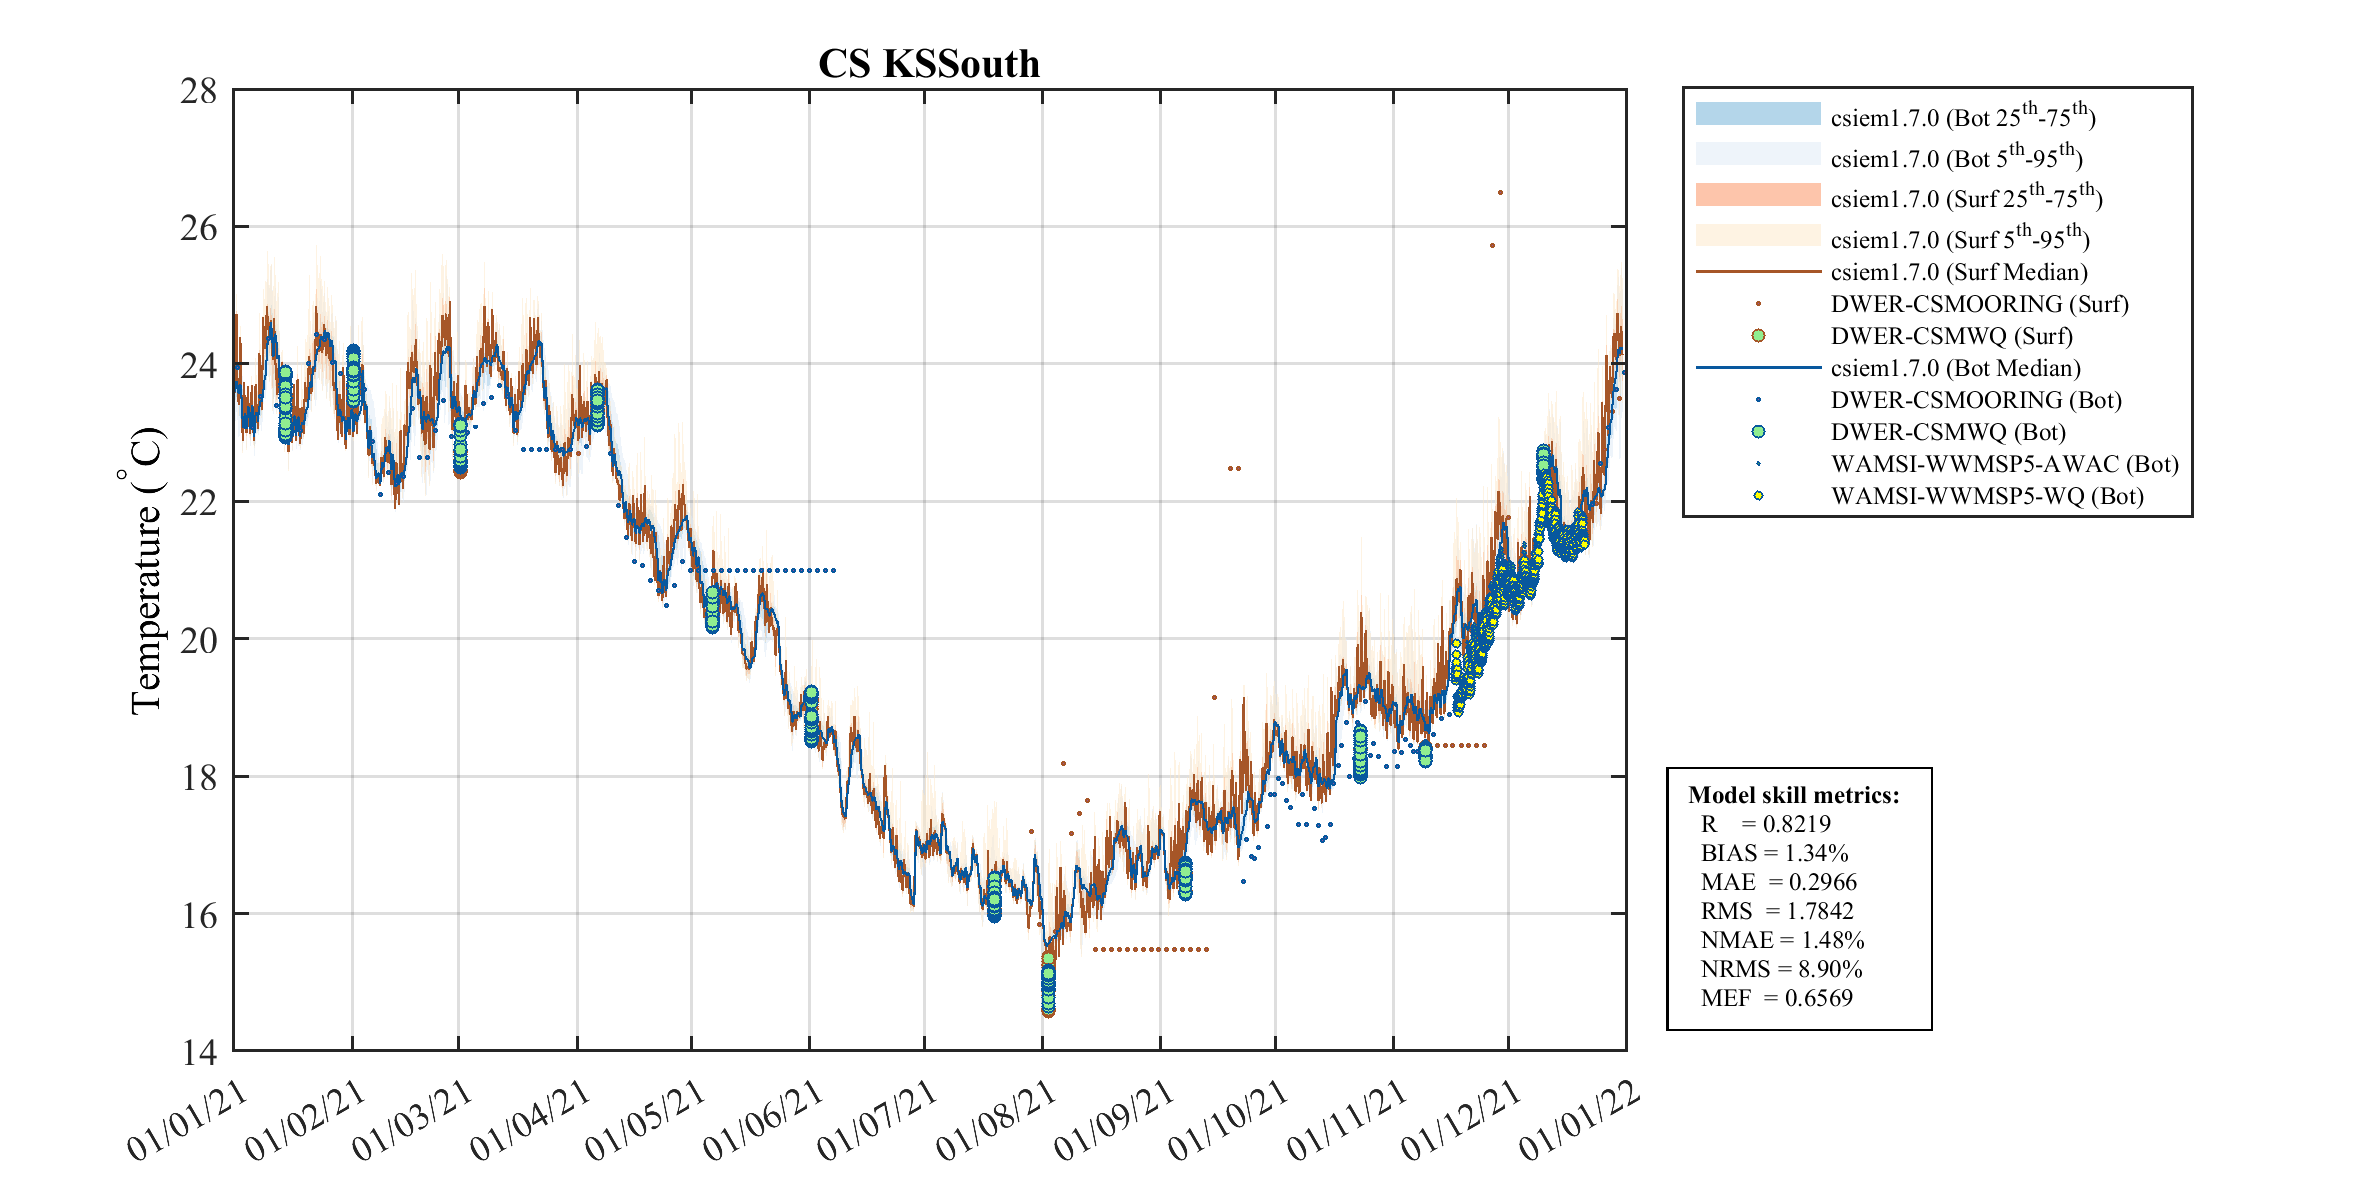
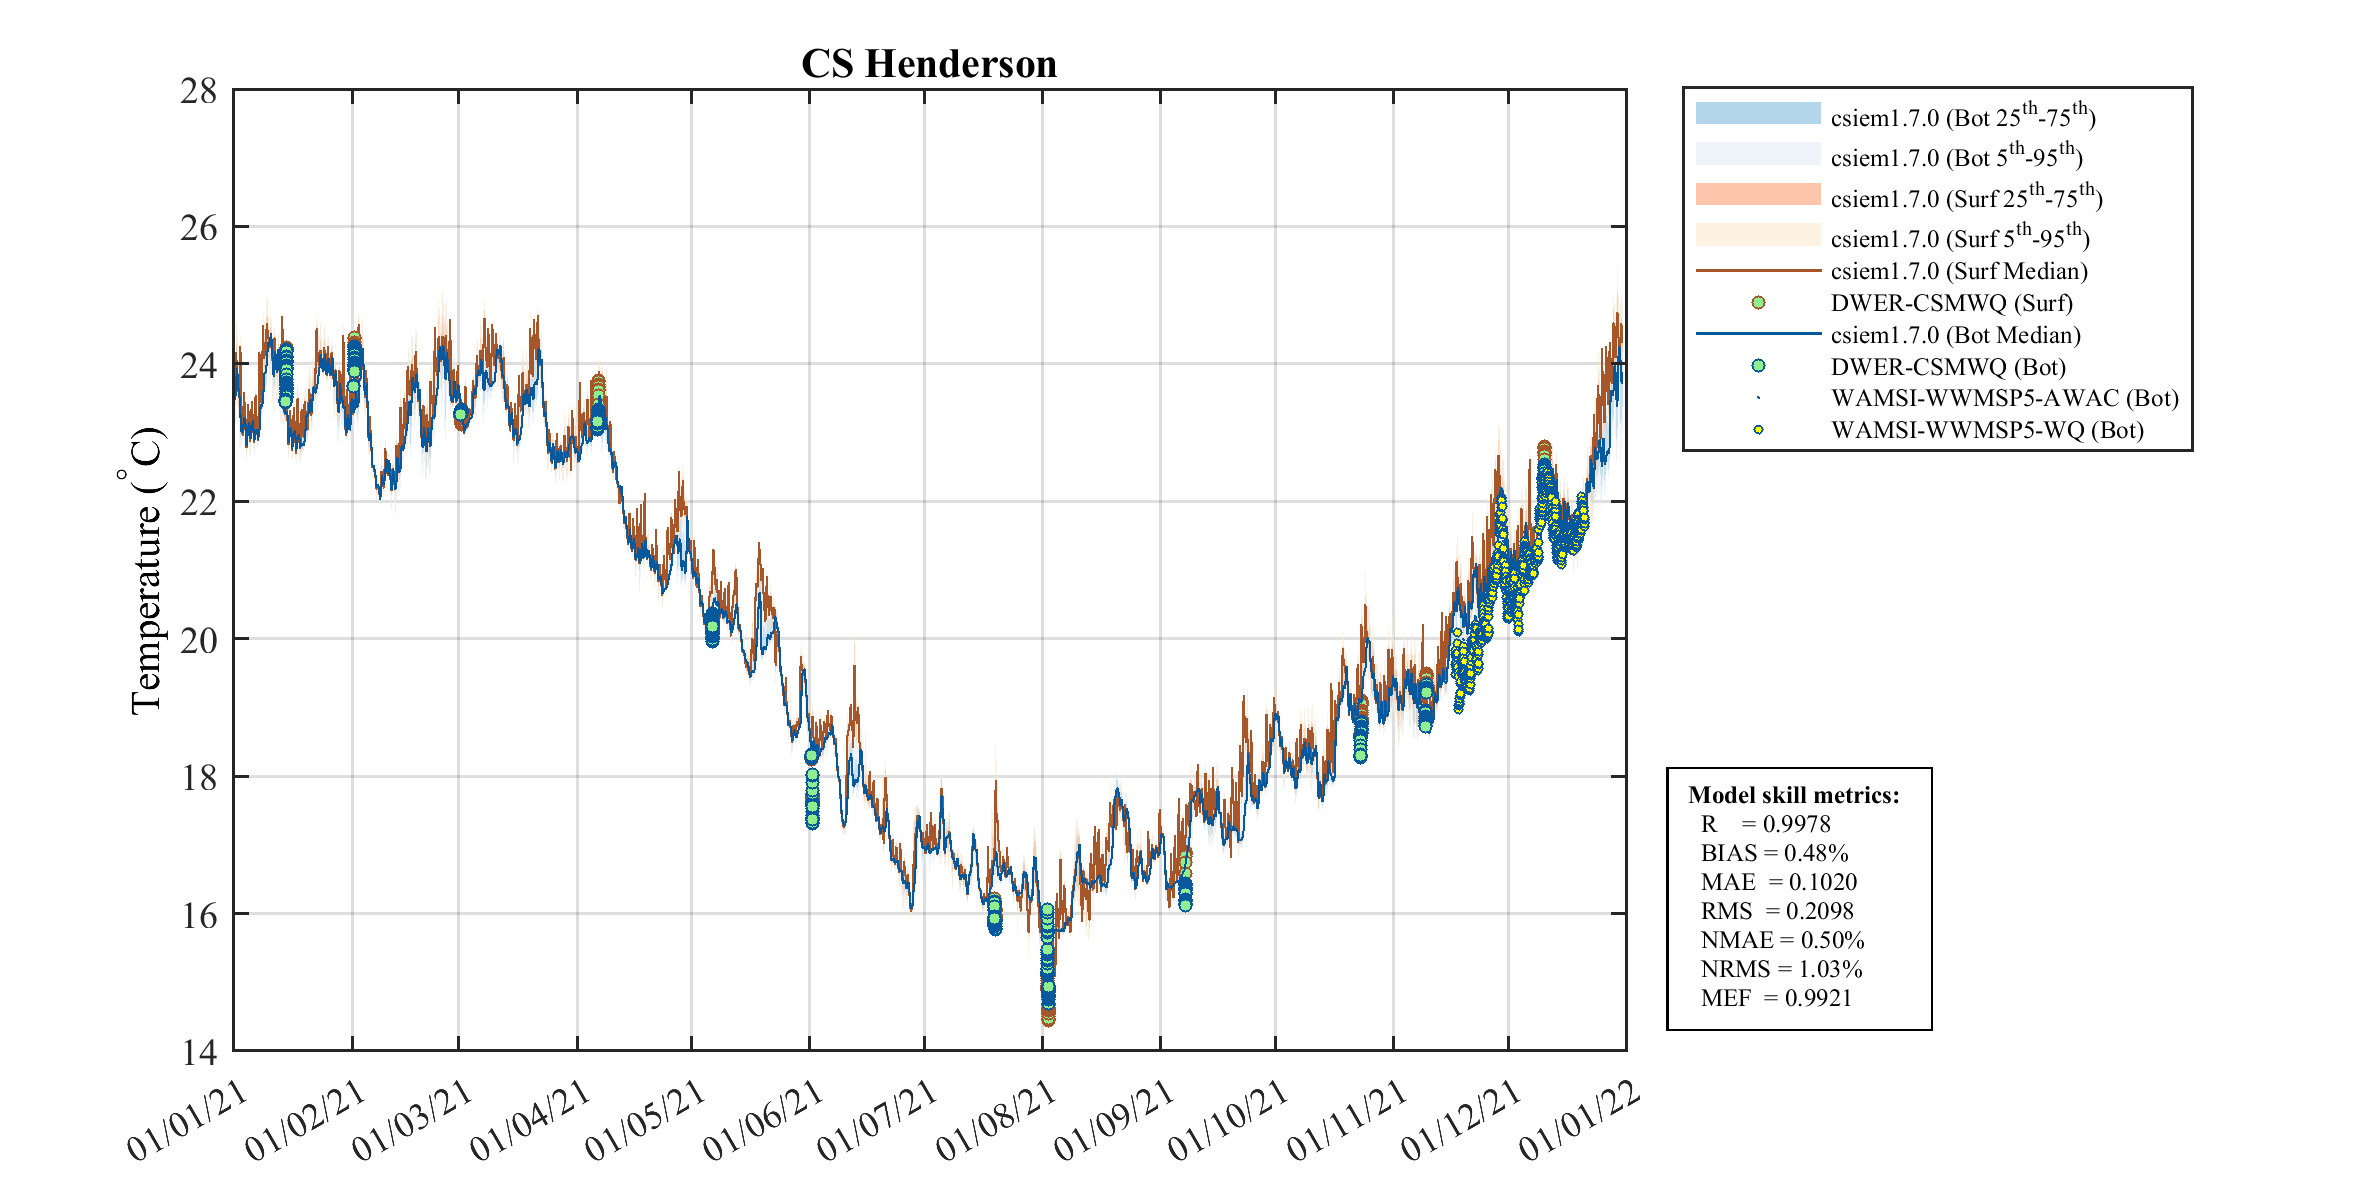
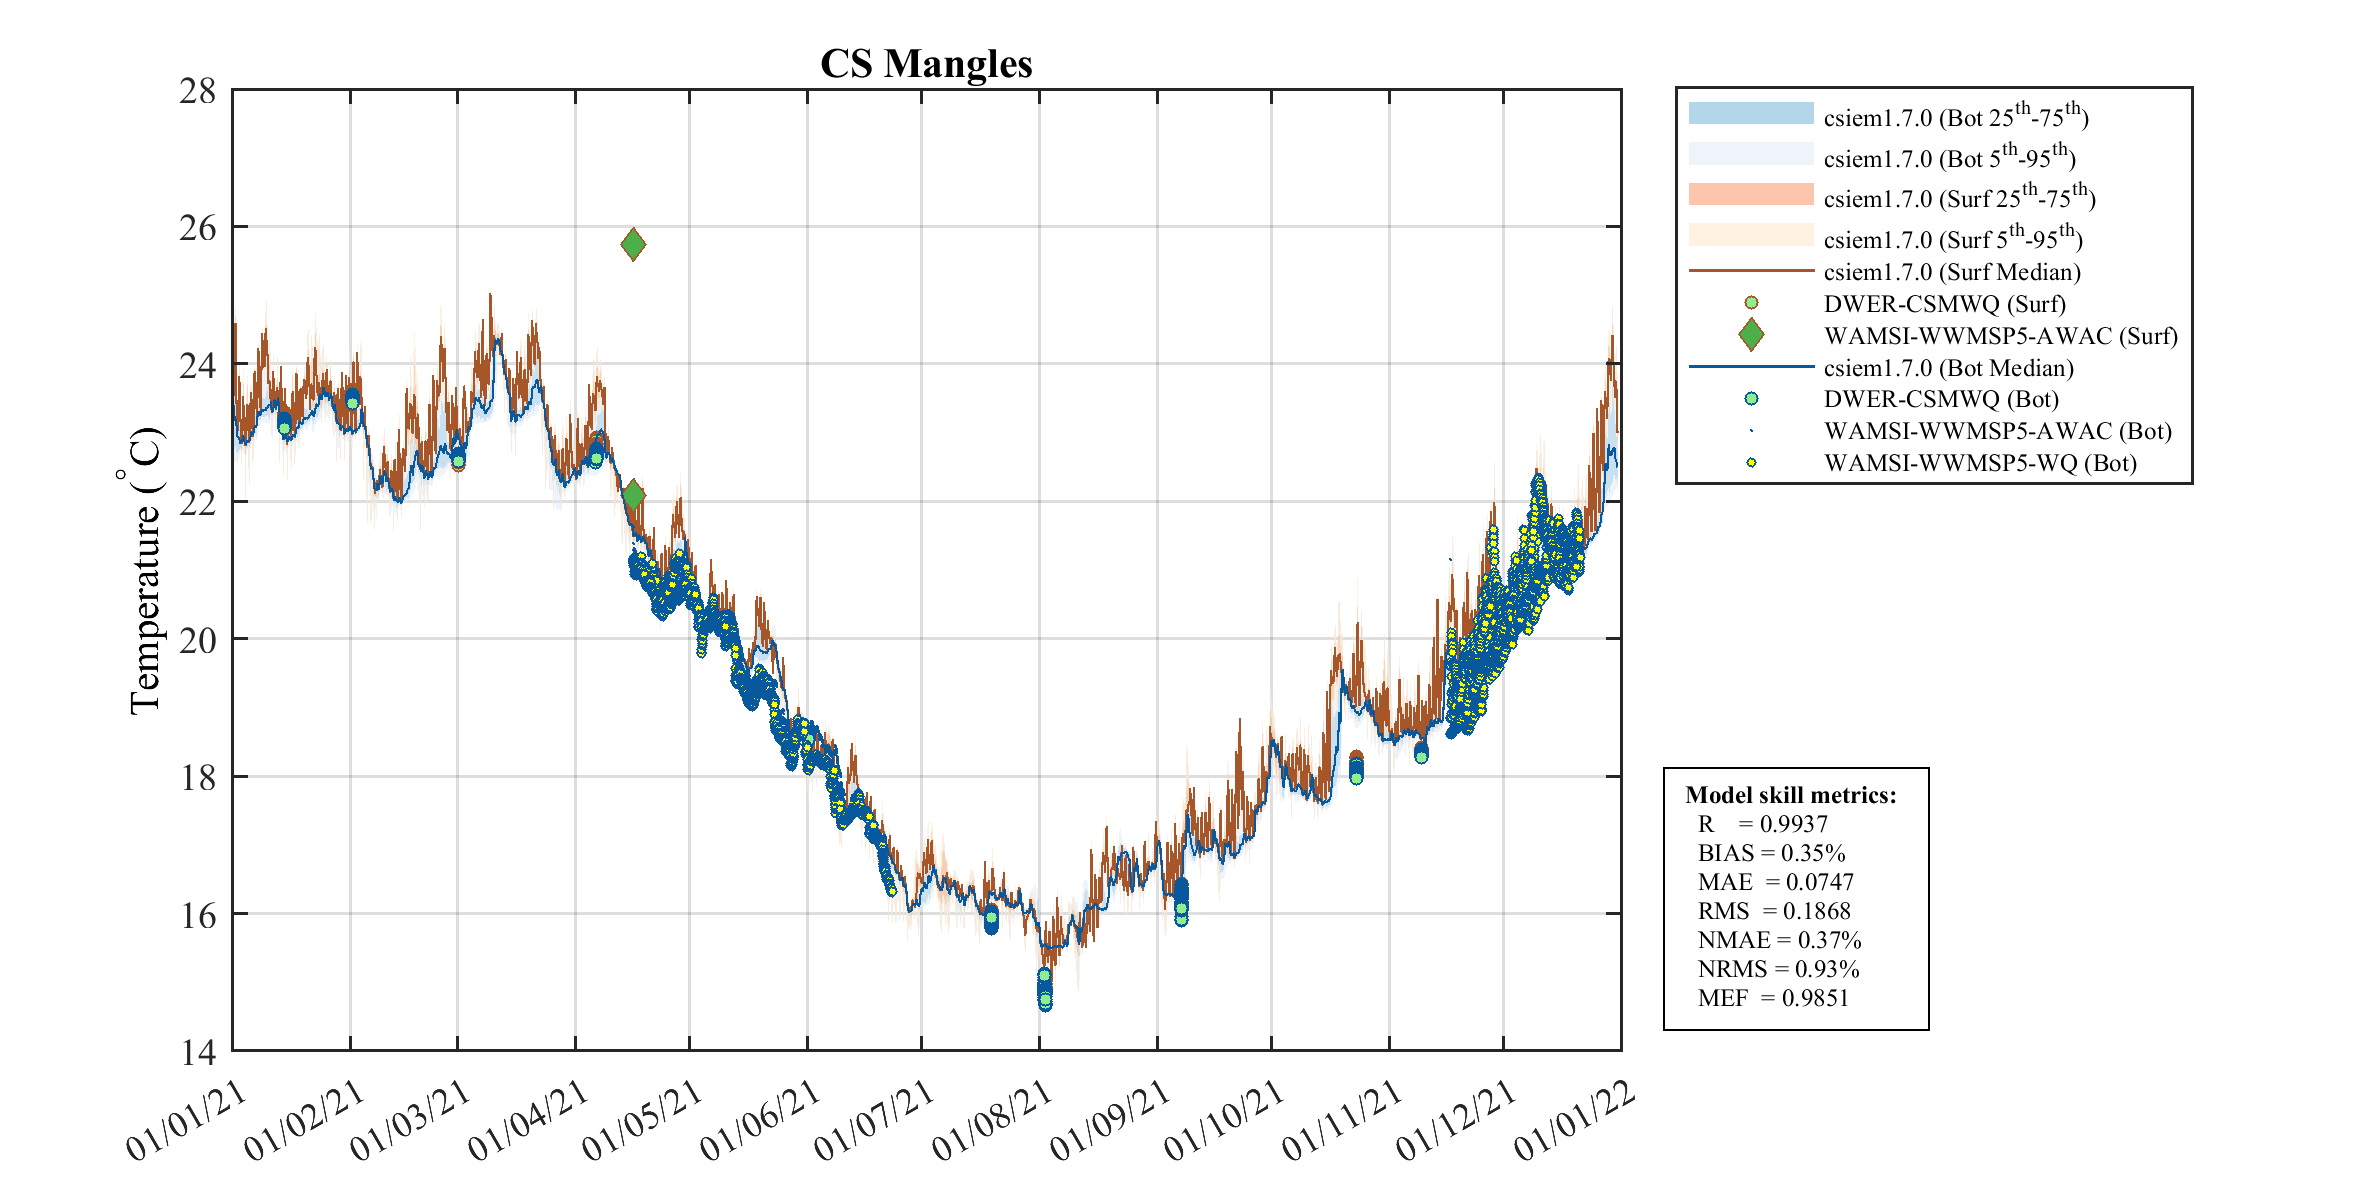
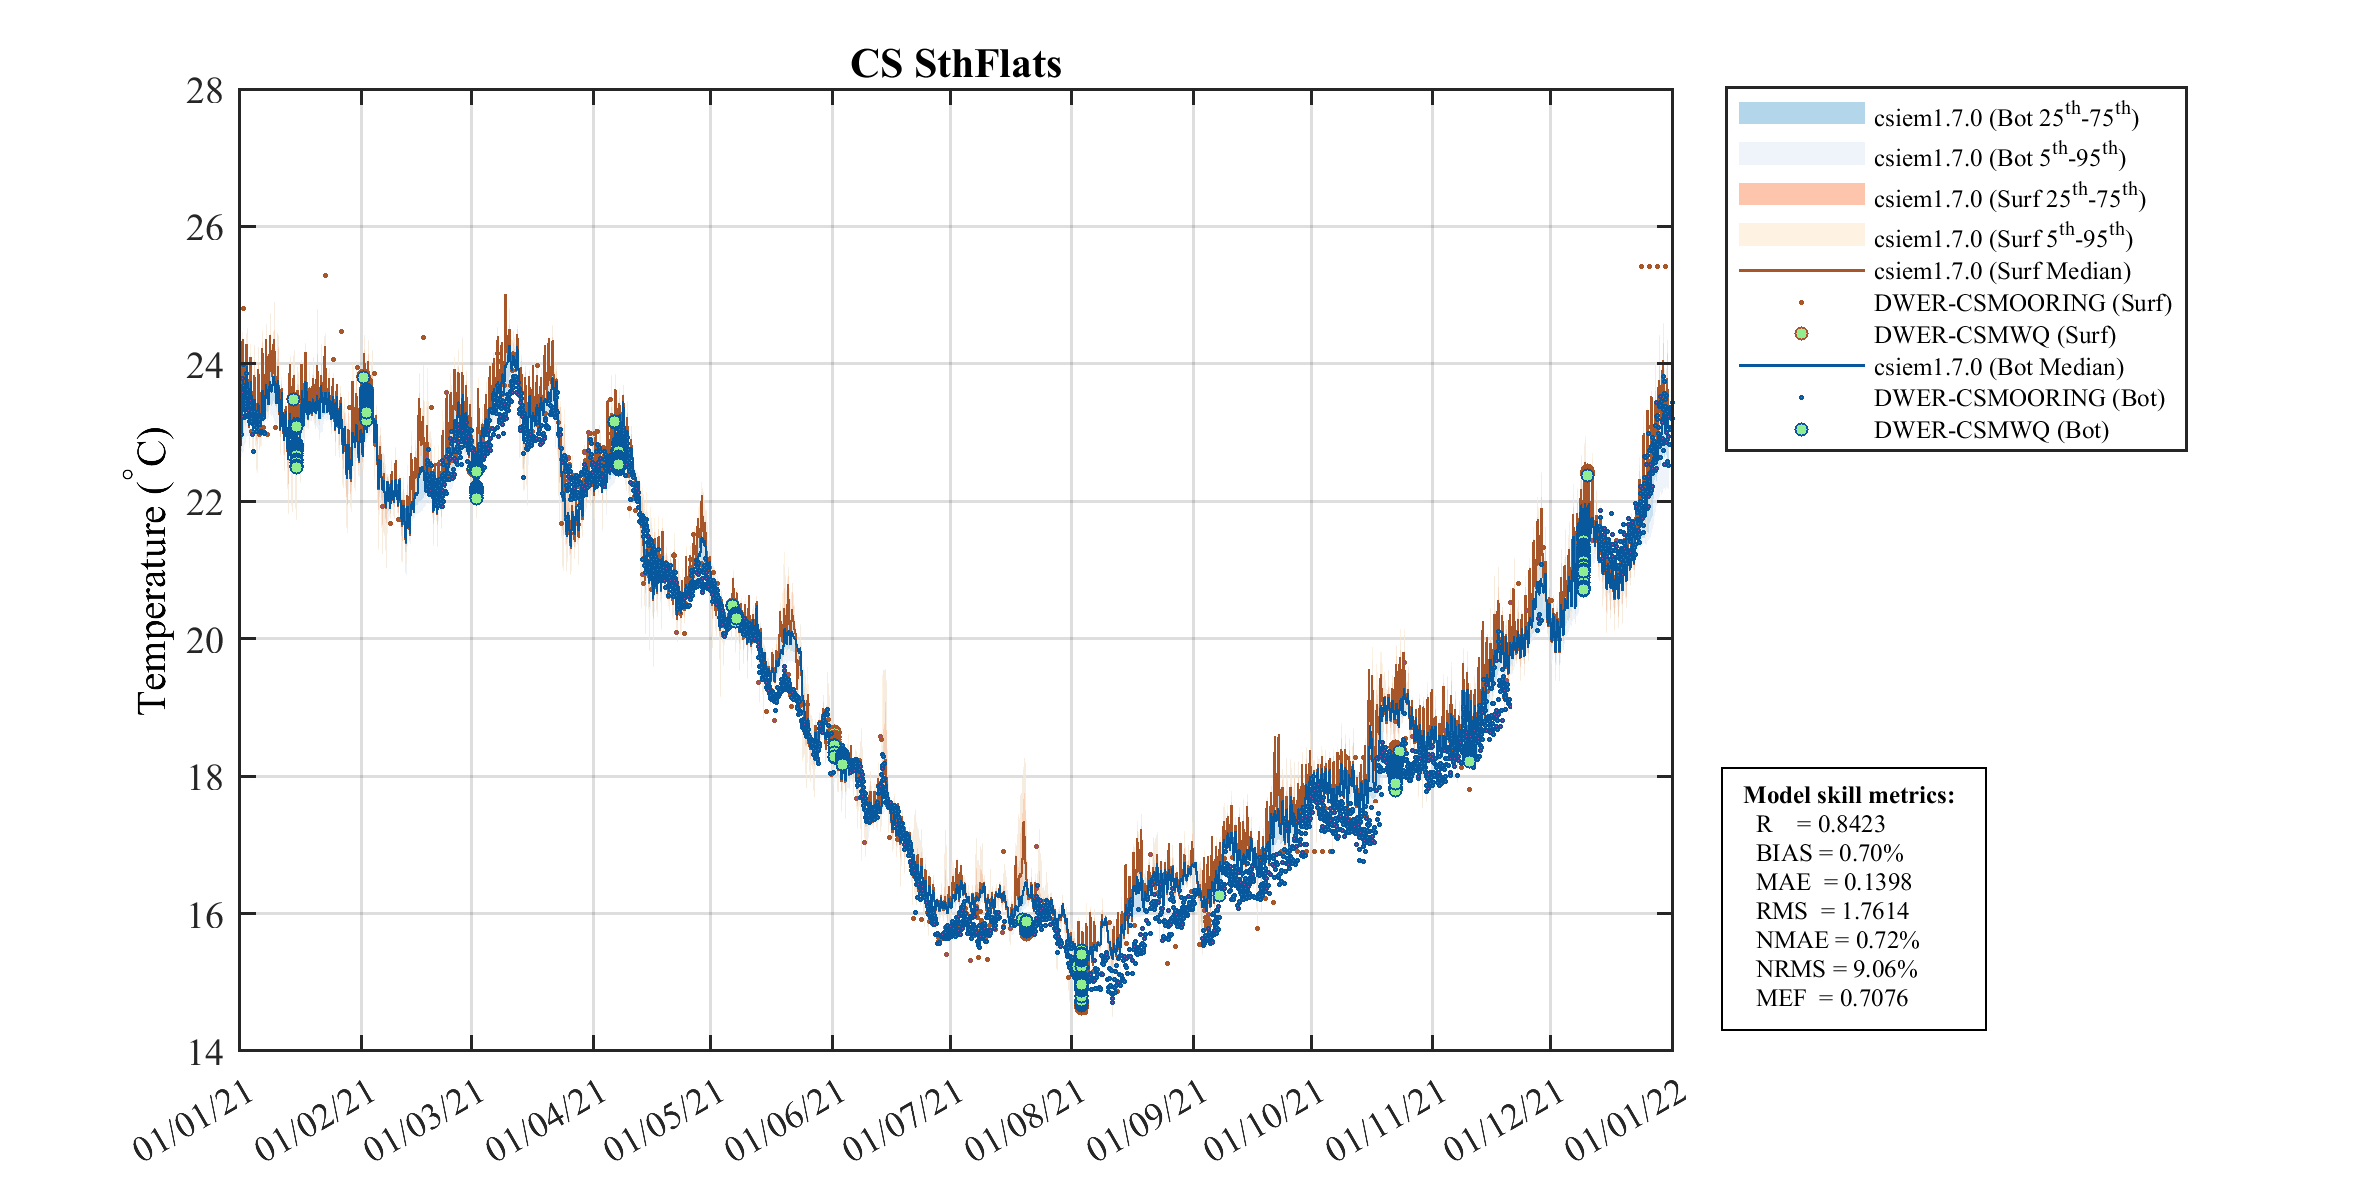
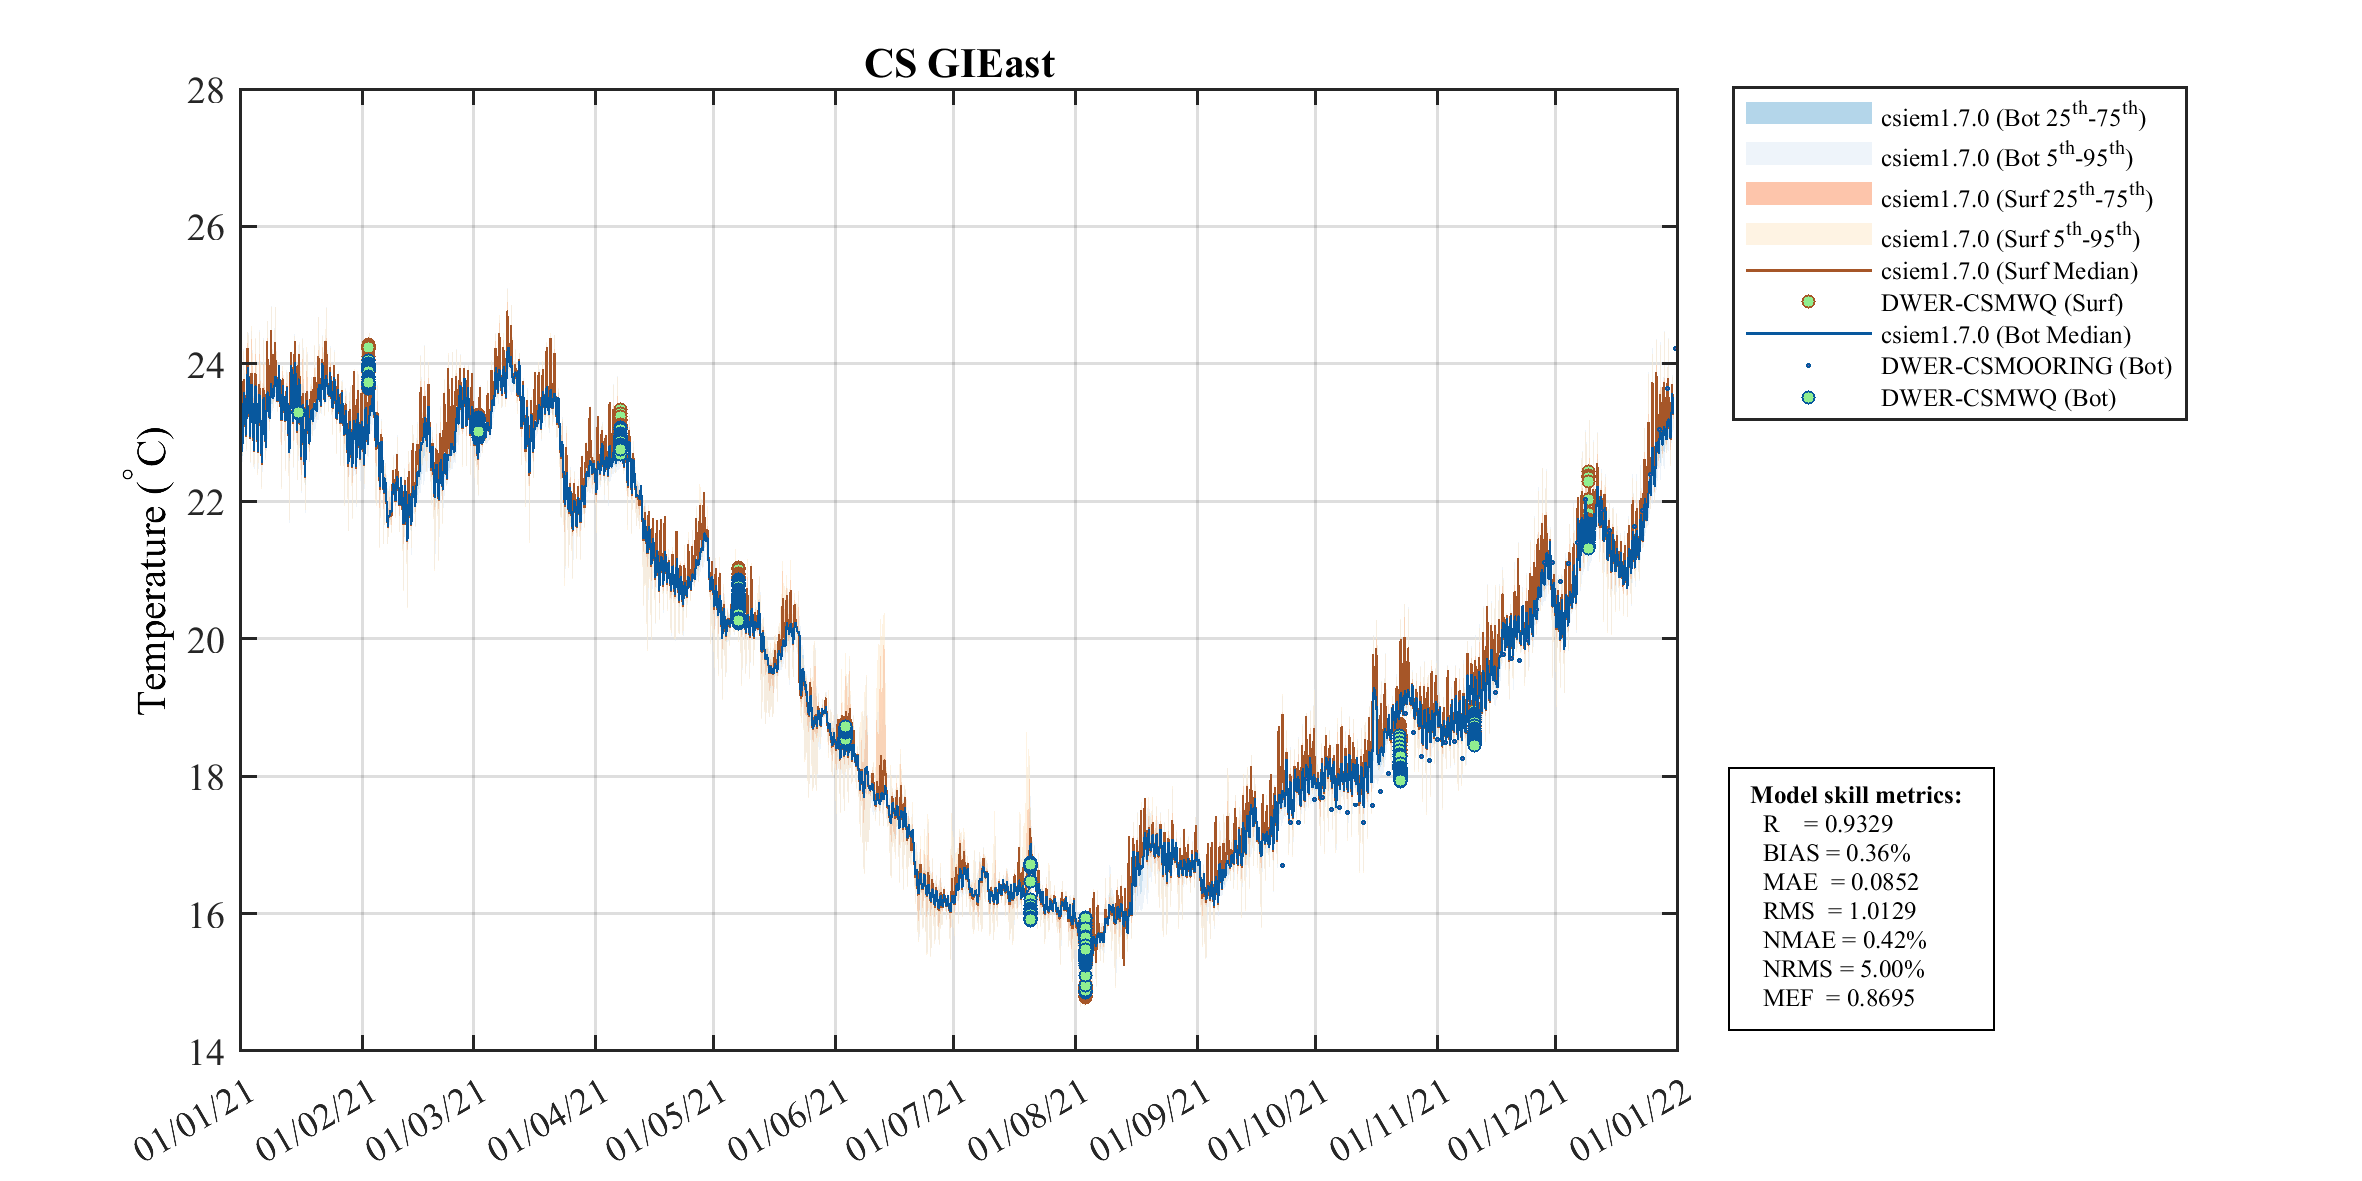
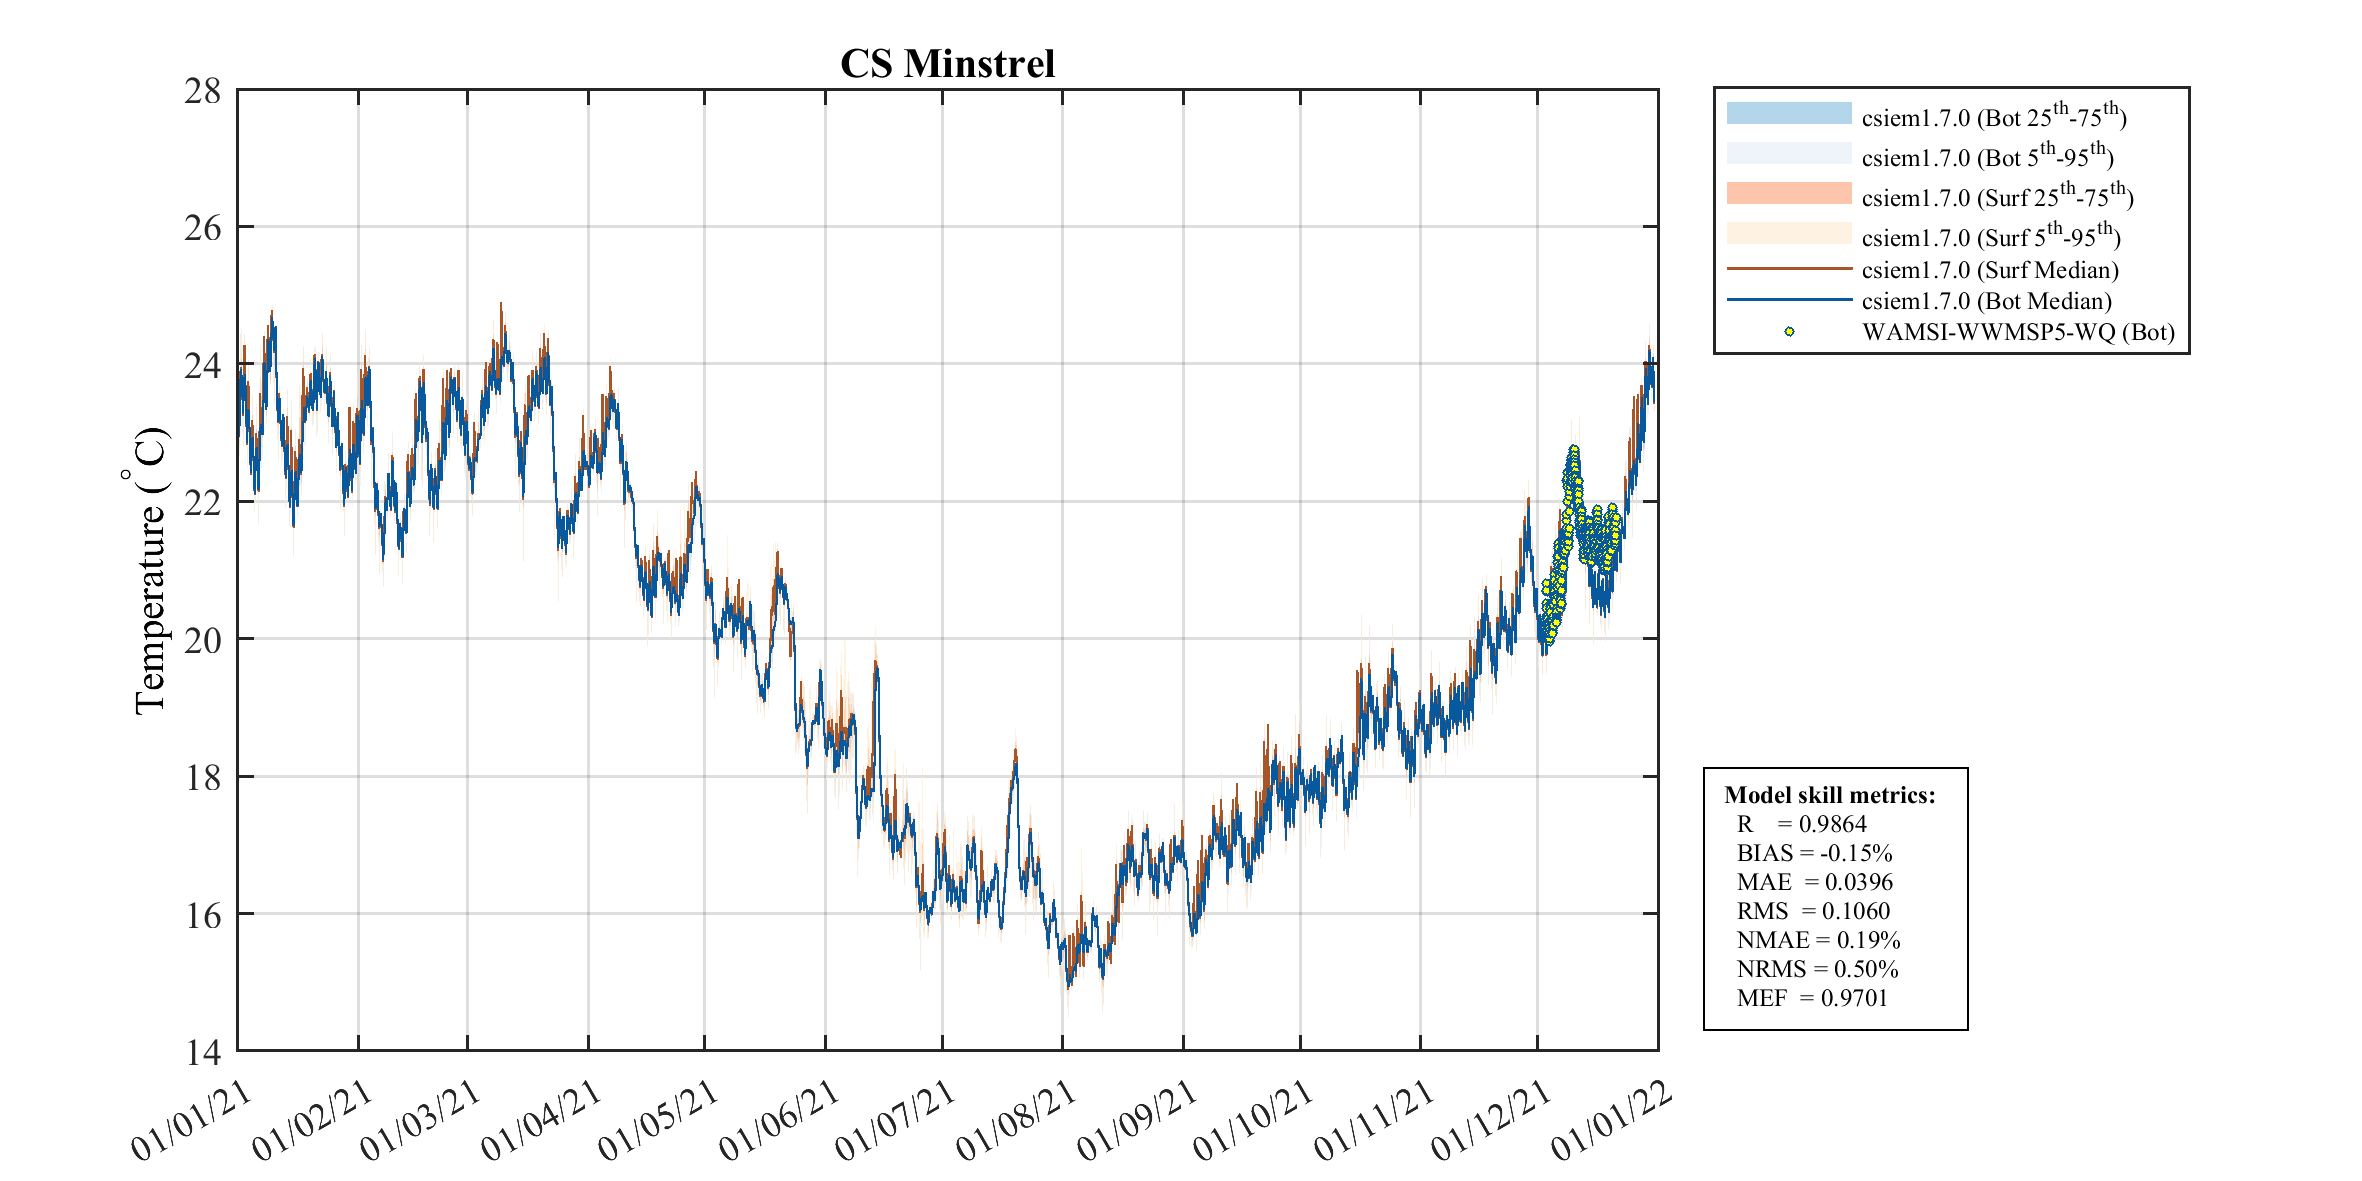
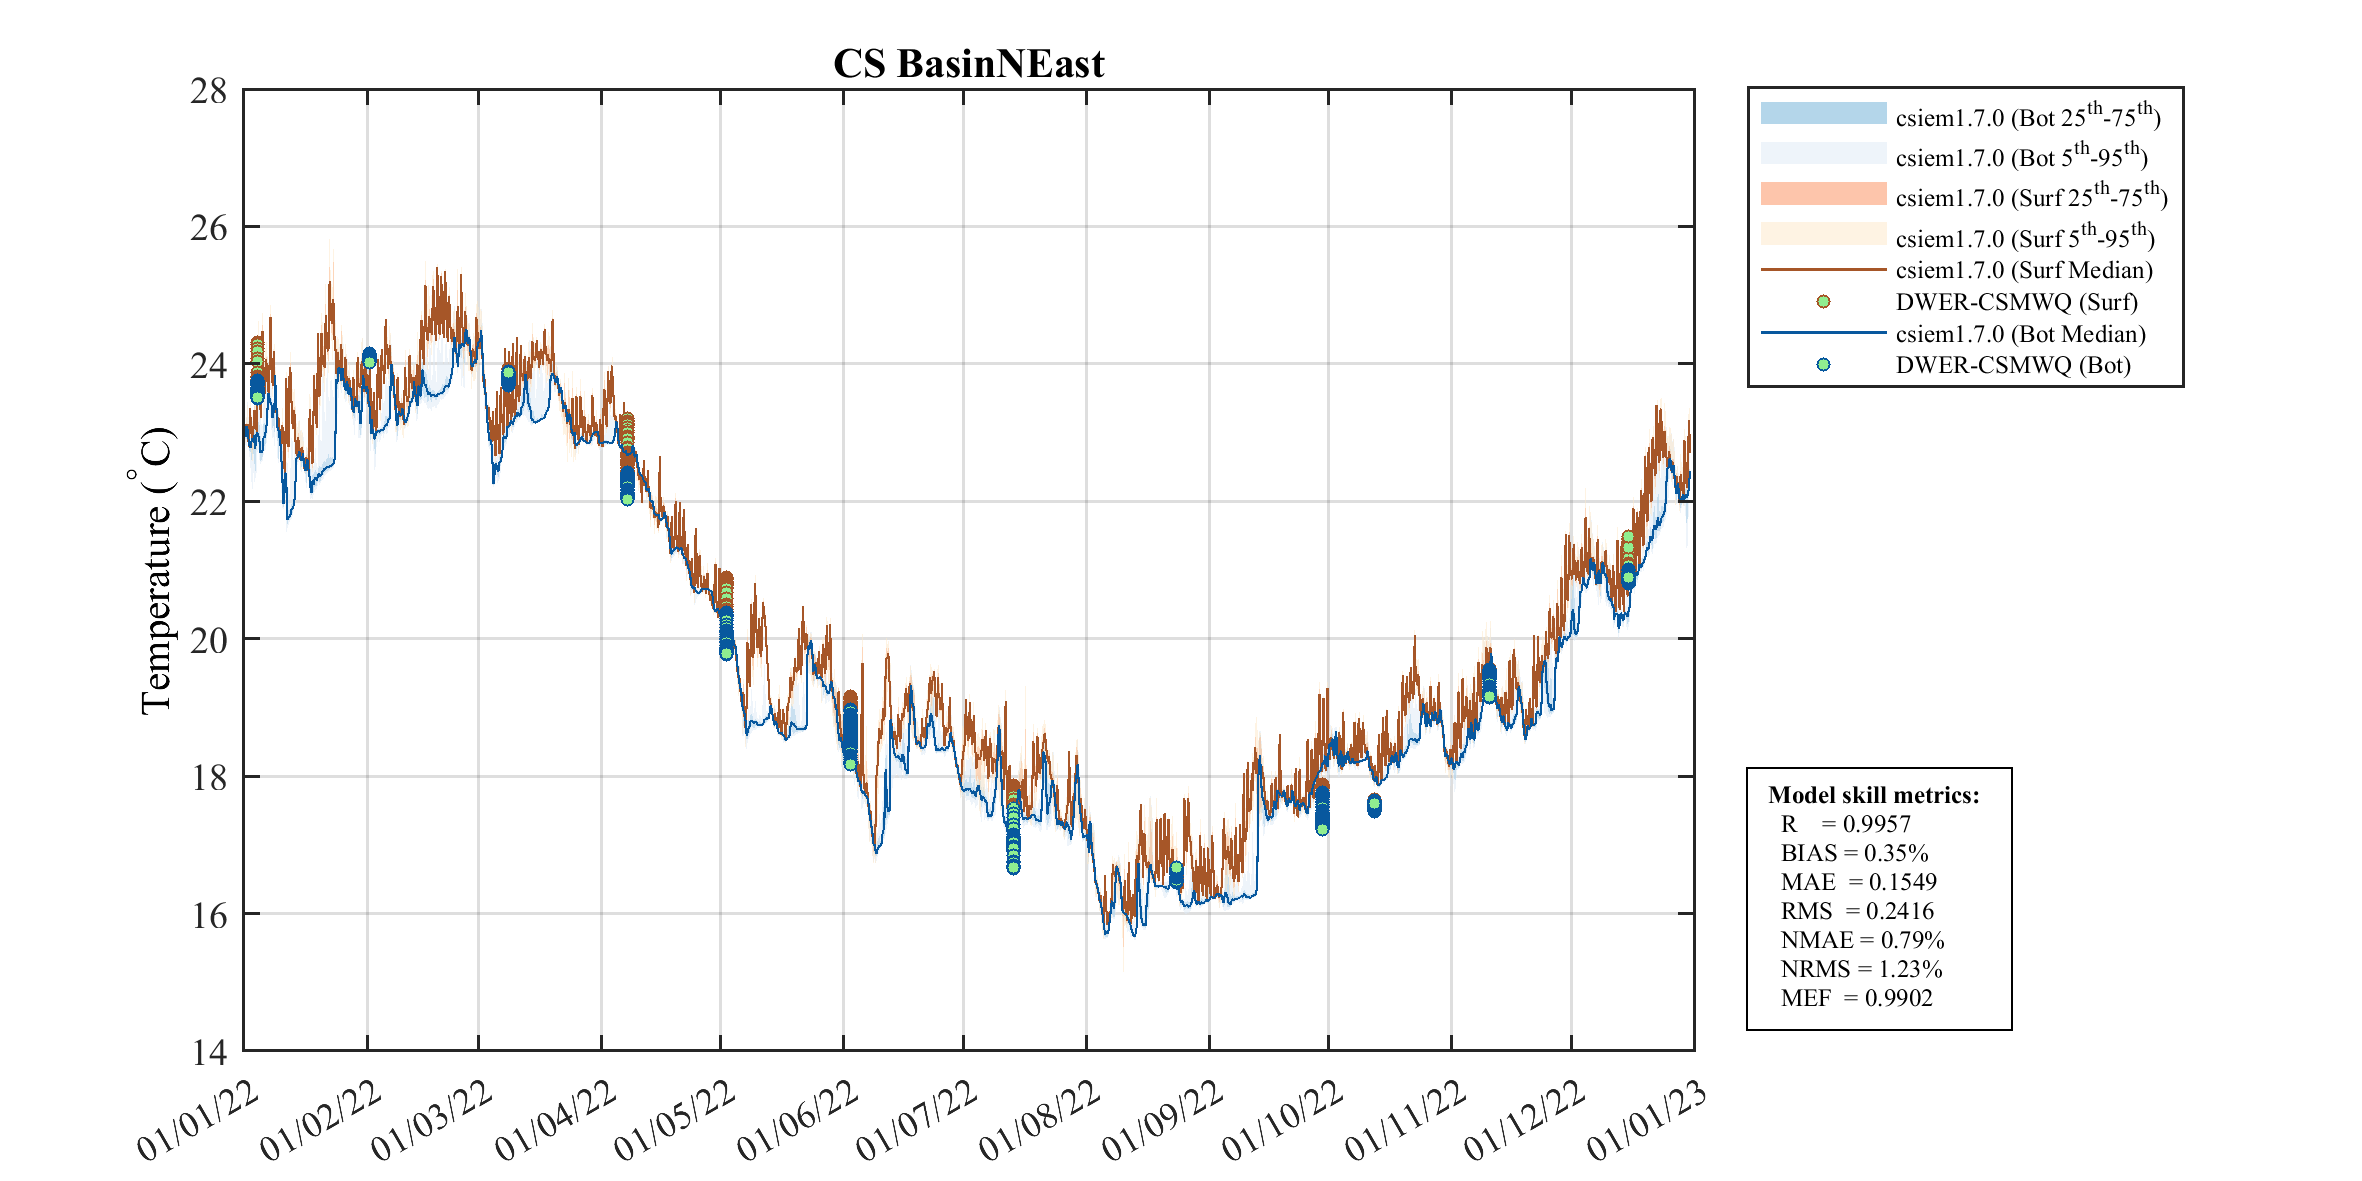
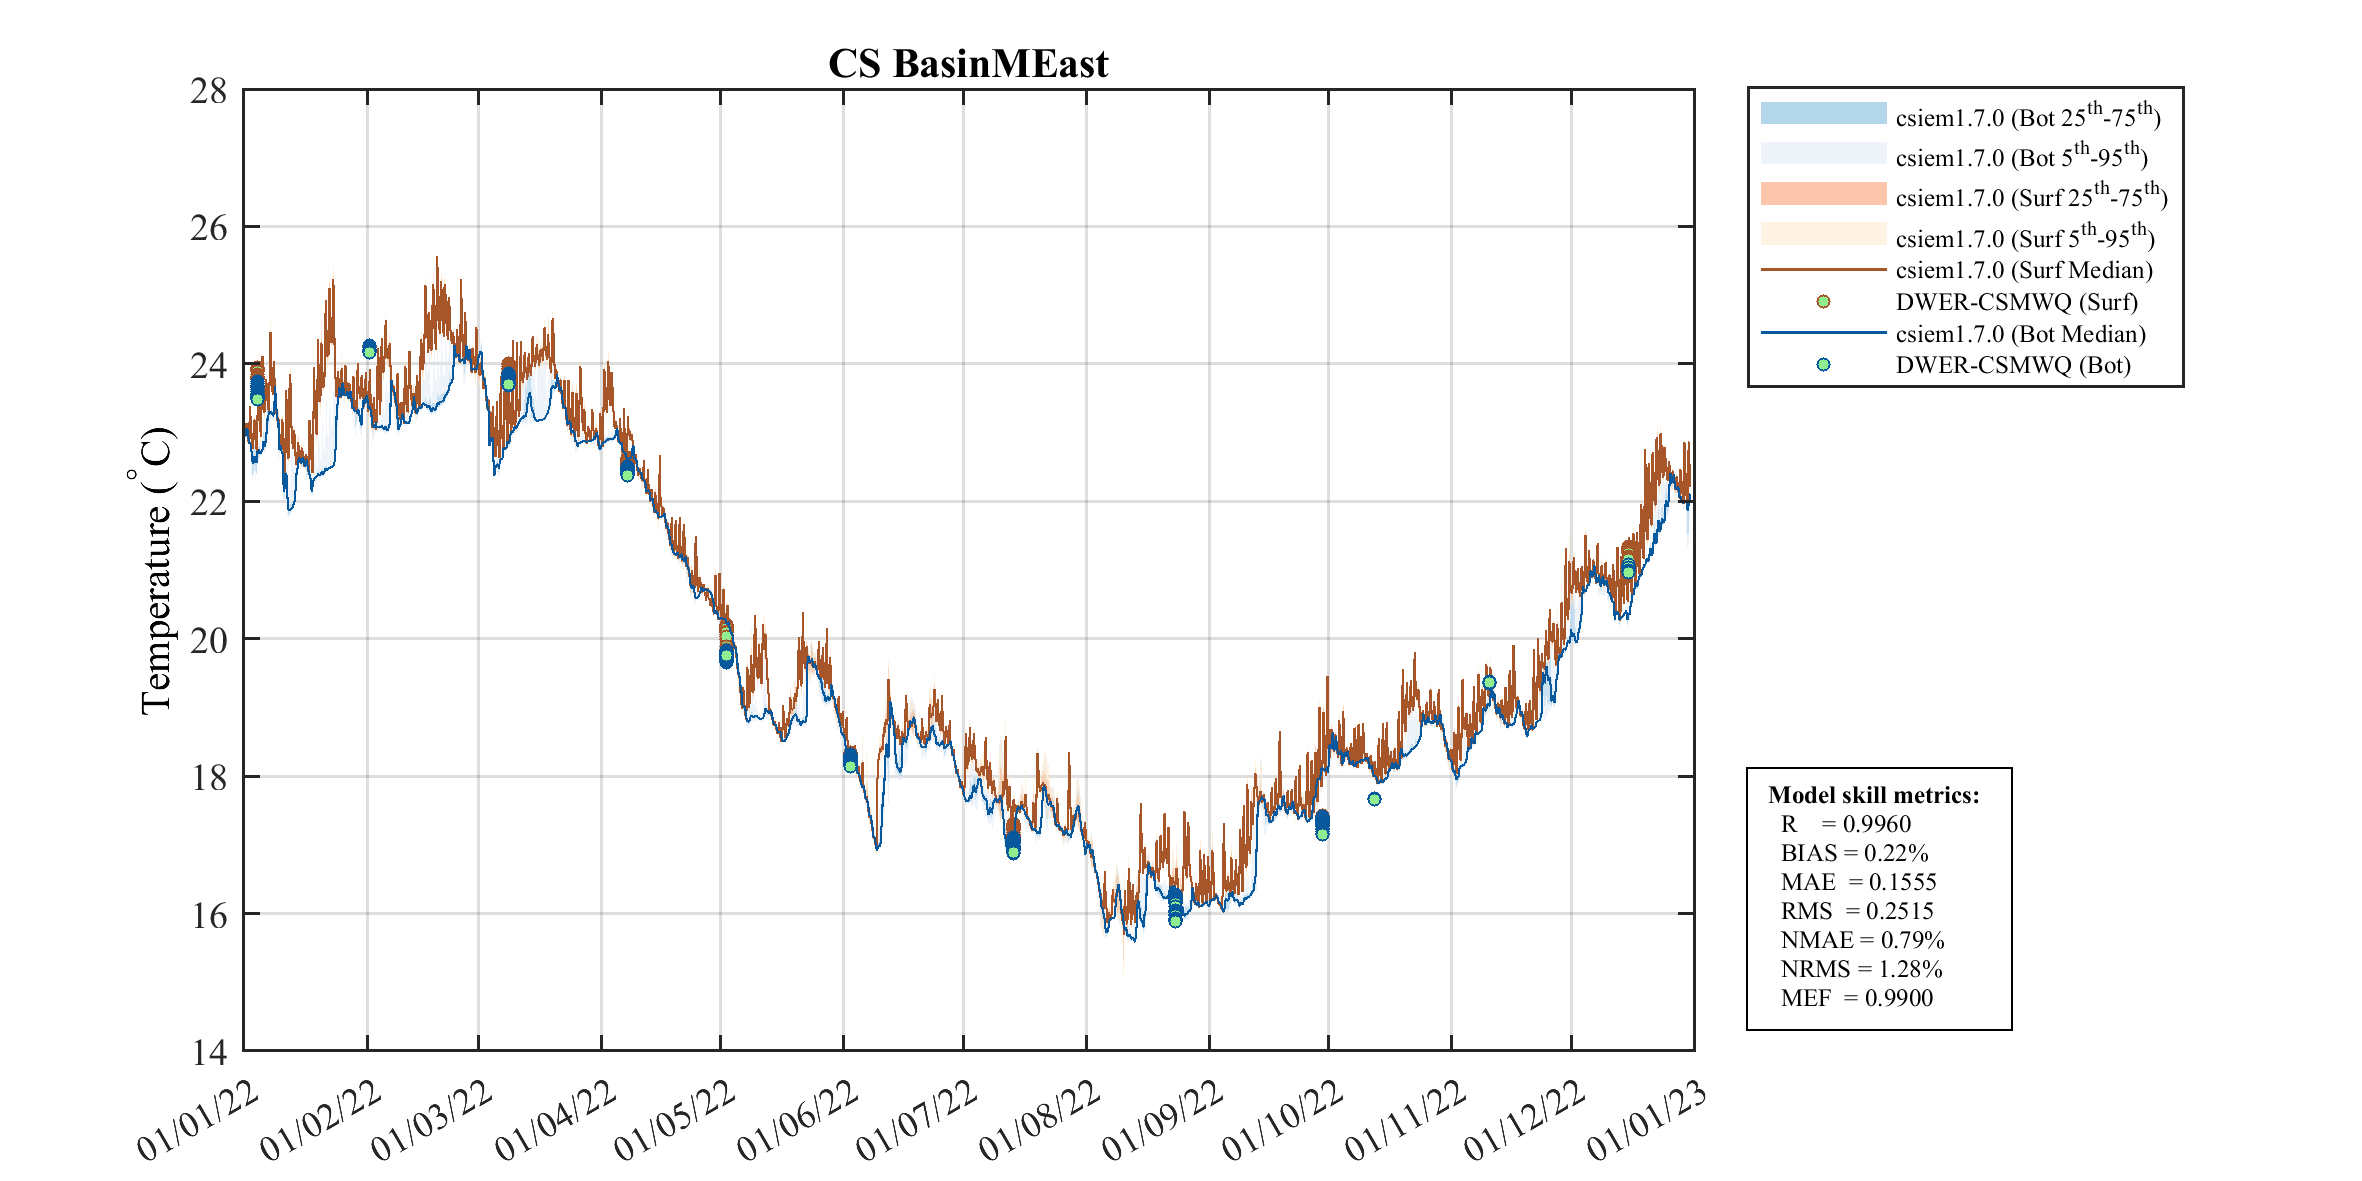
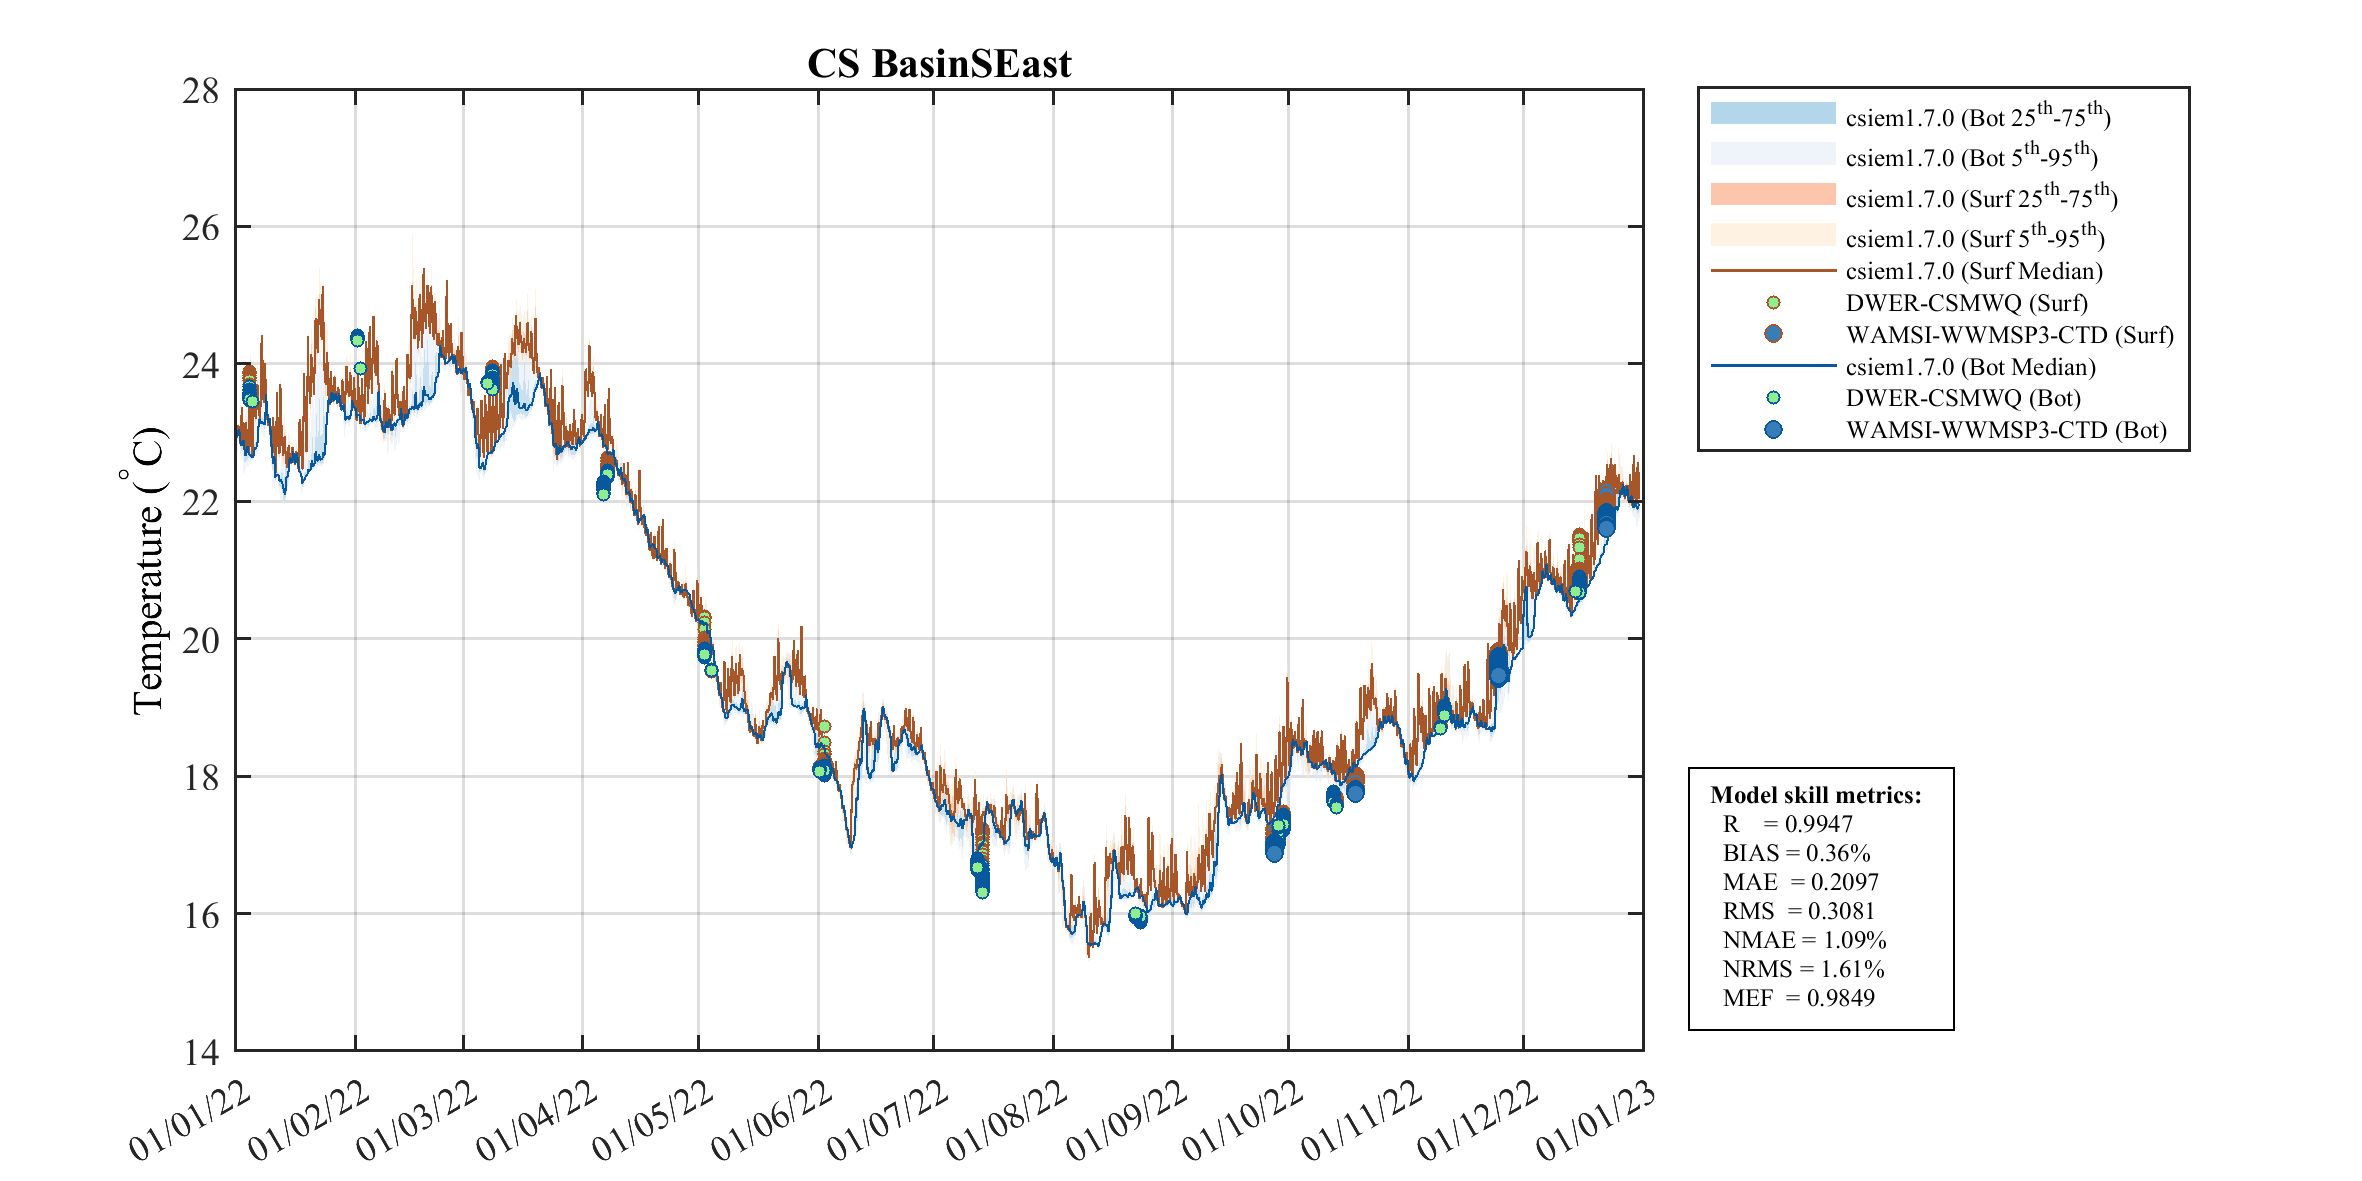
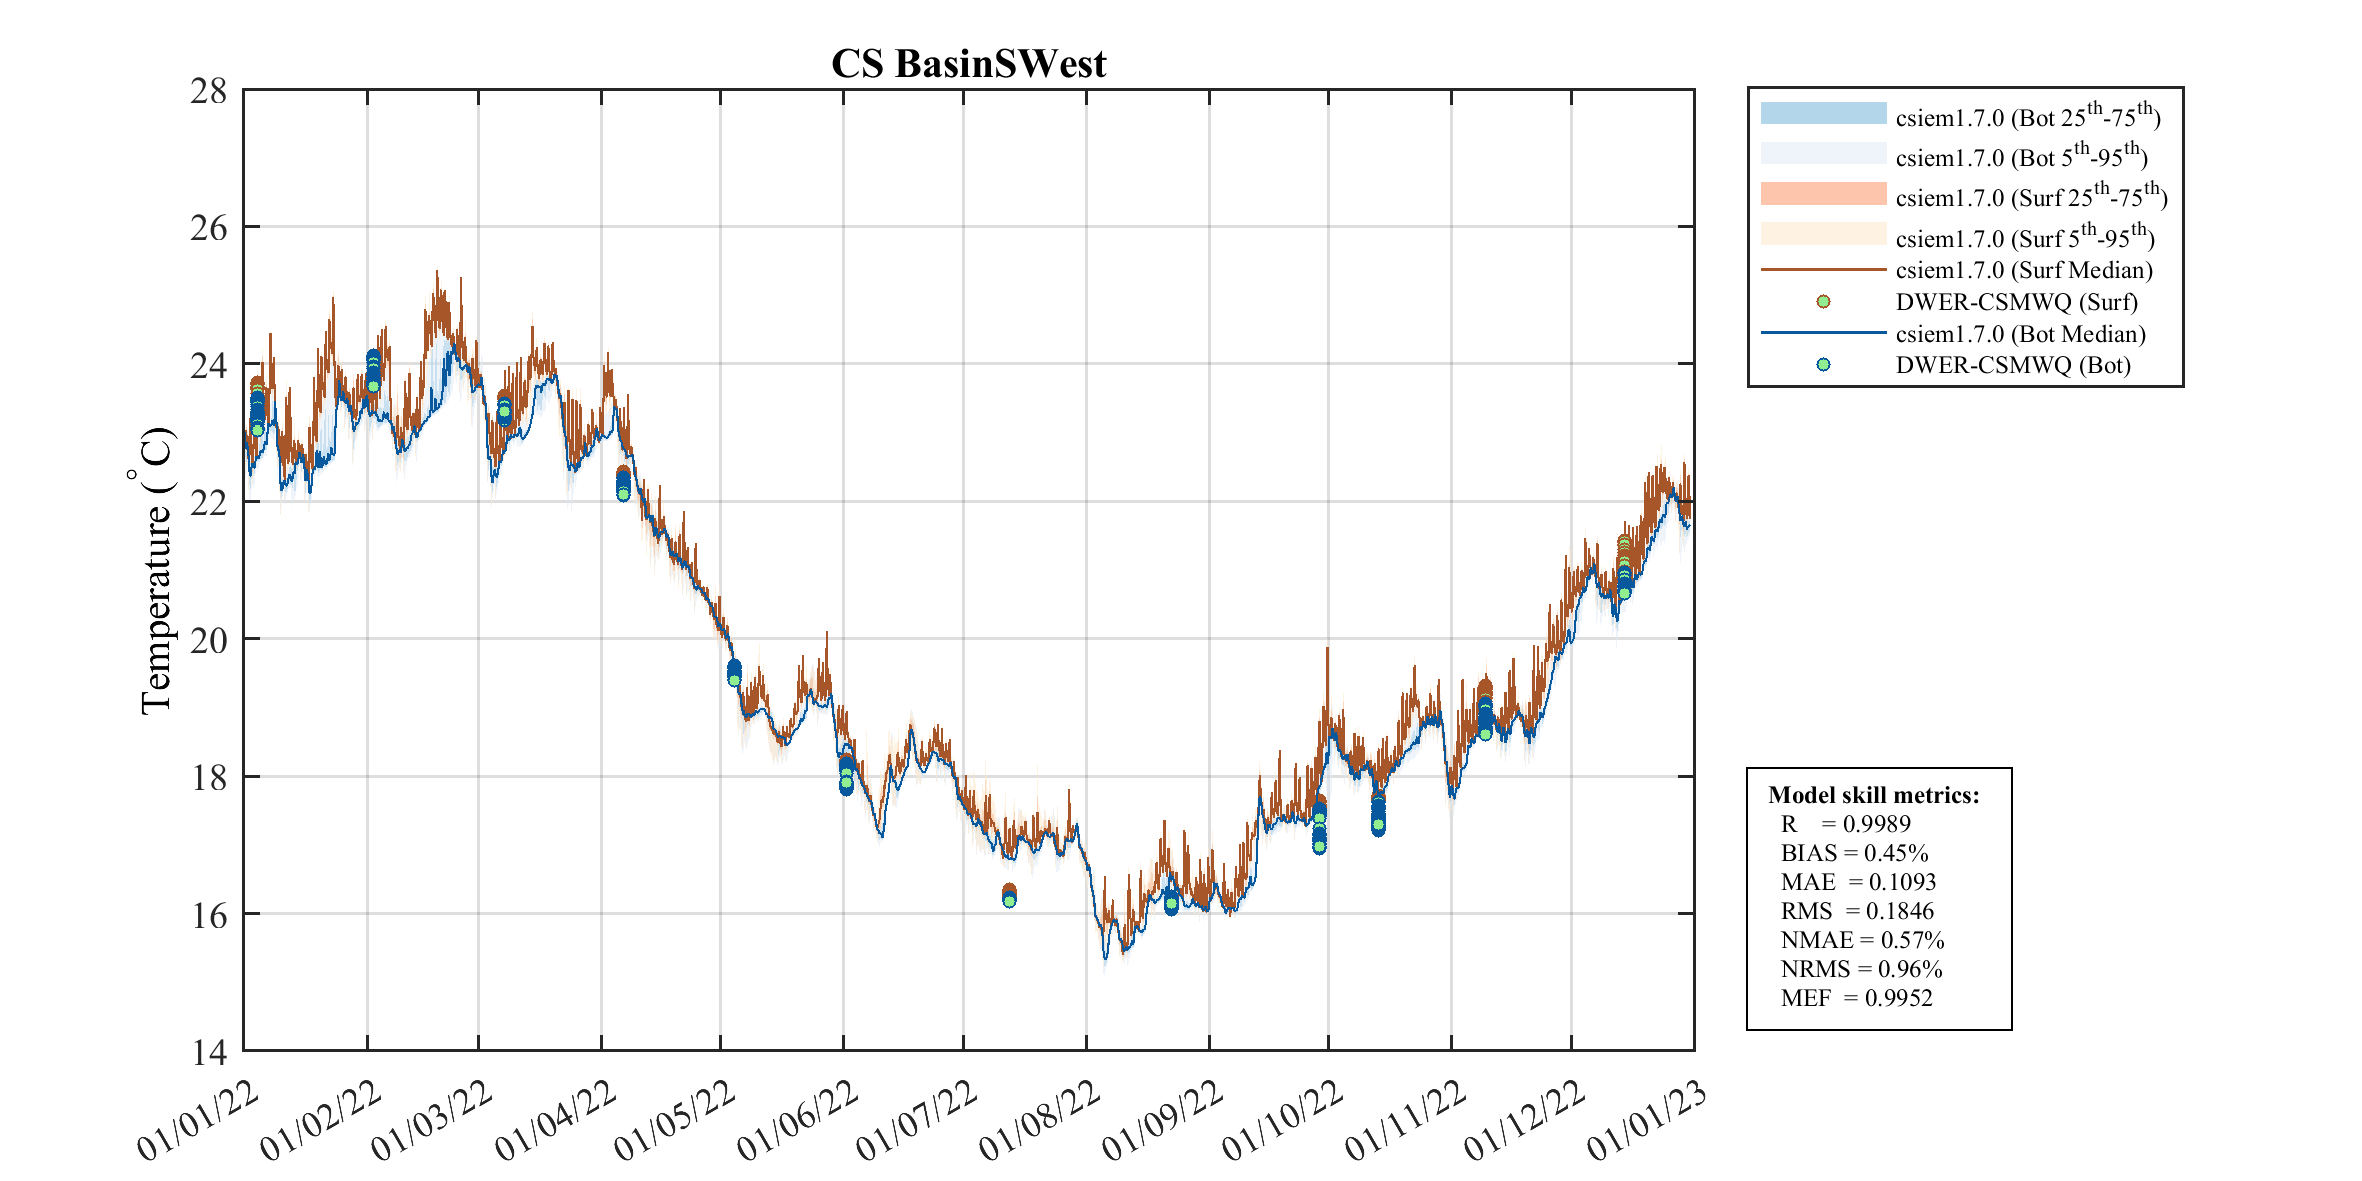
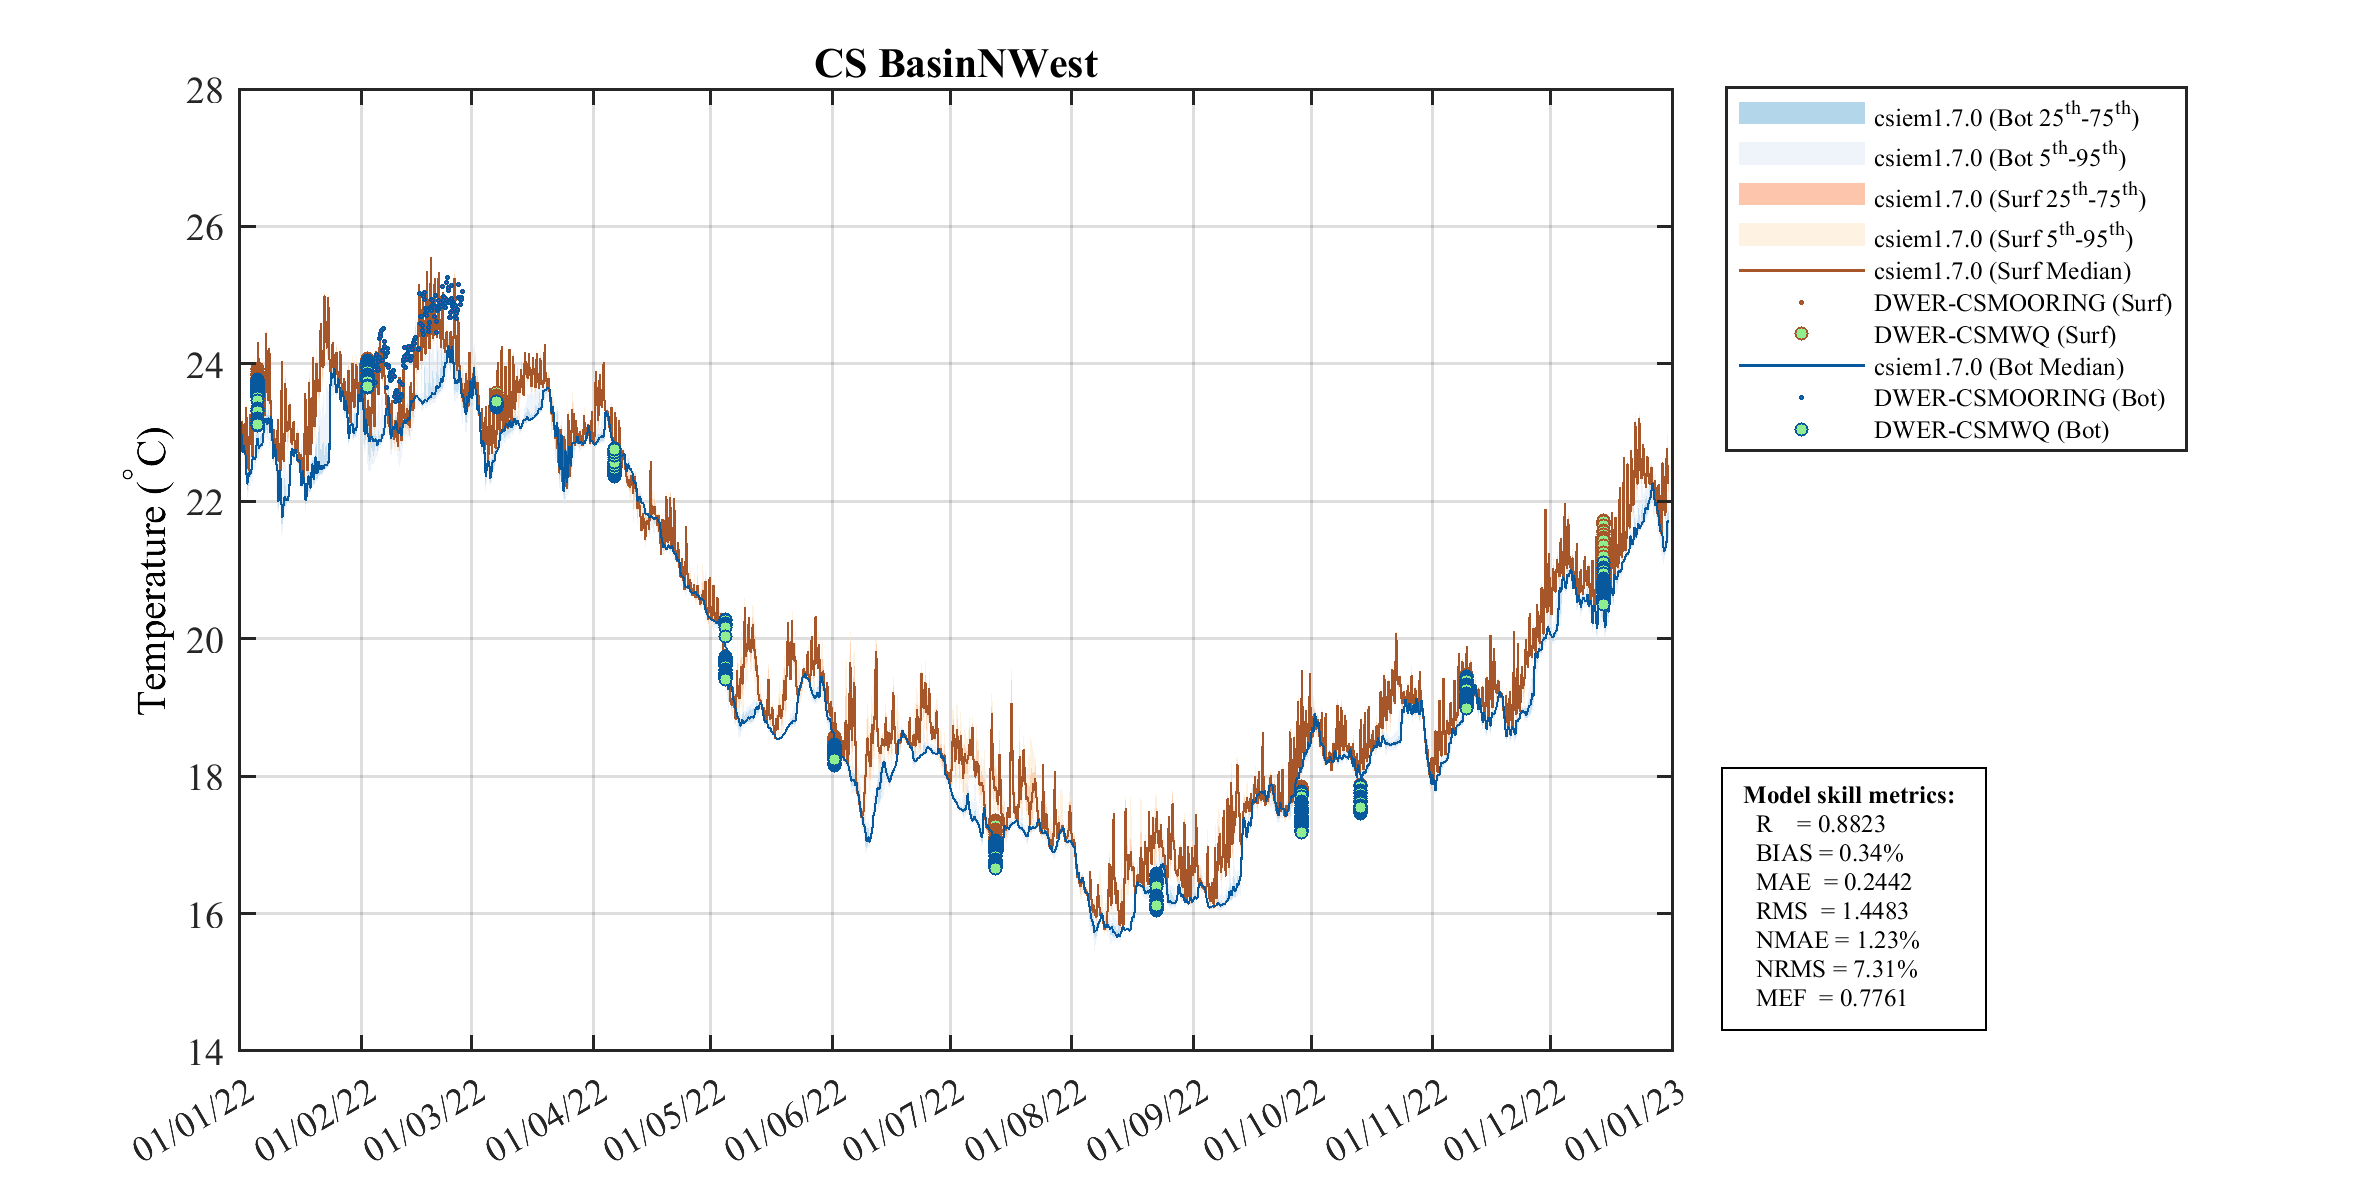
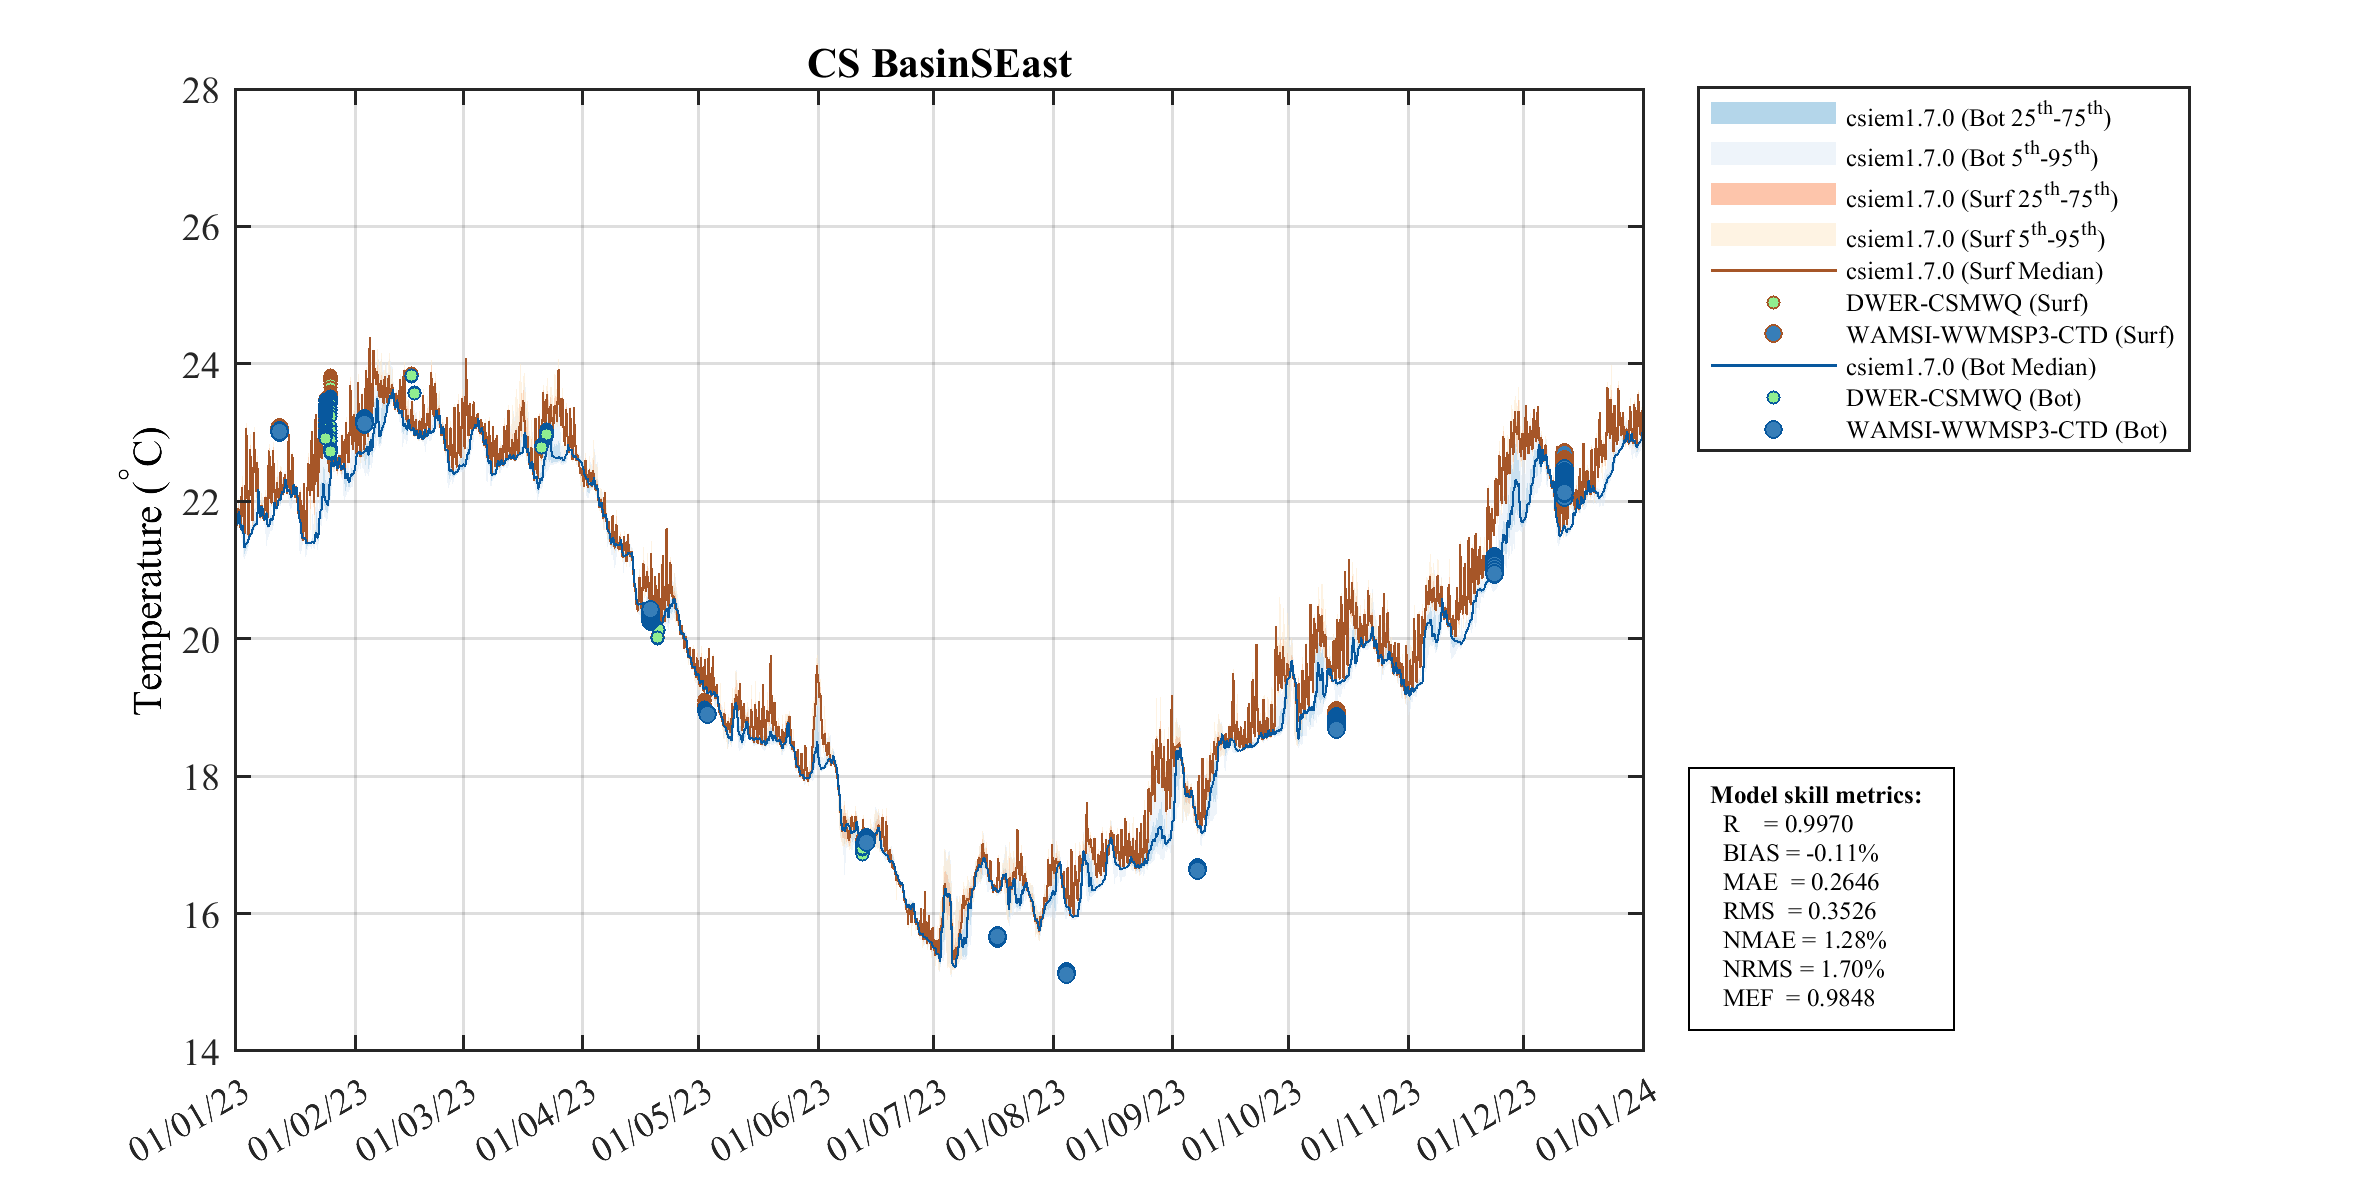
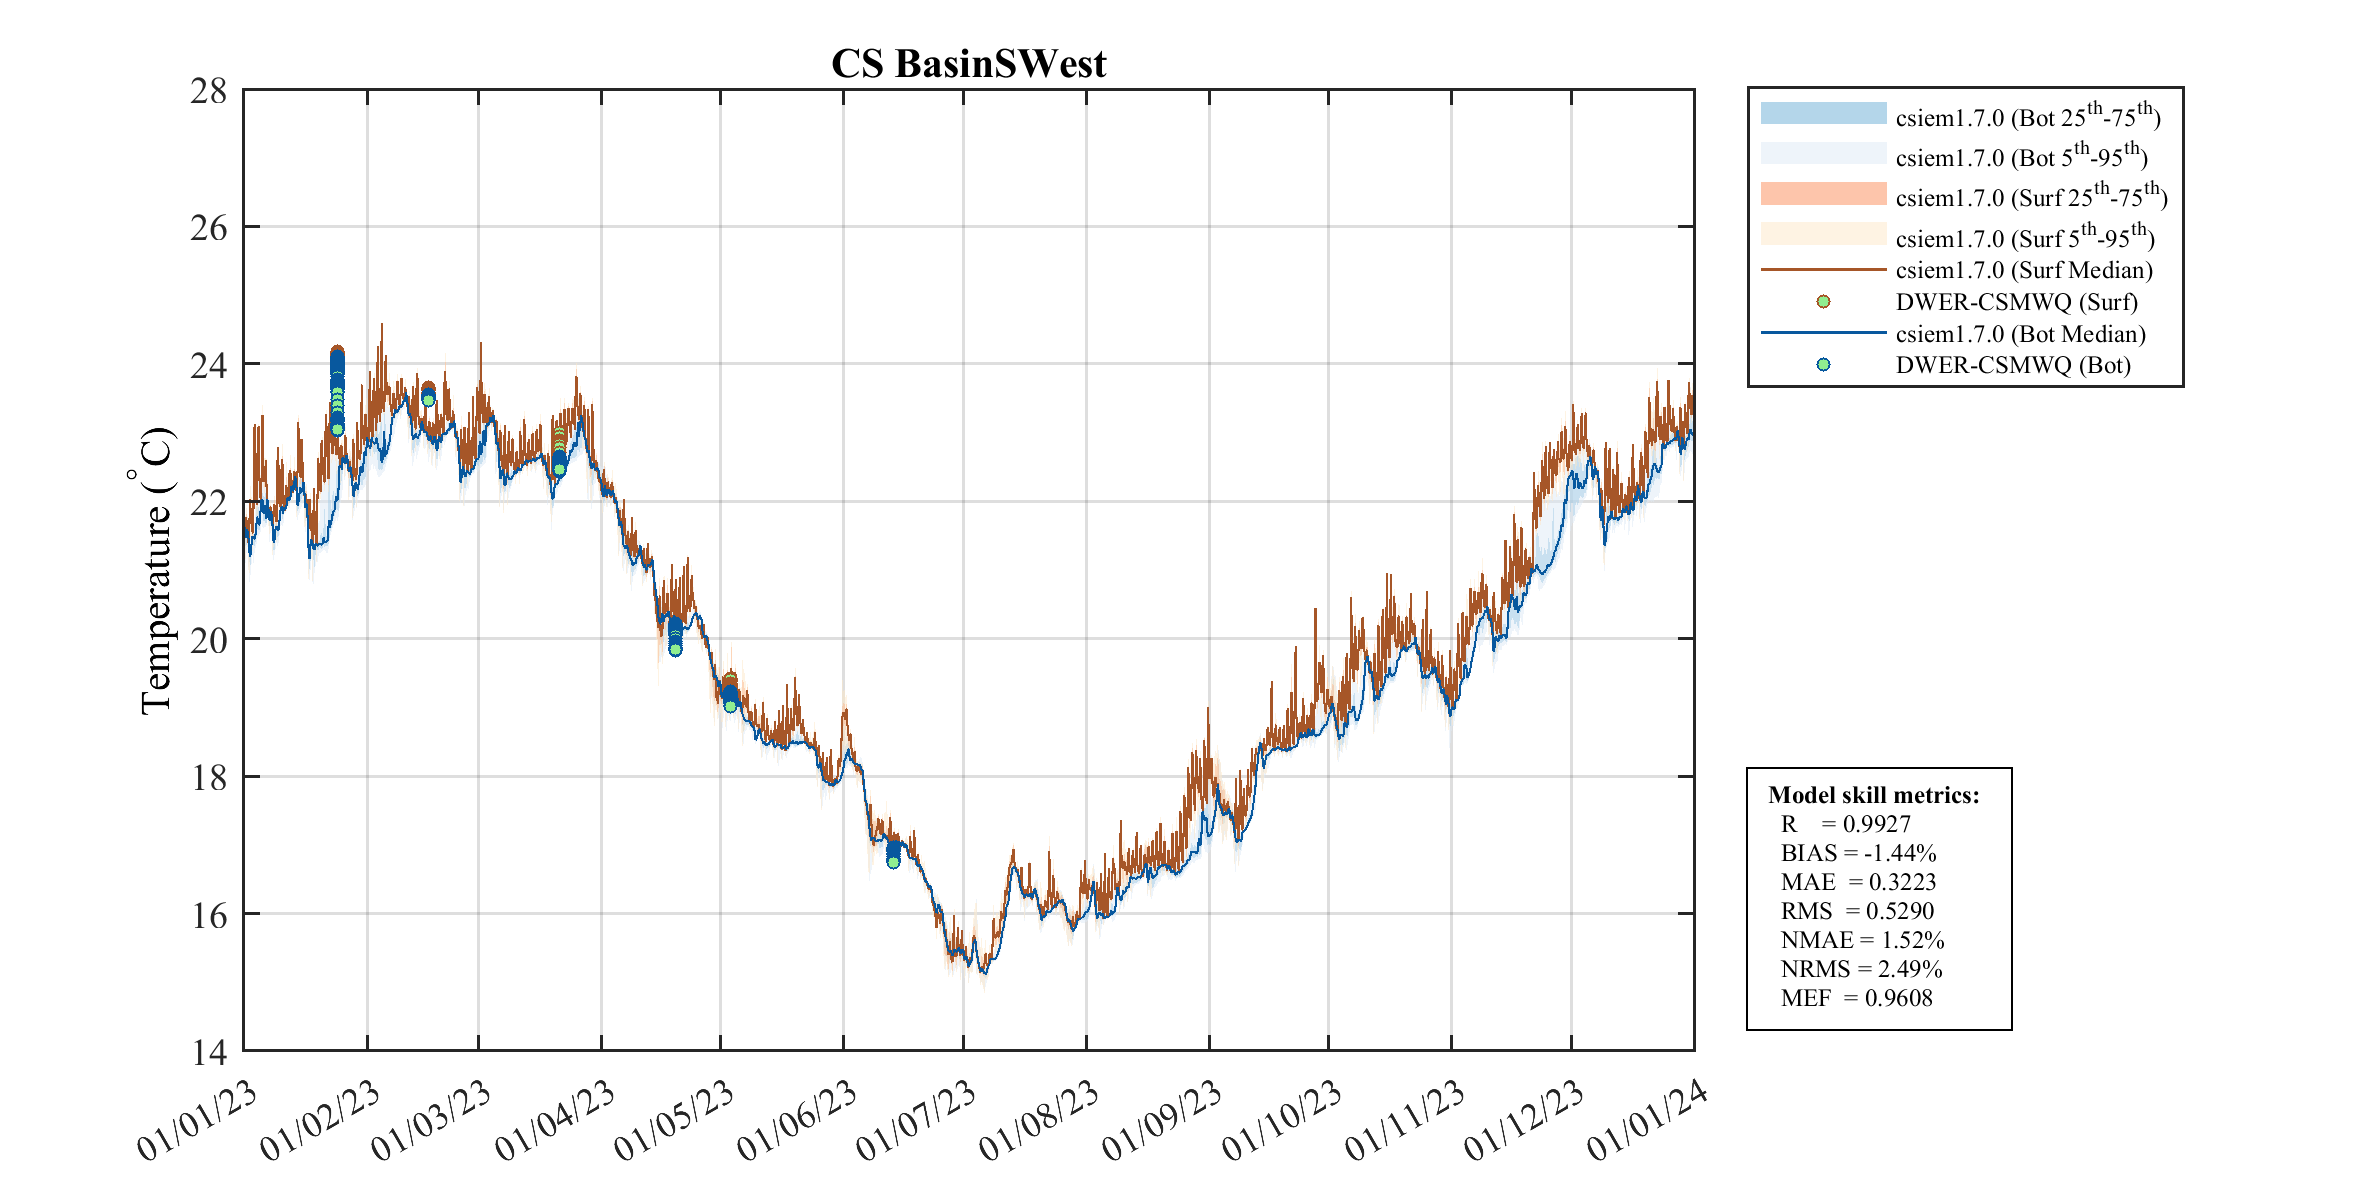
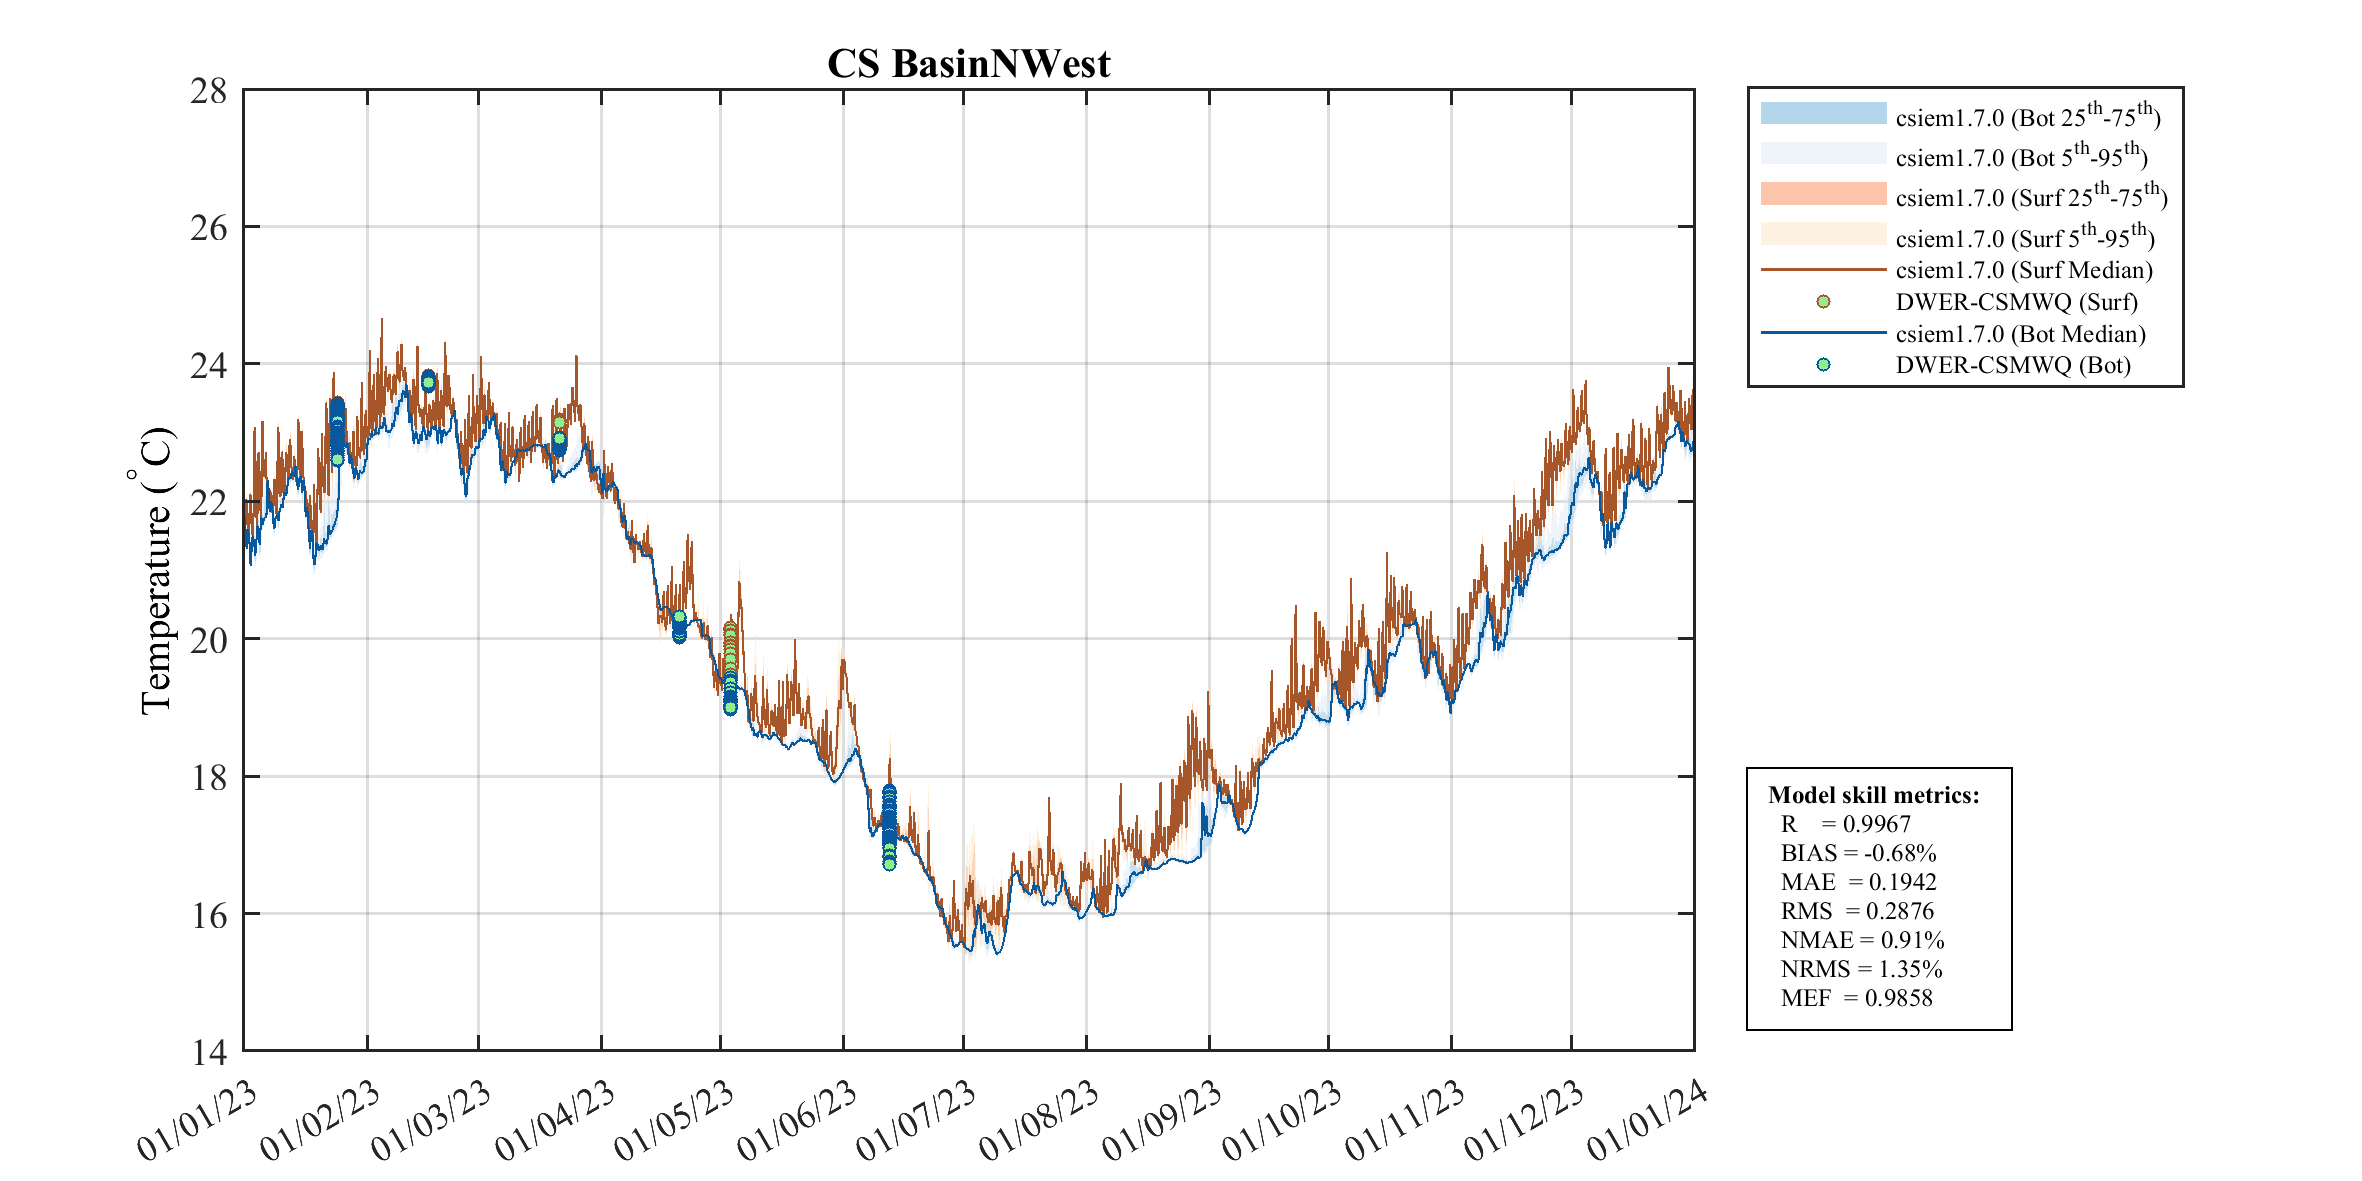
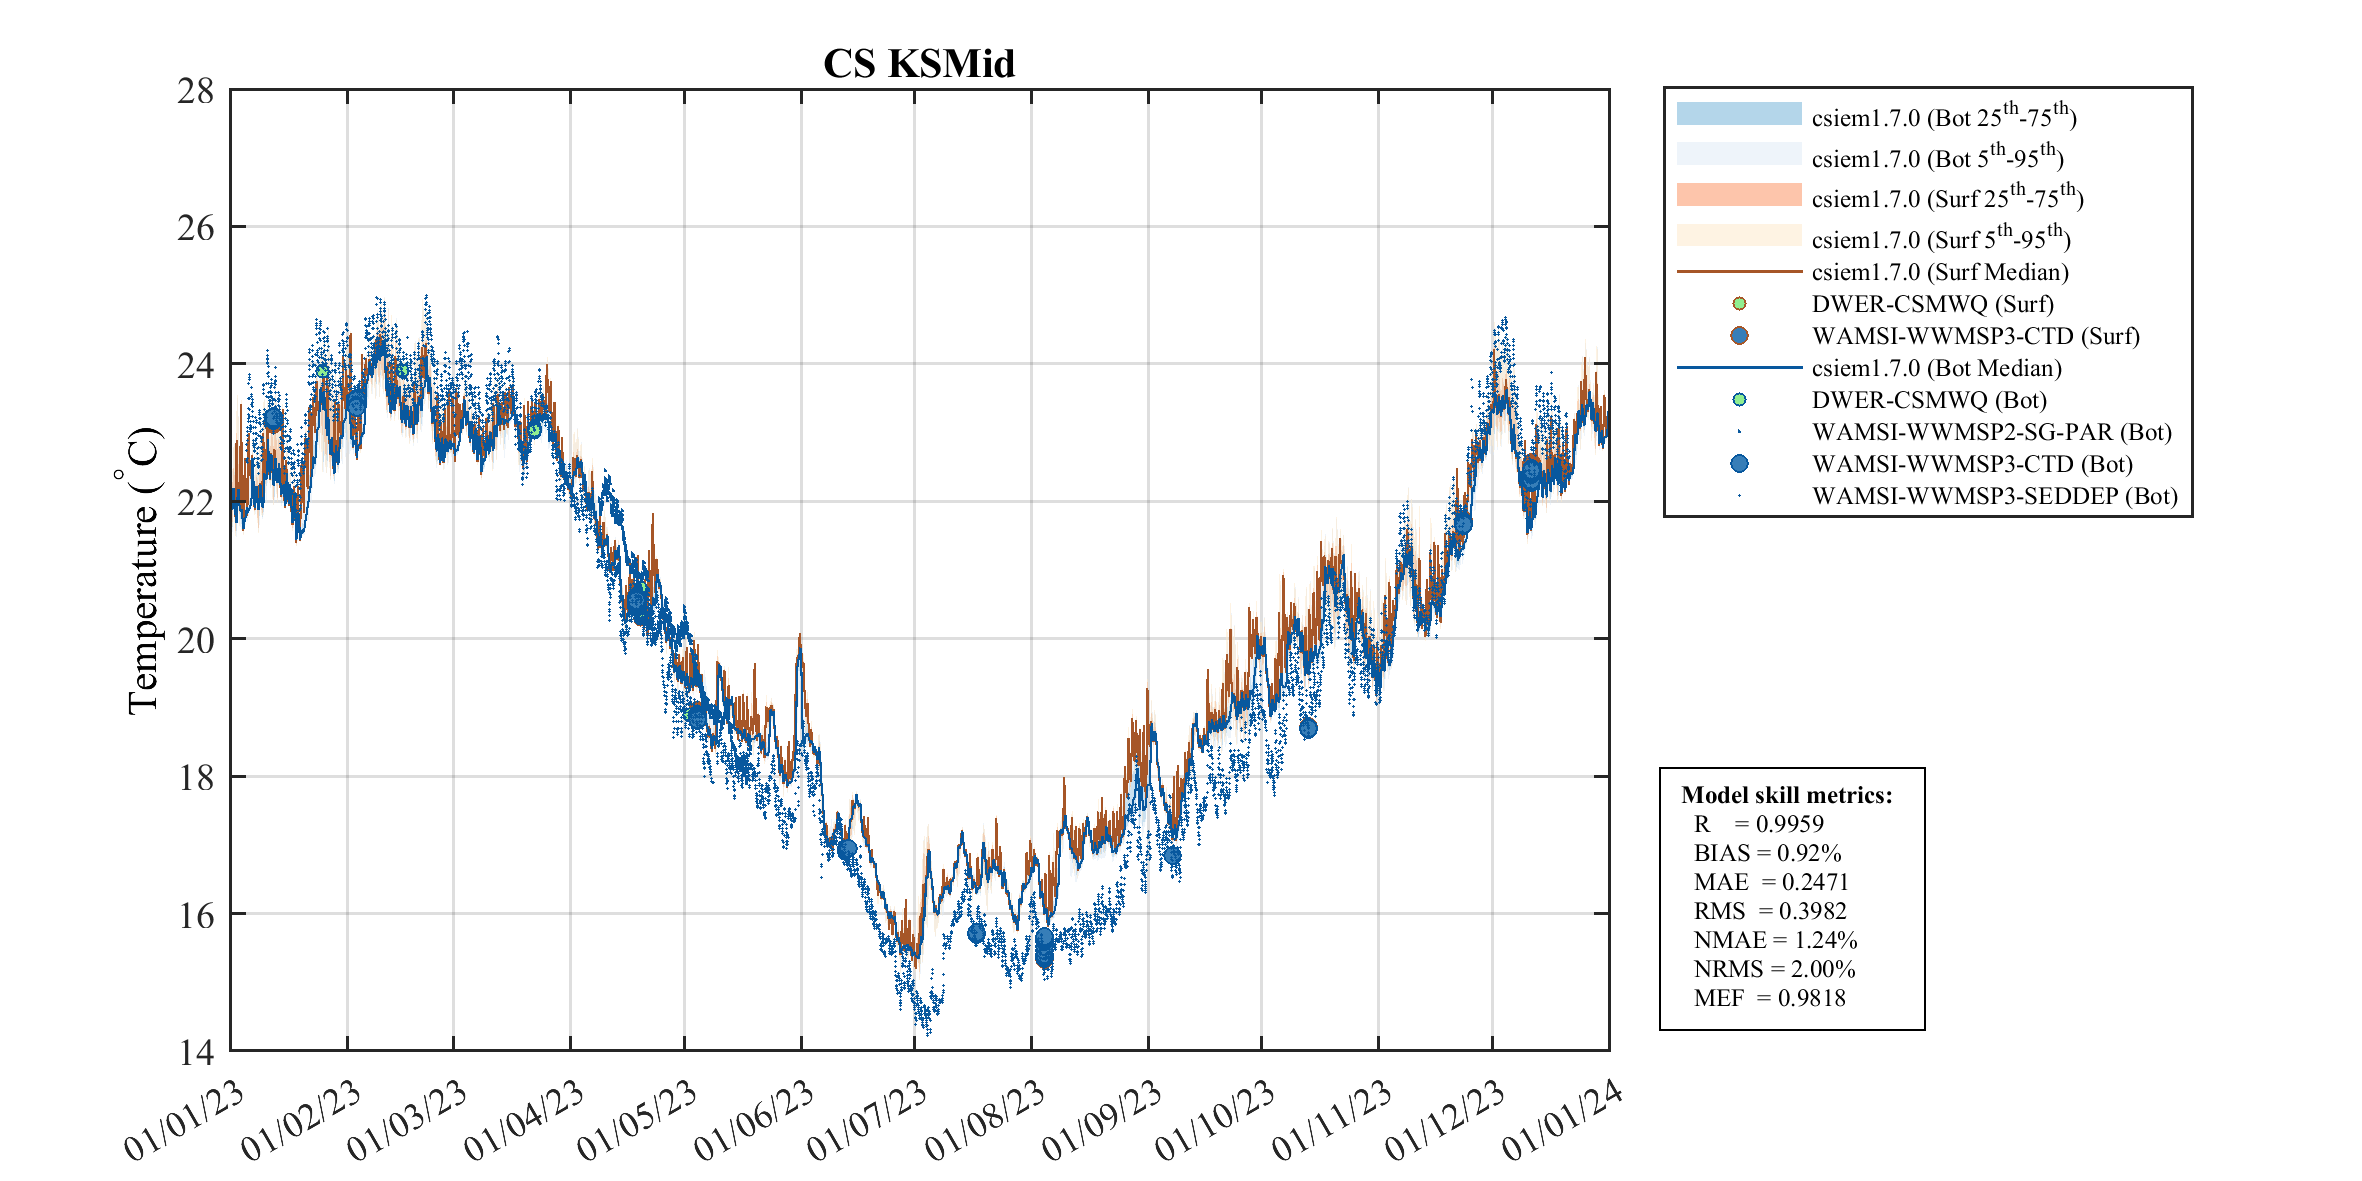
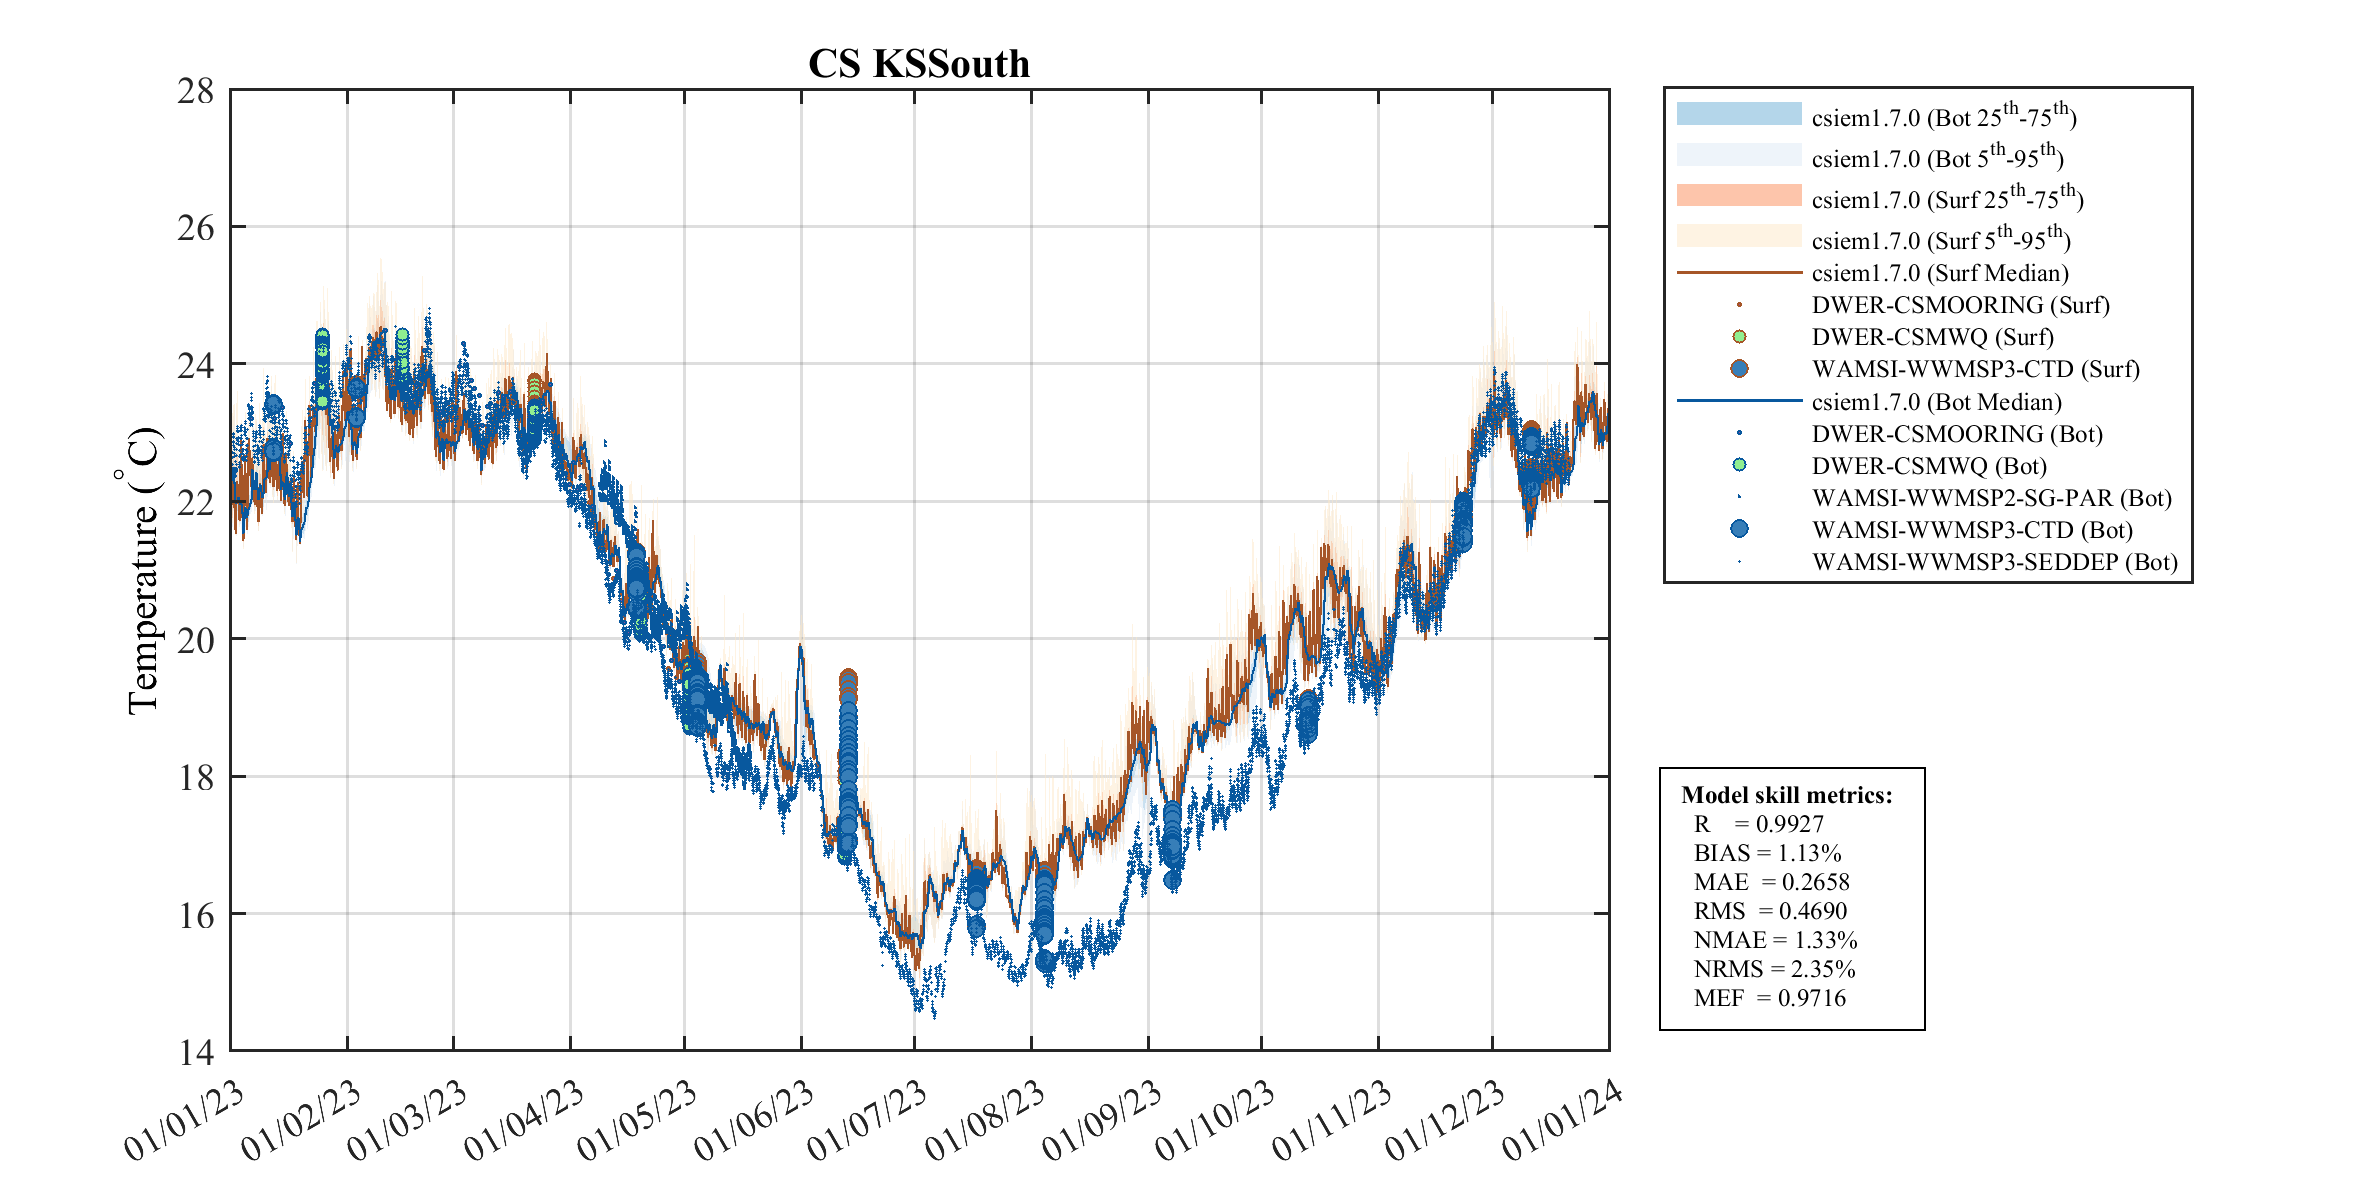
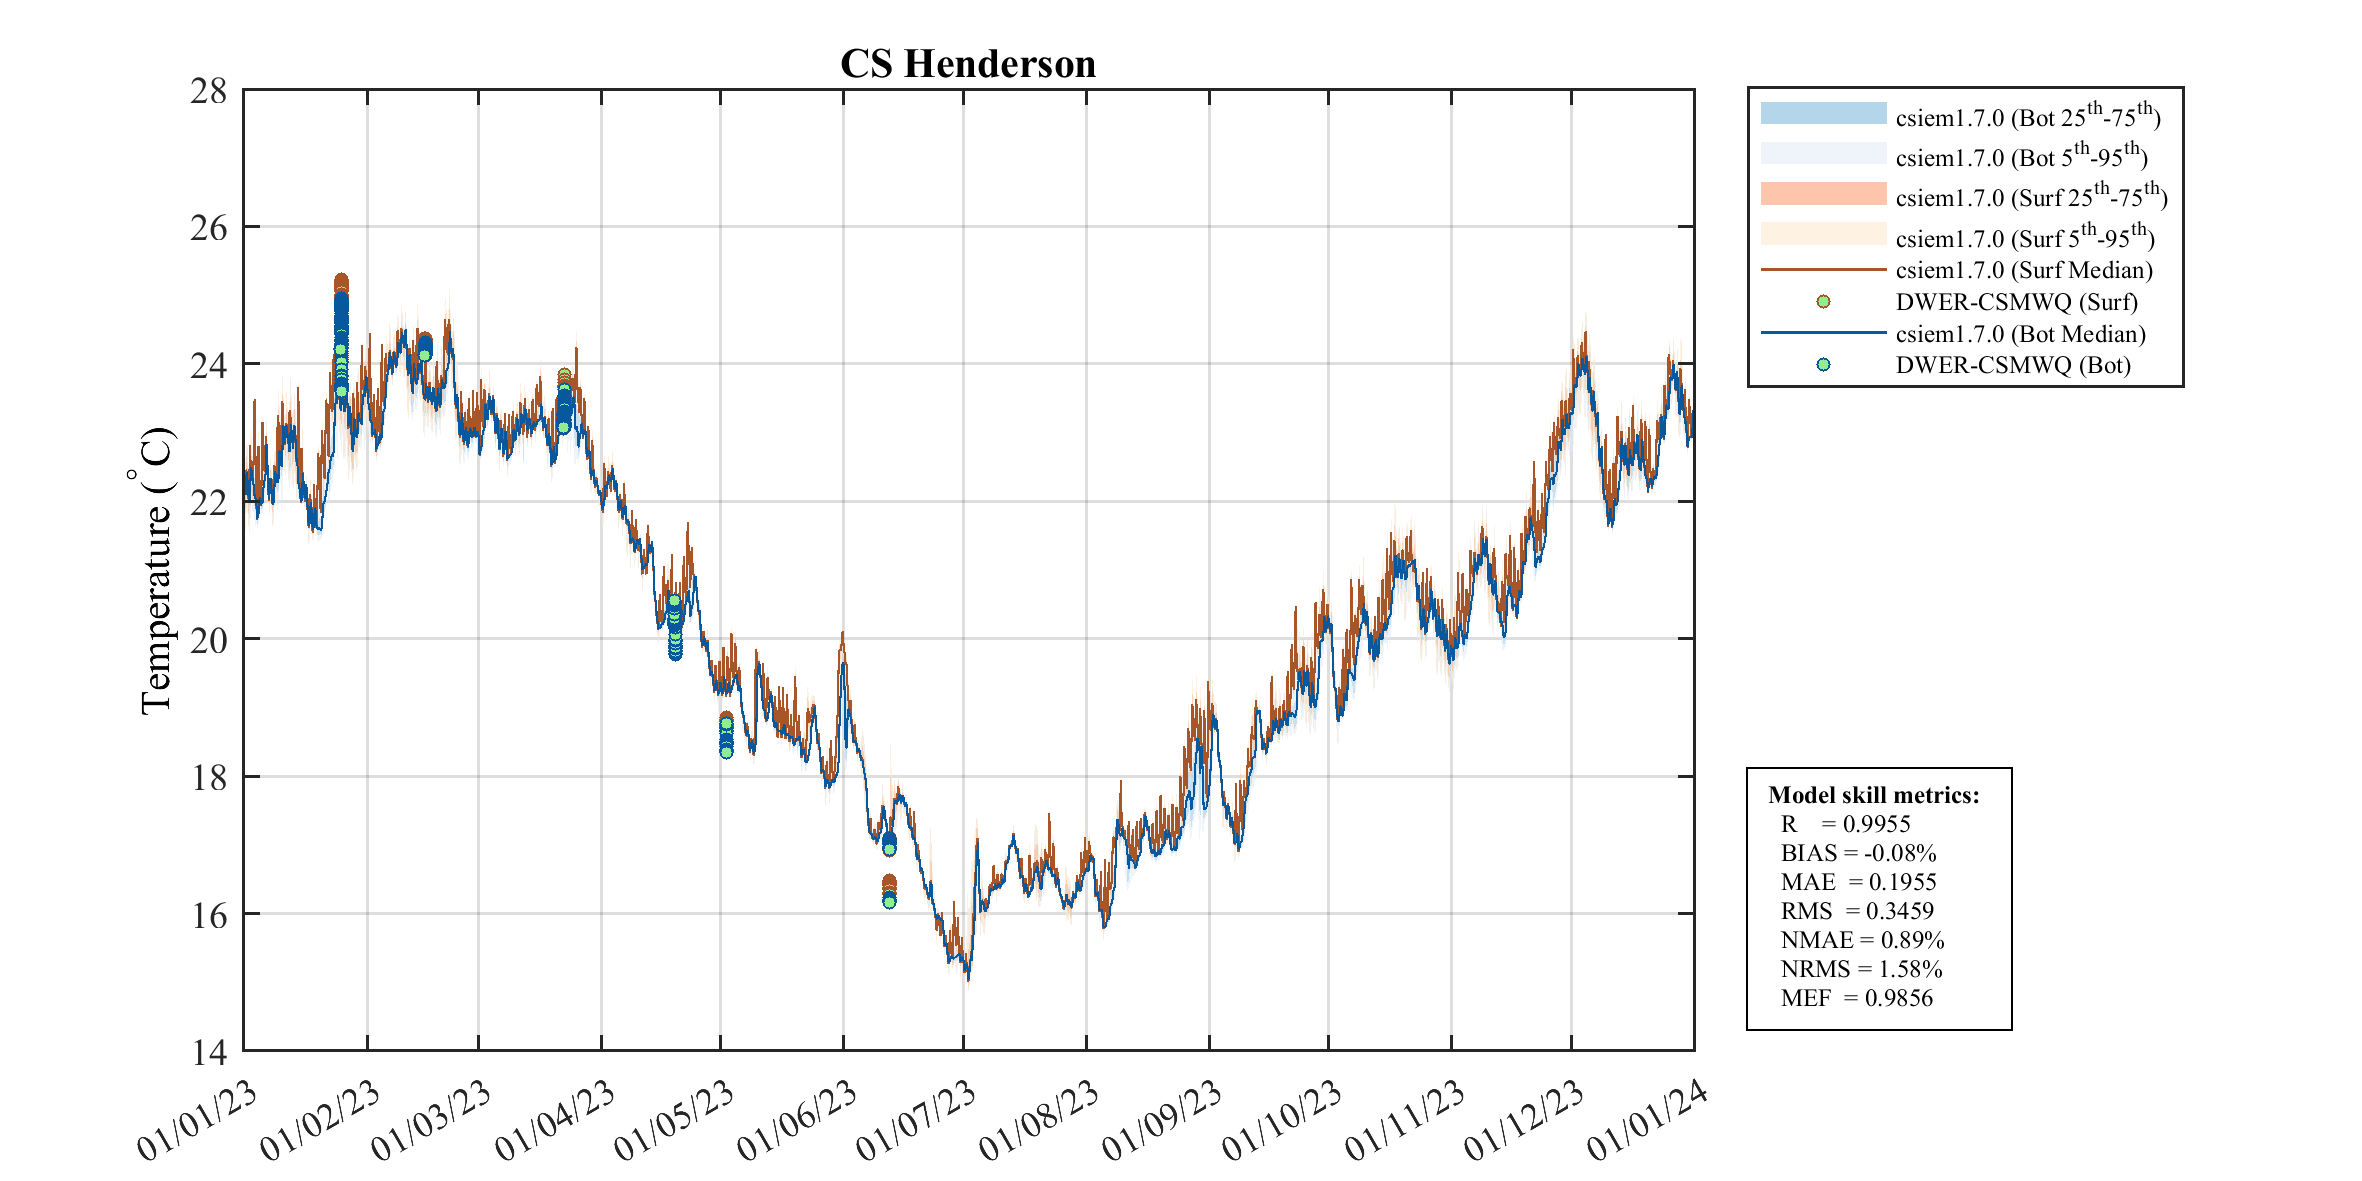
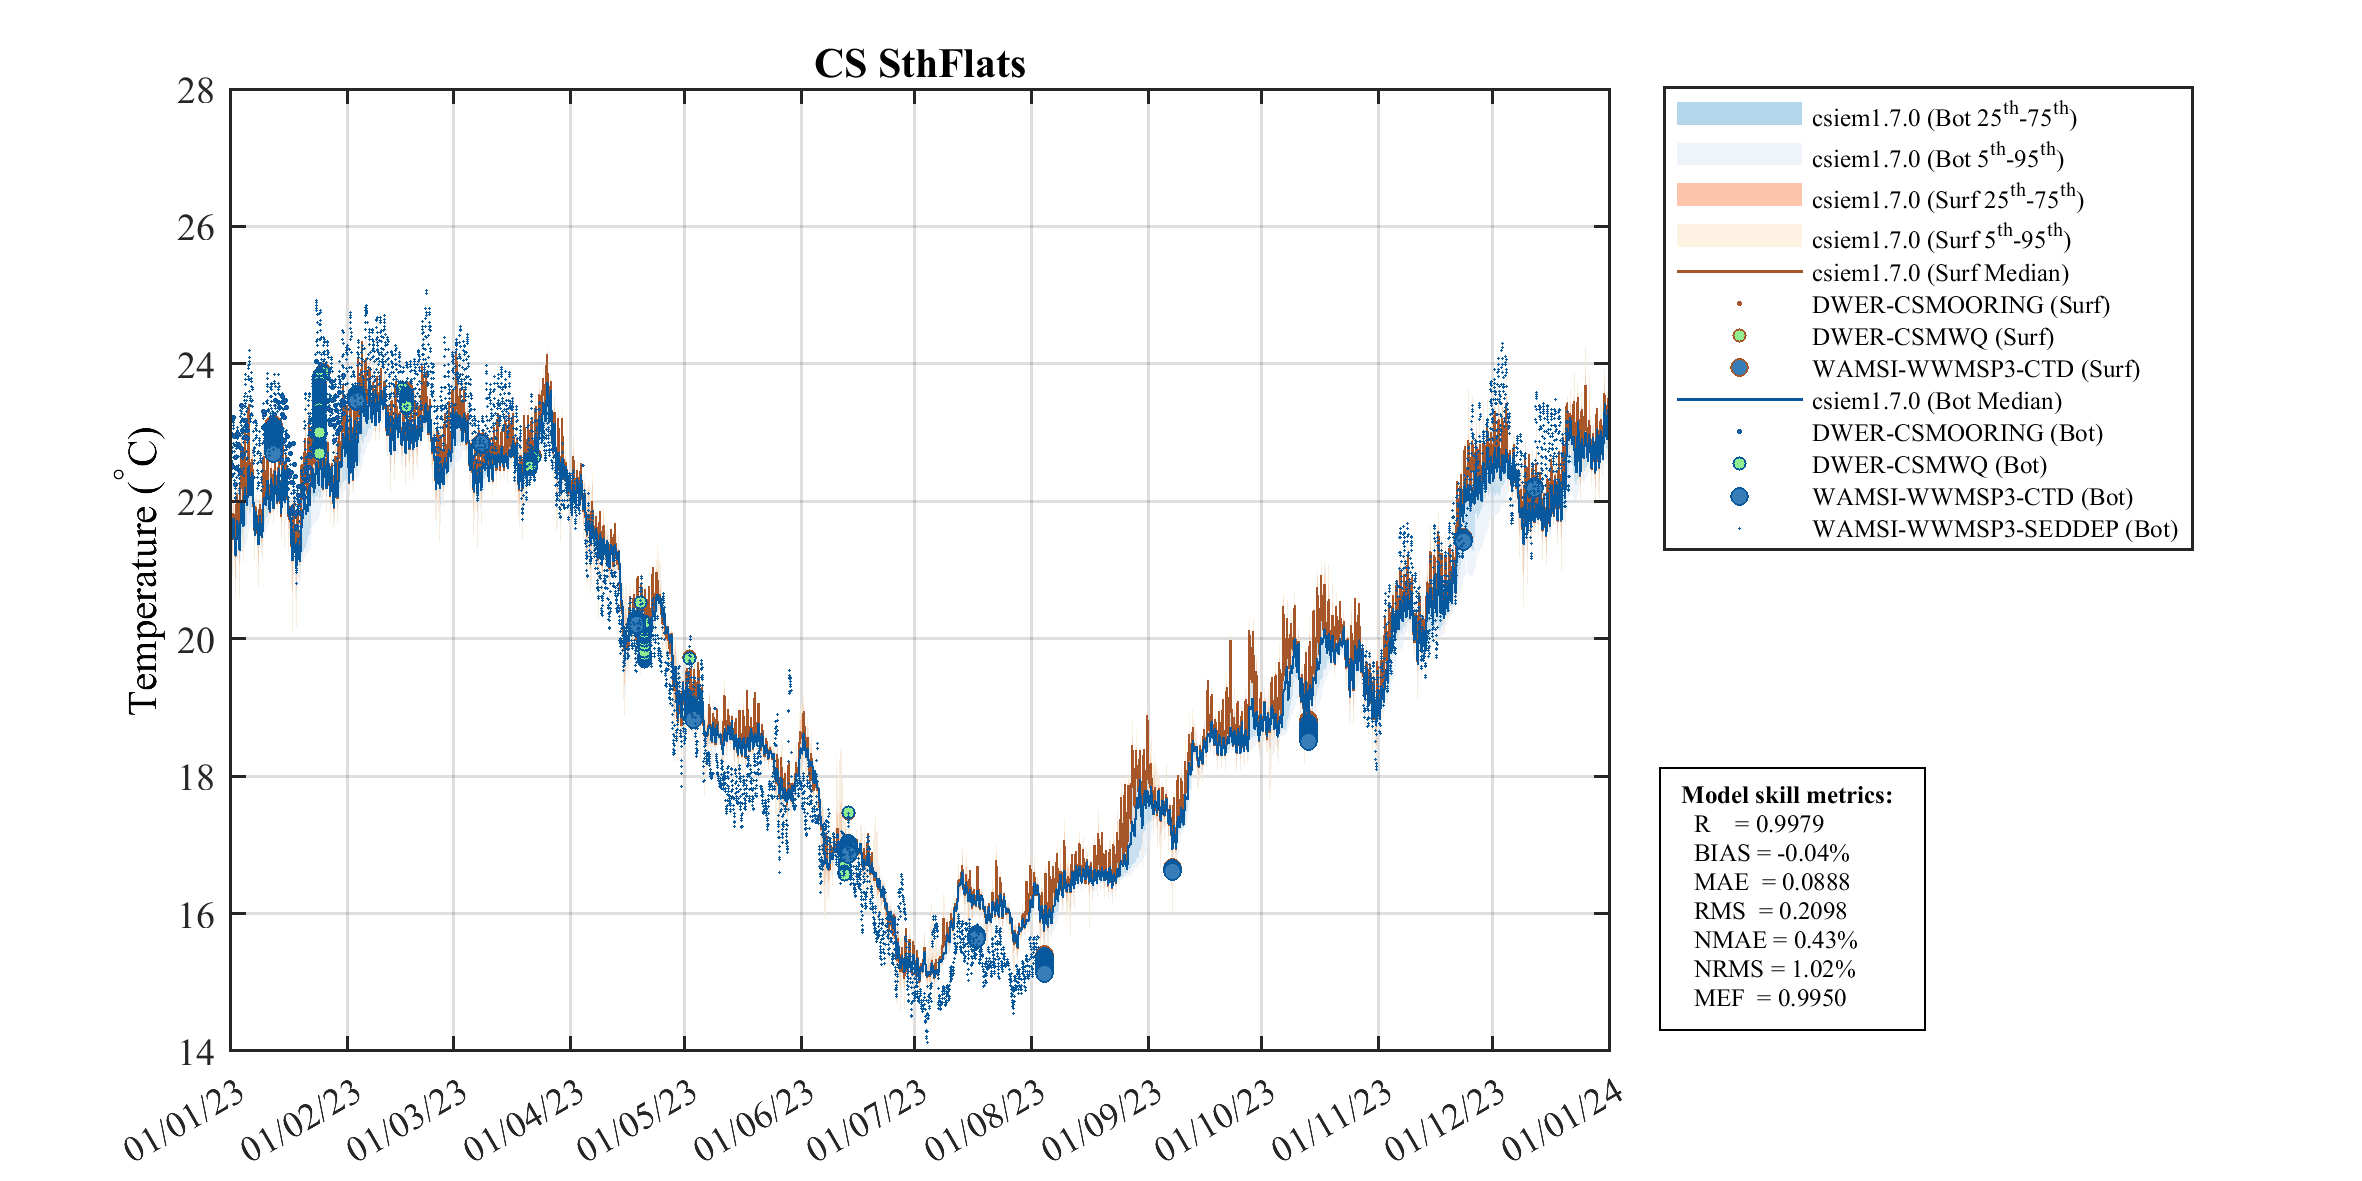
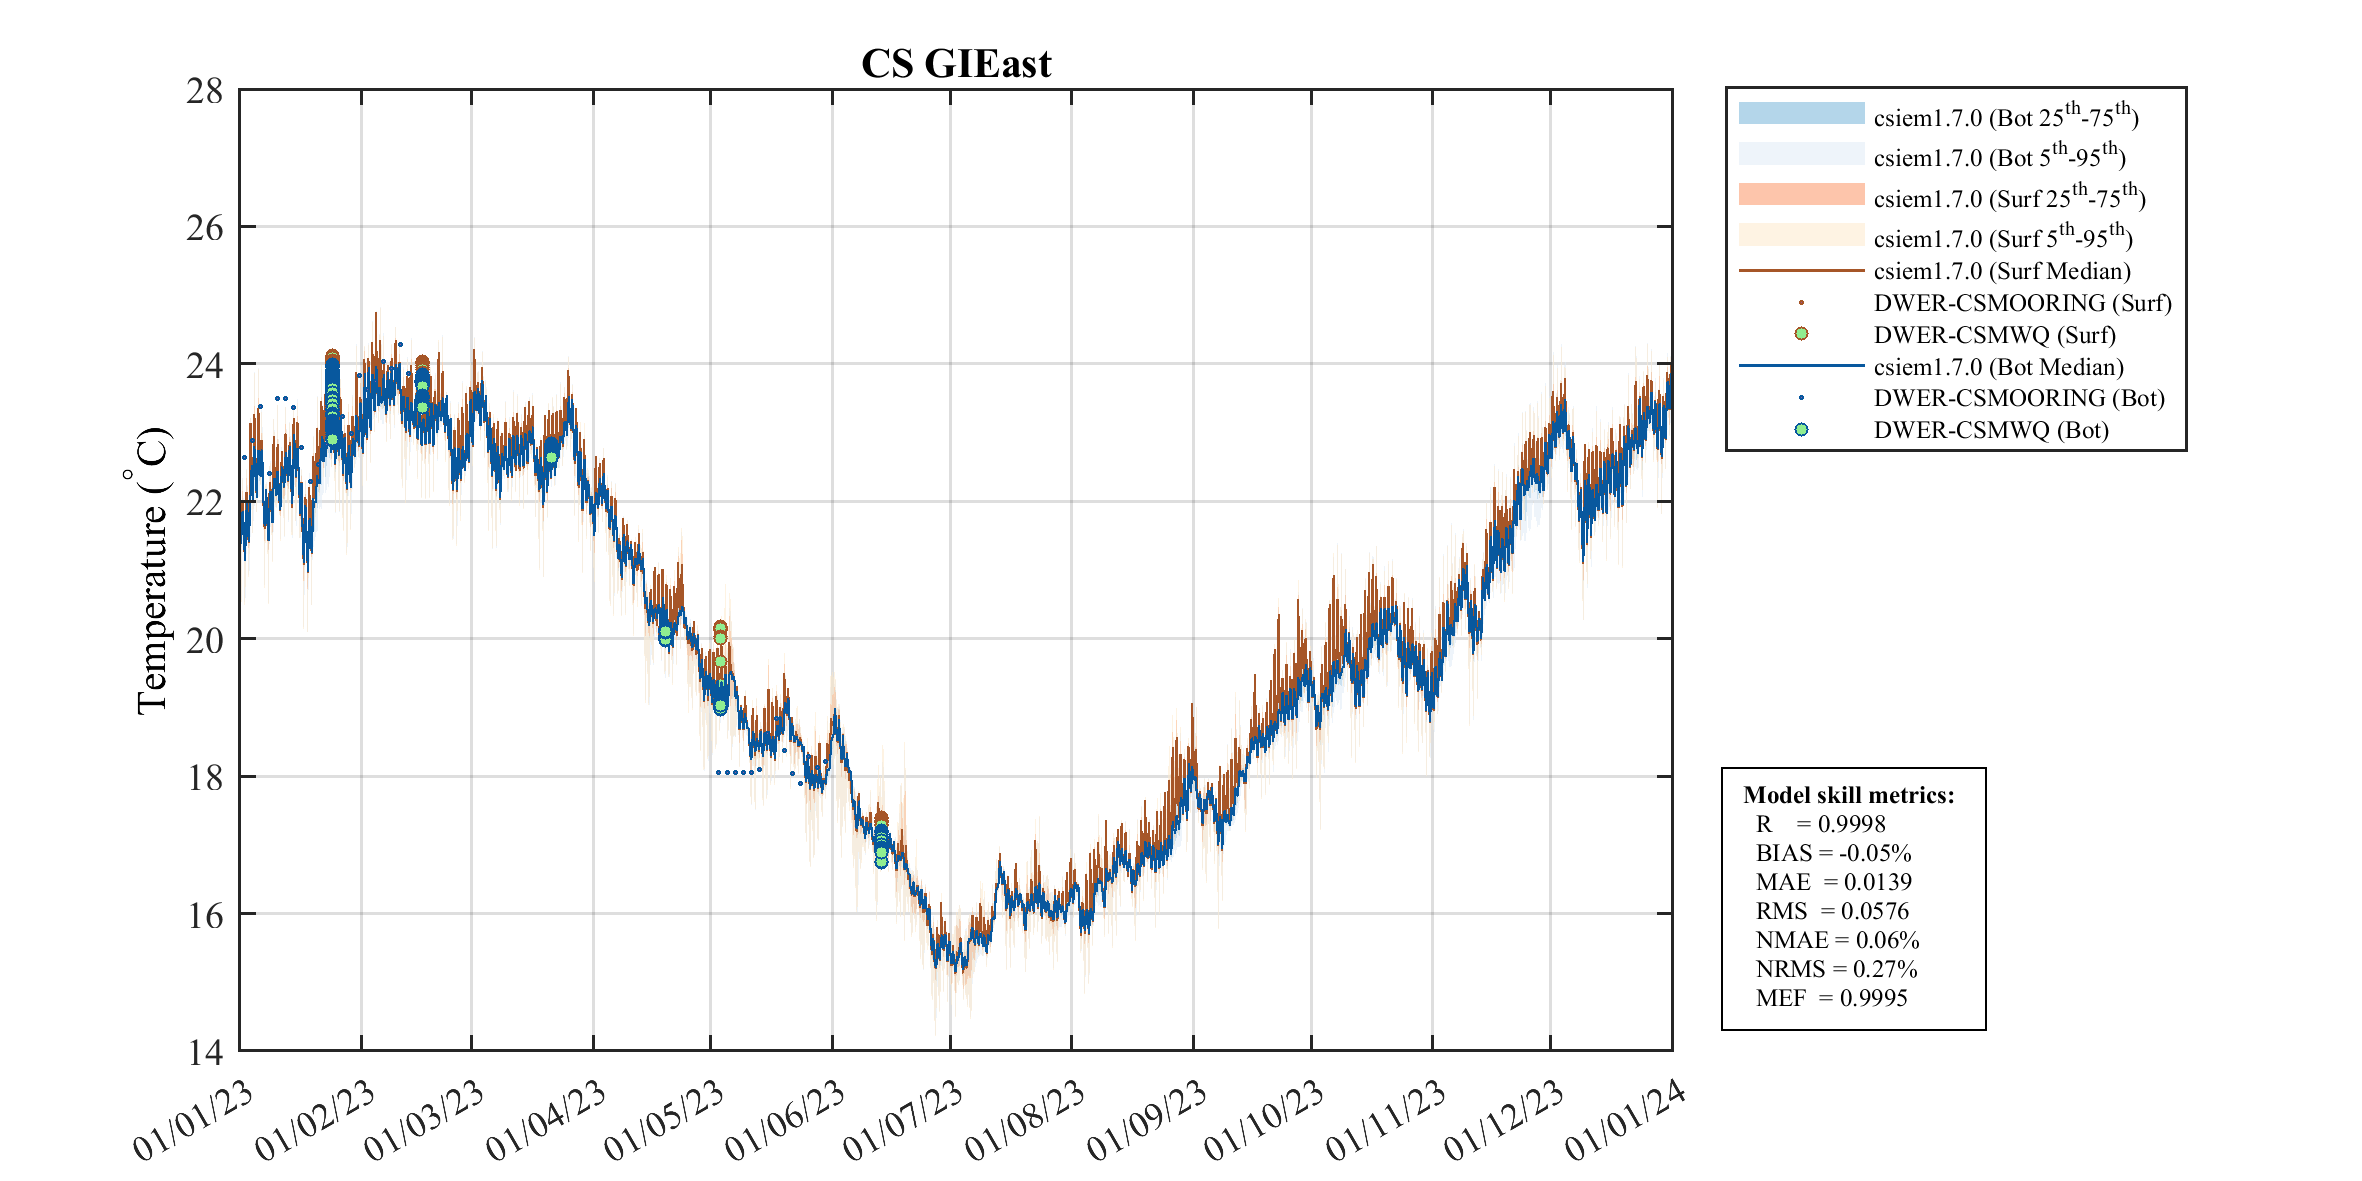
Cockburn Sound
Assessment polygons for Cockburn Sound
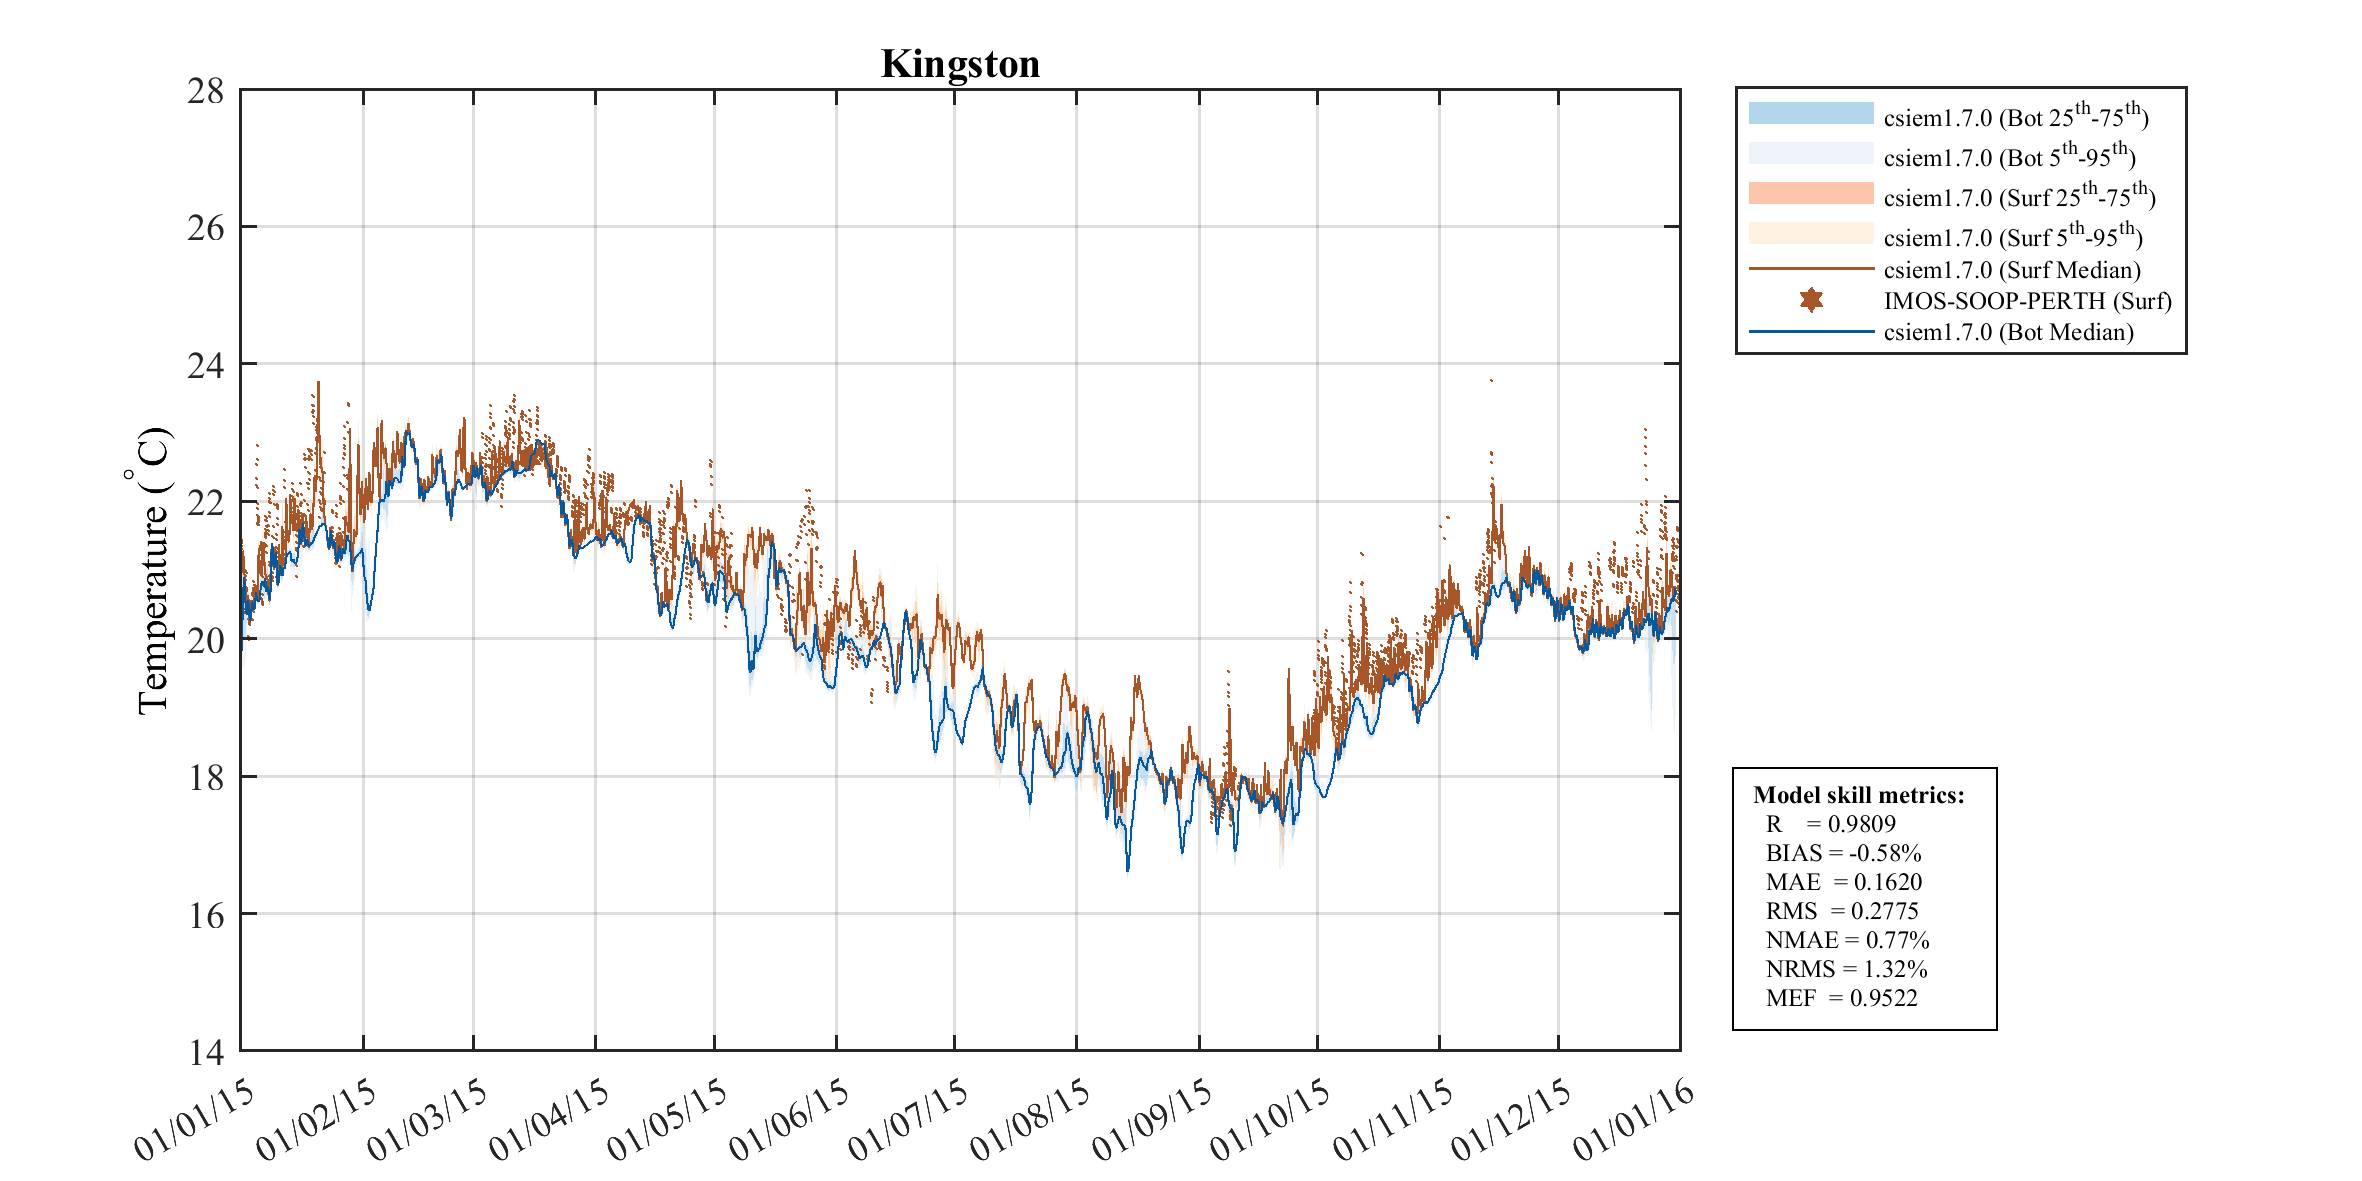
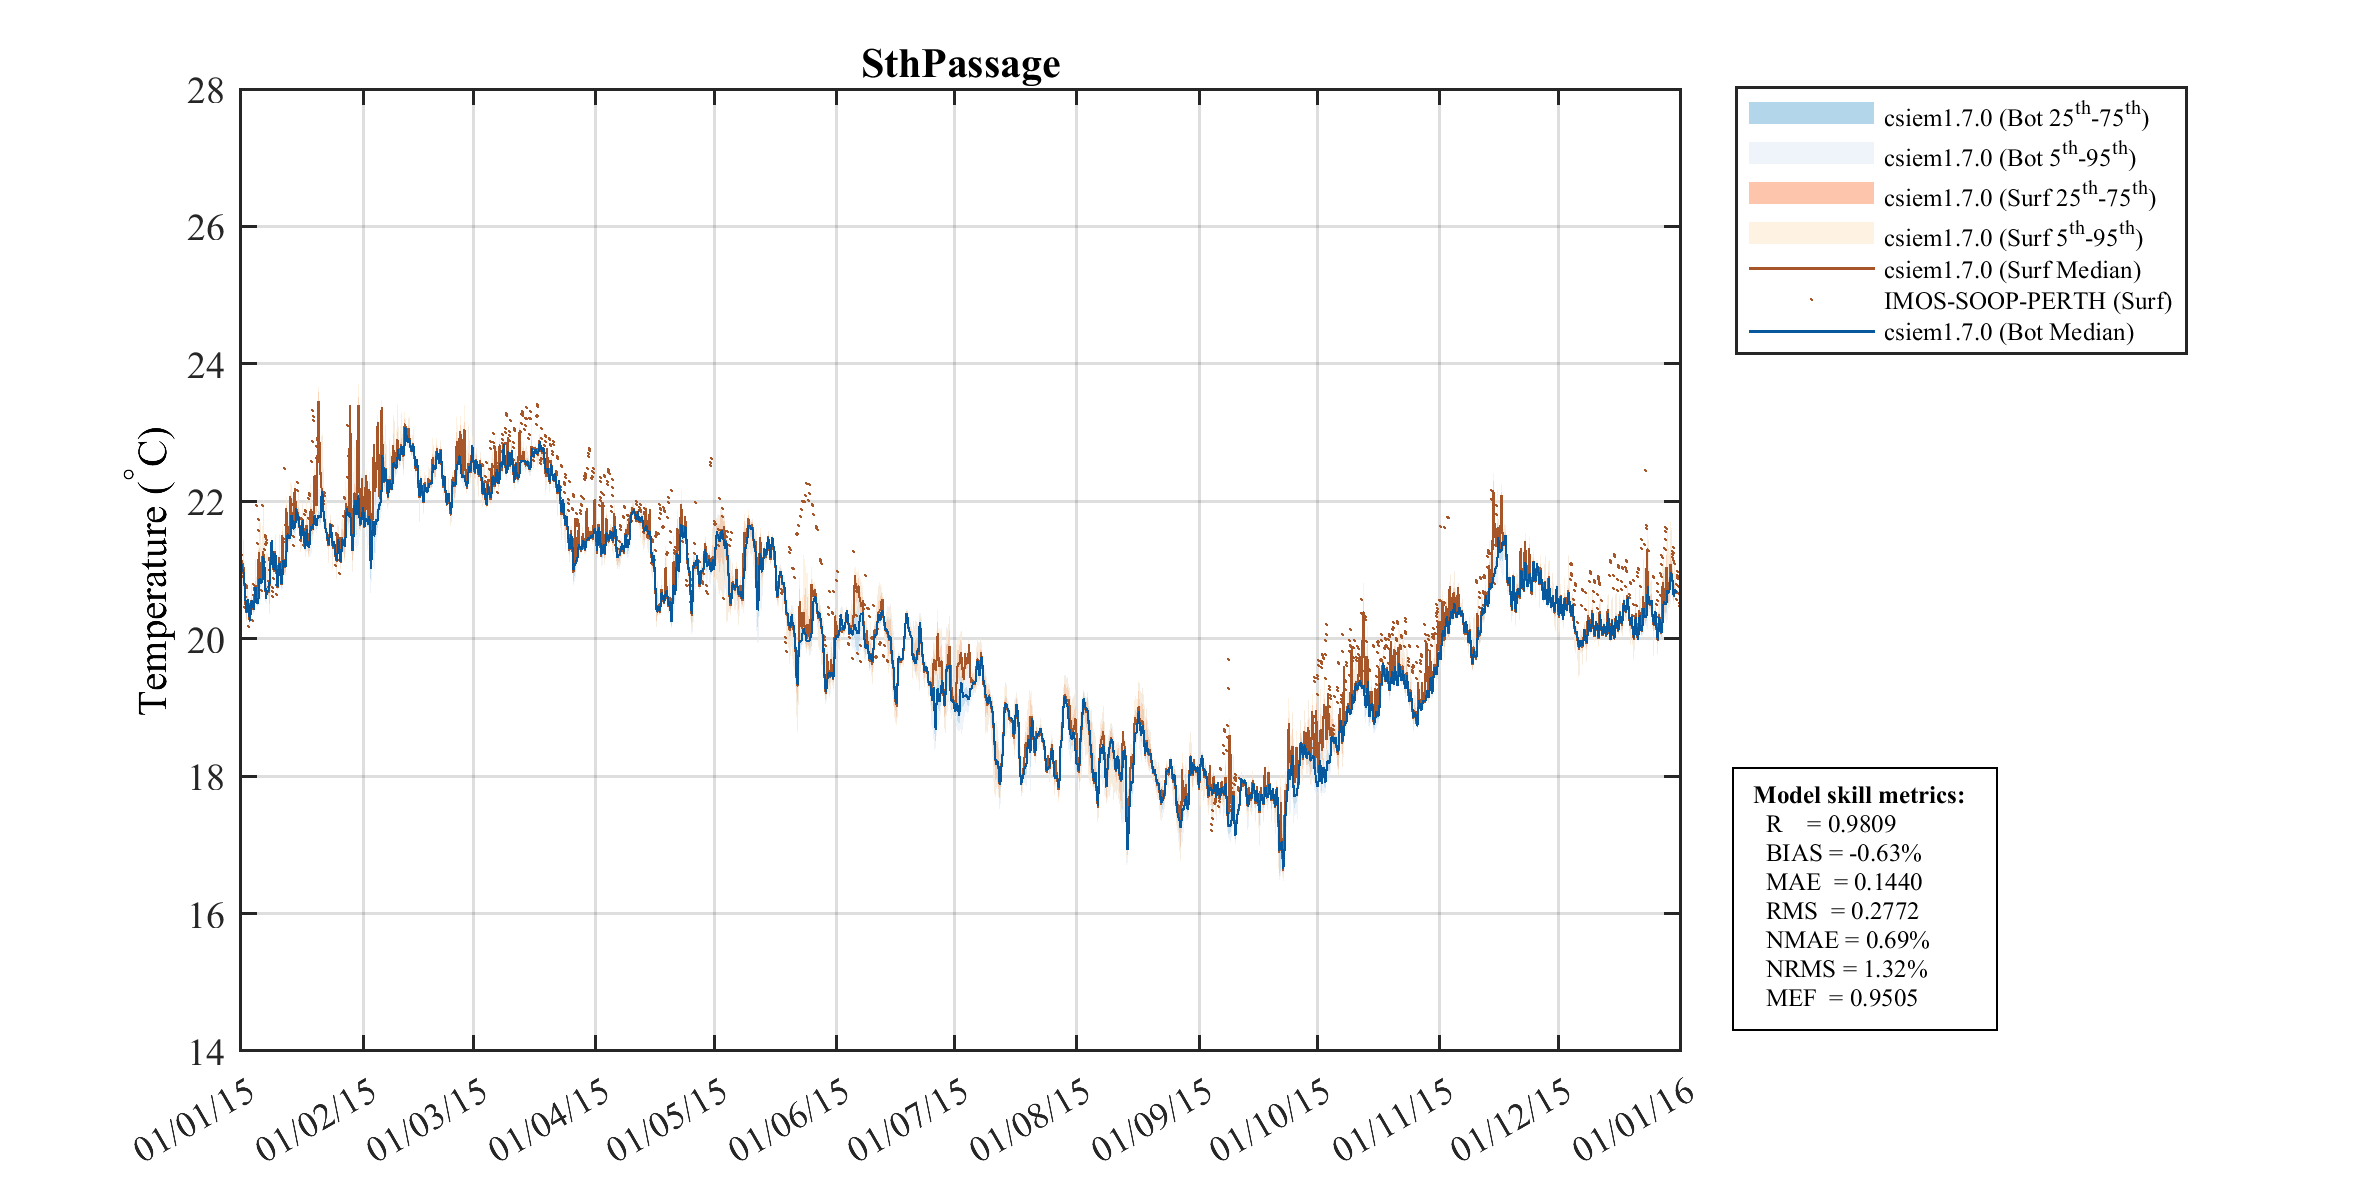
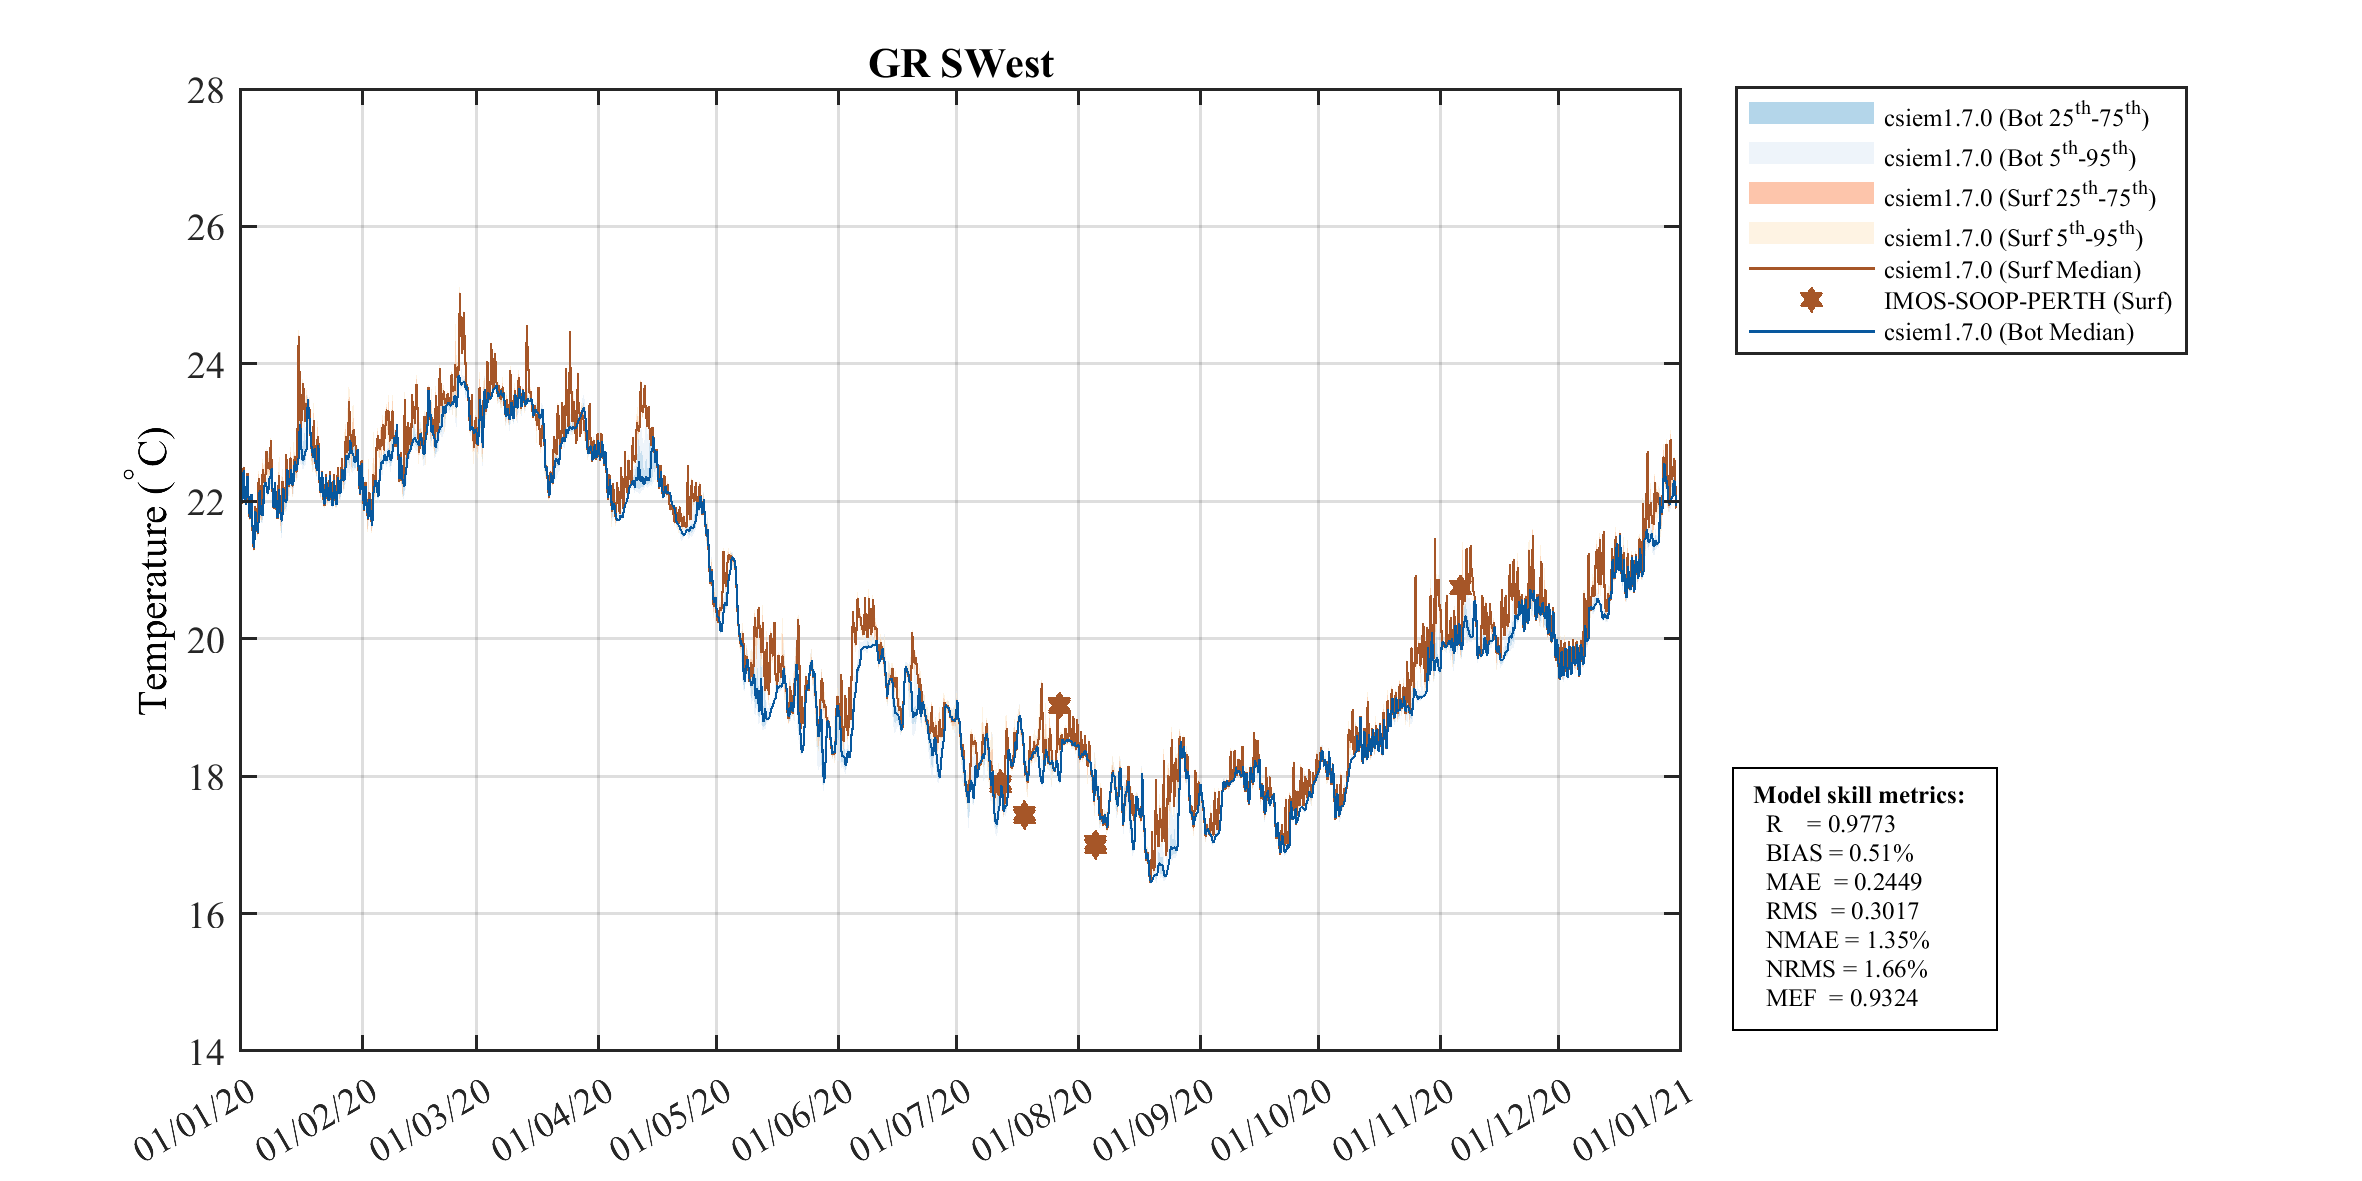
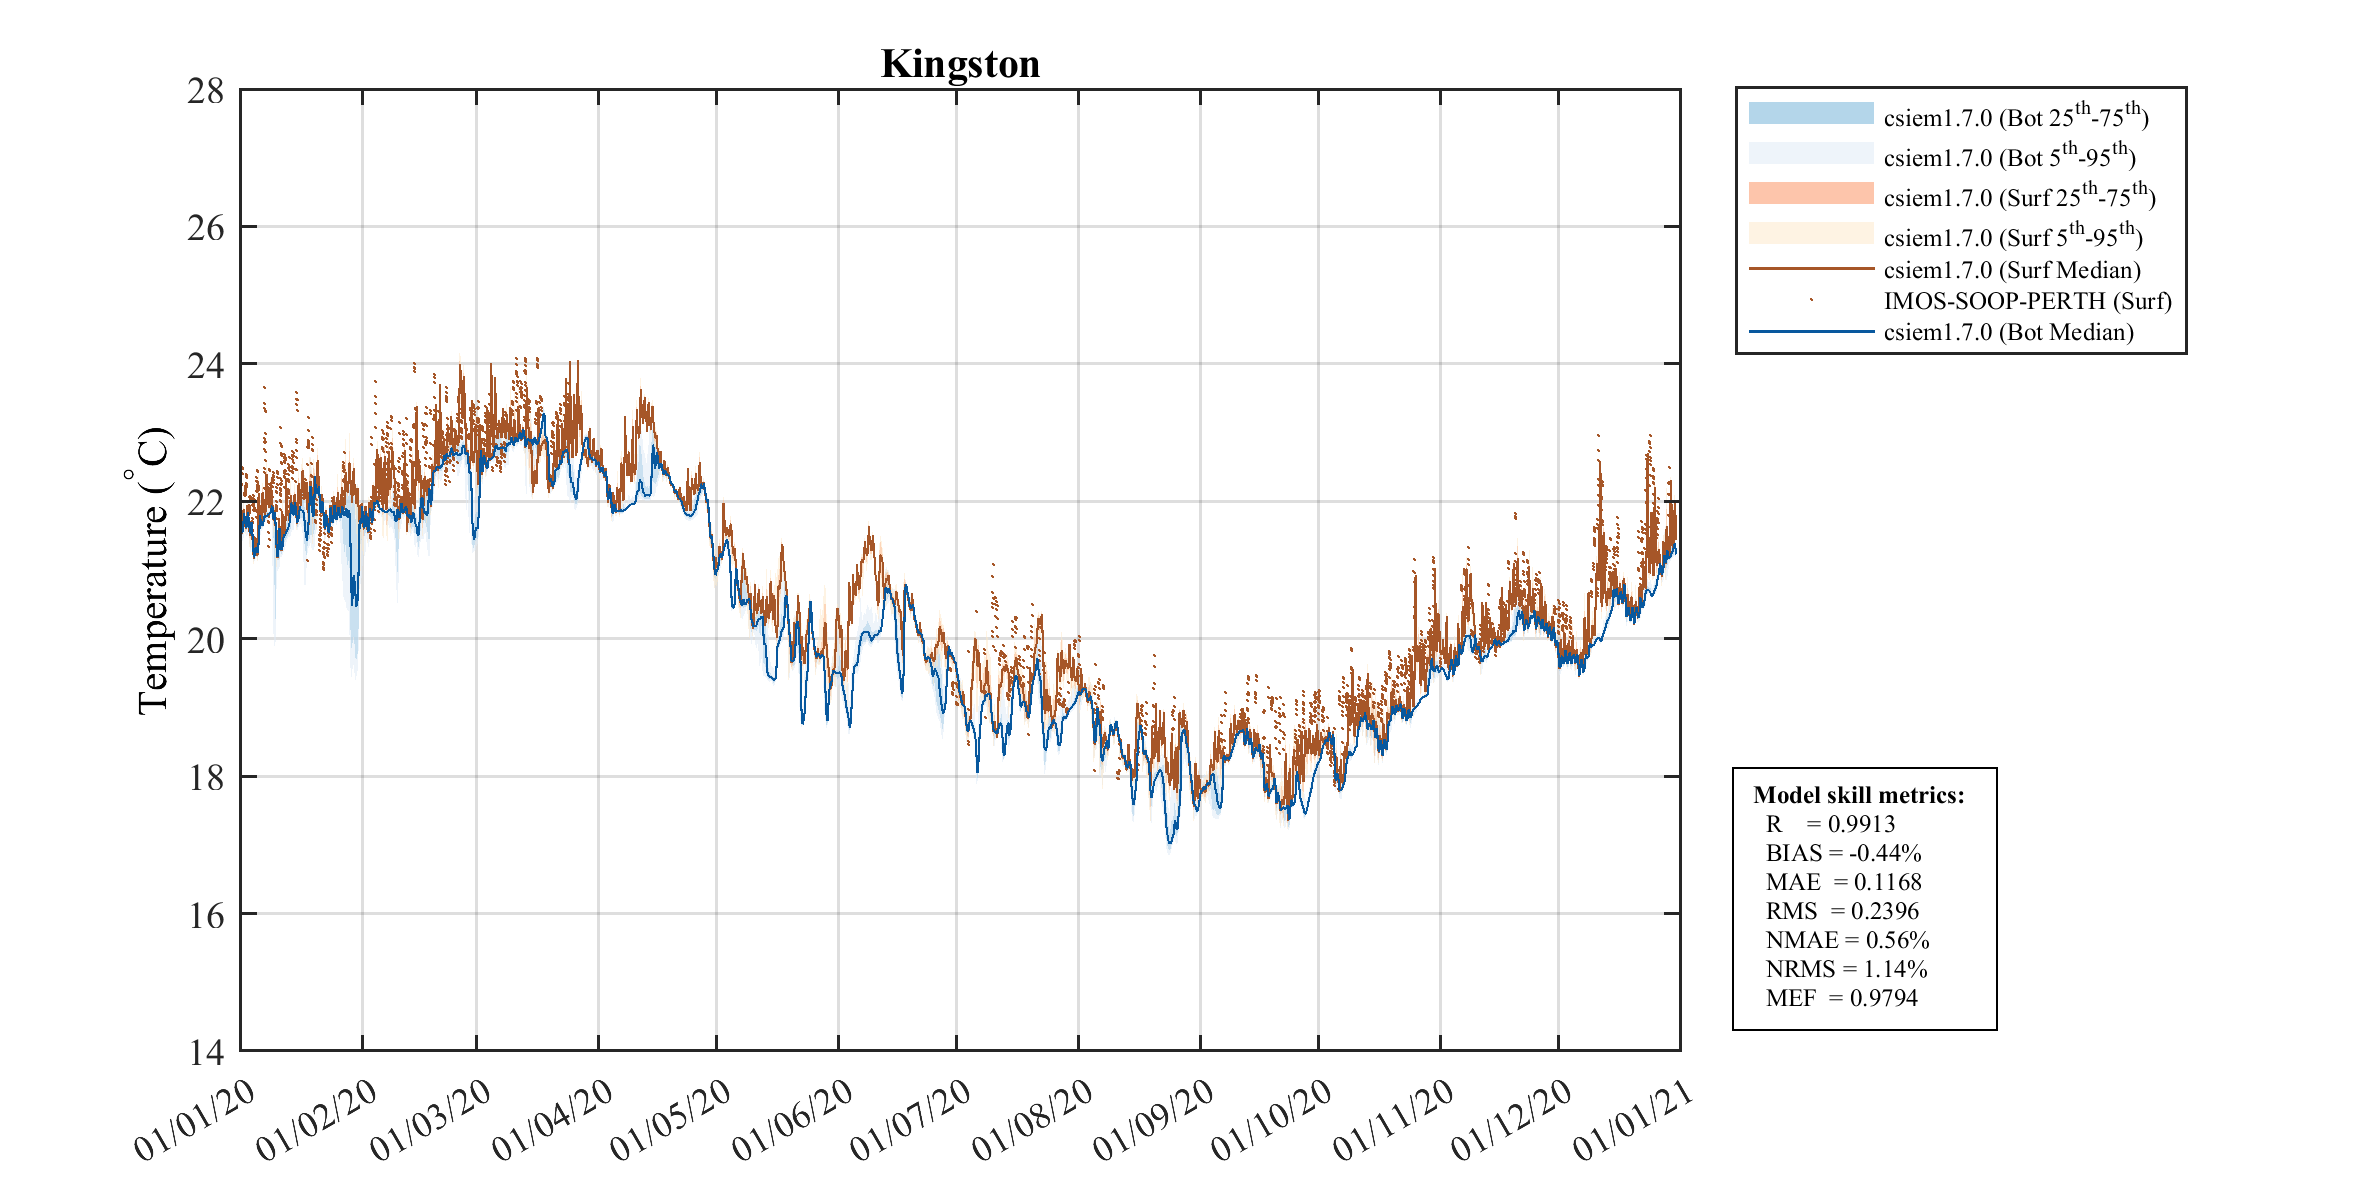
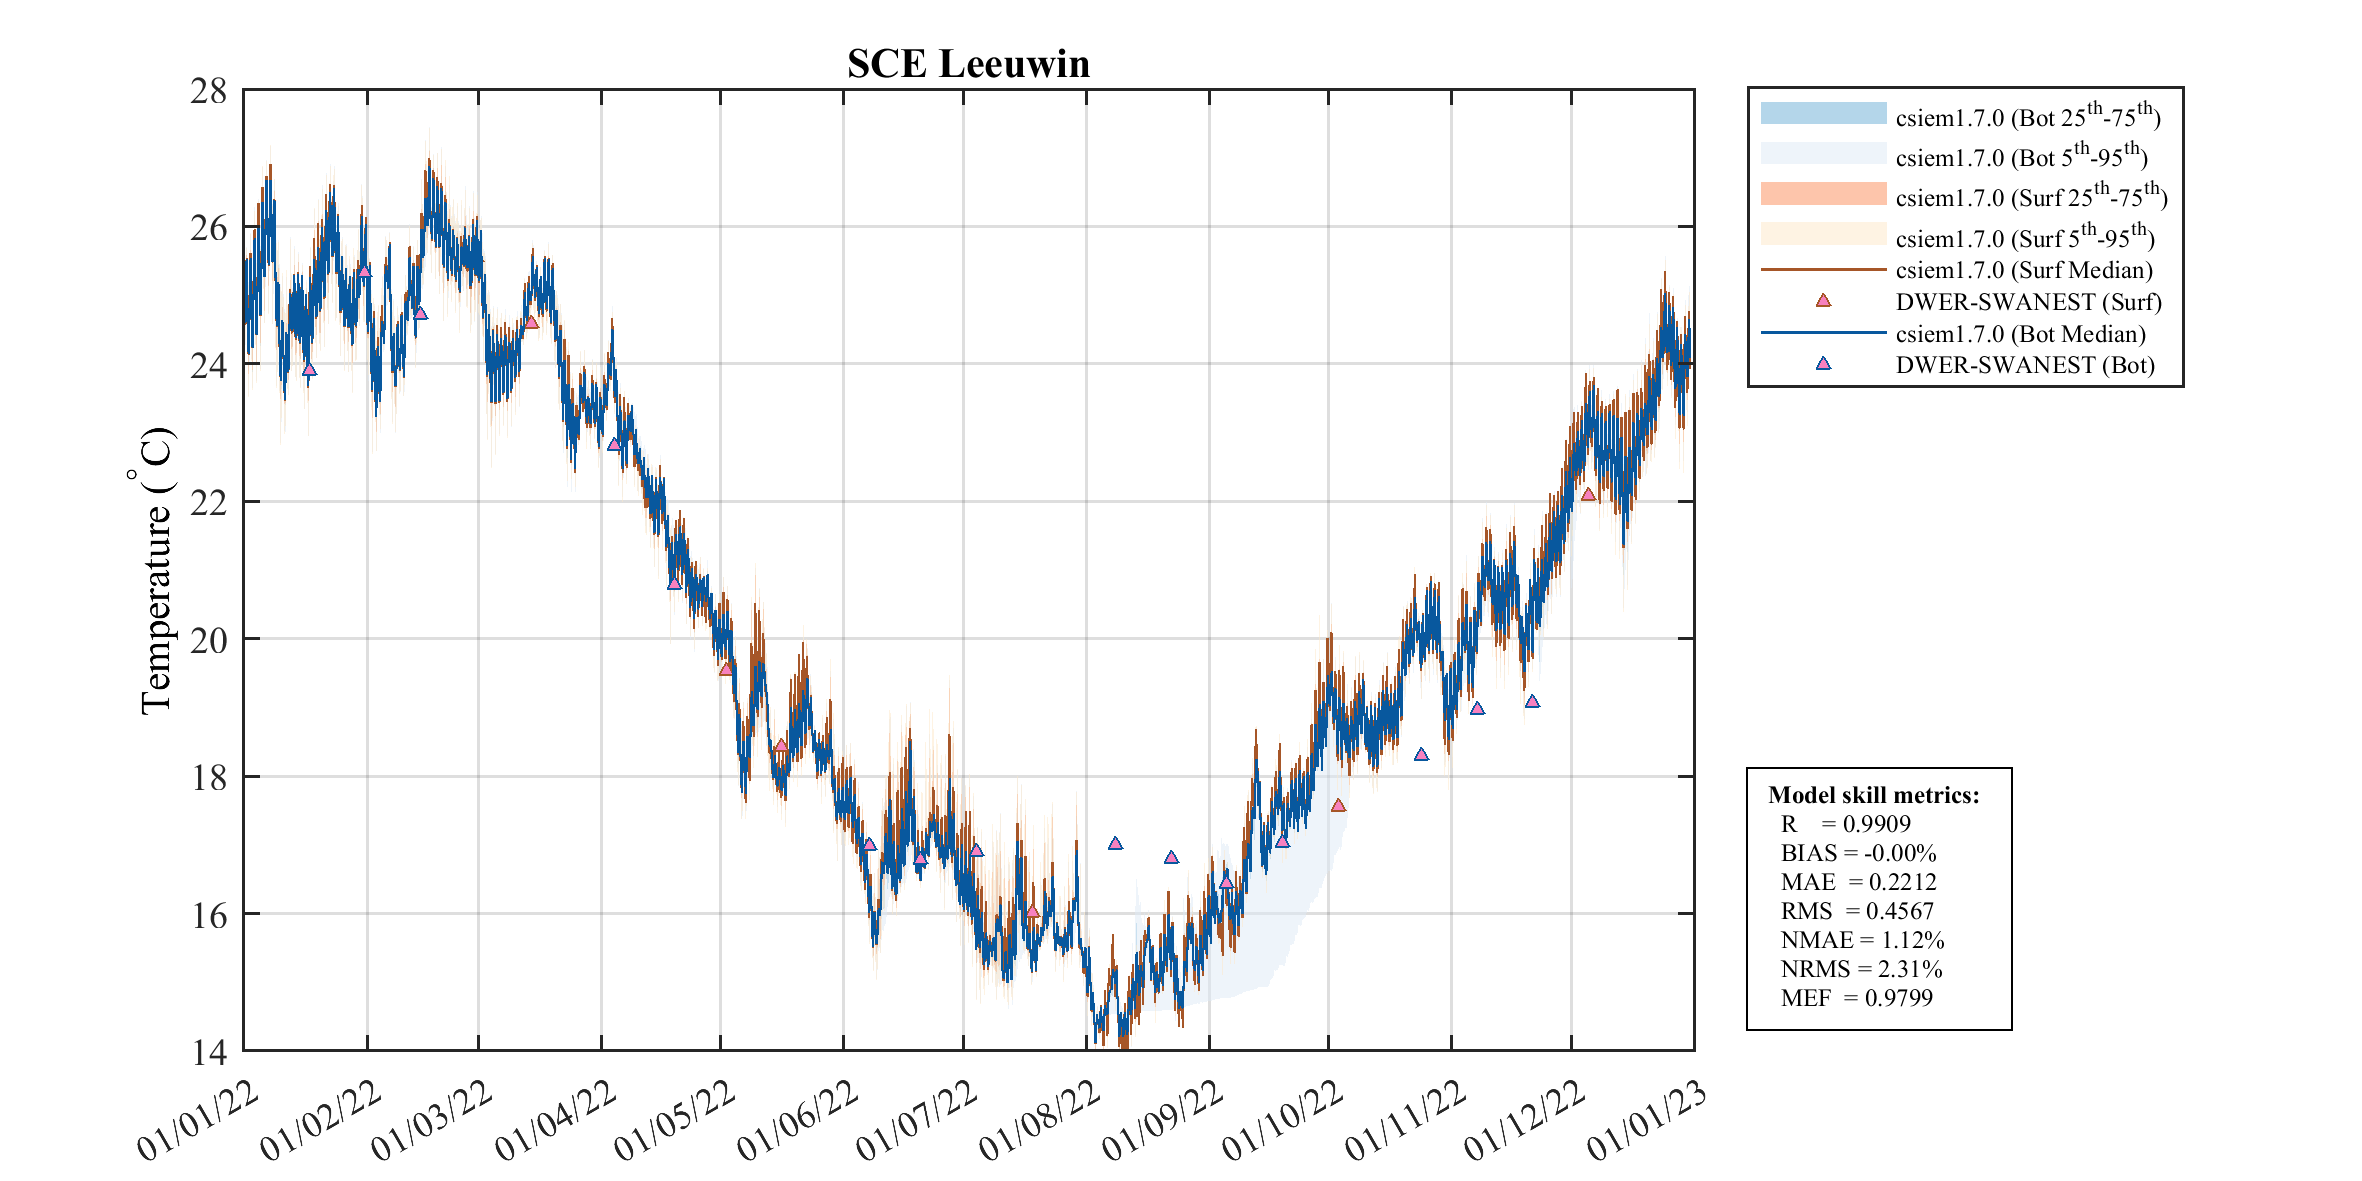
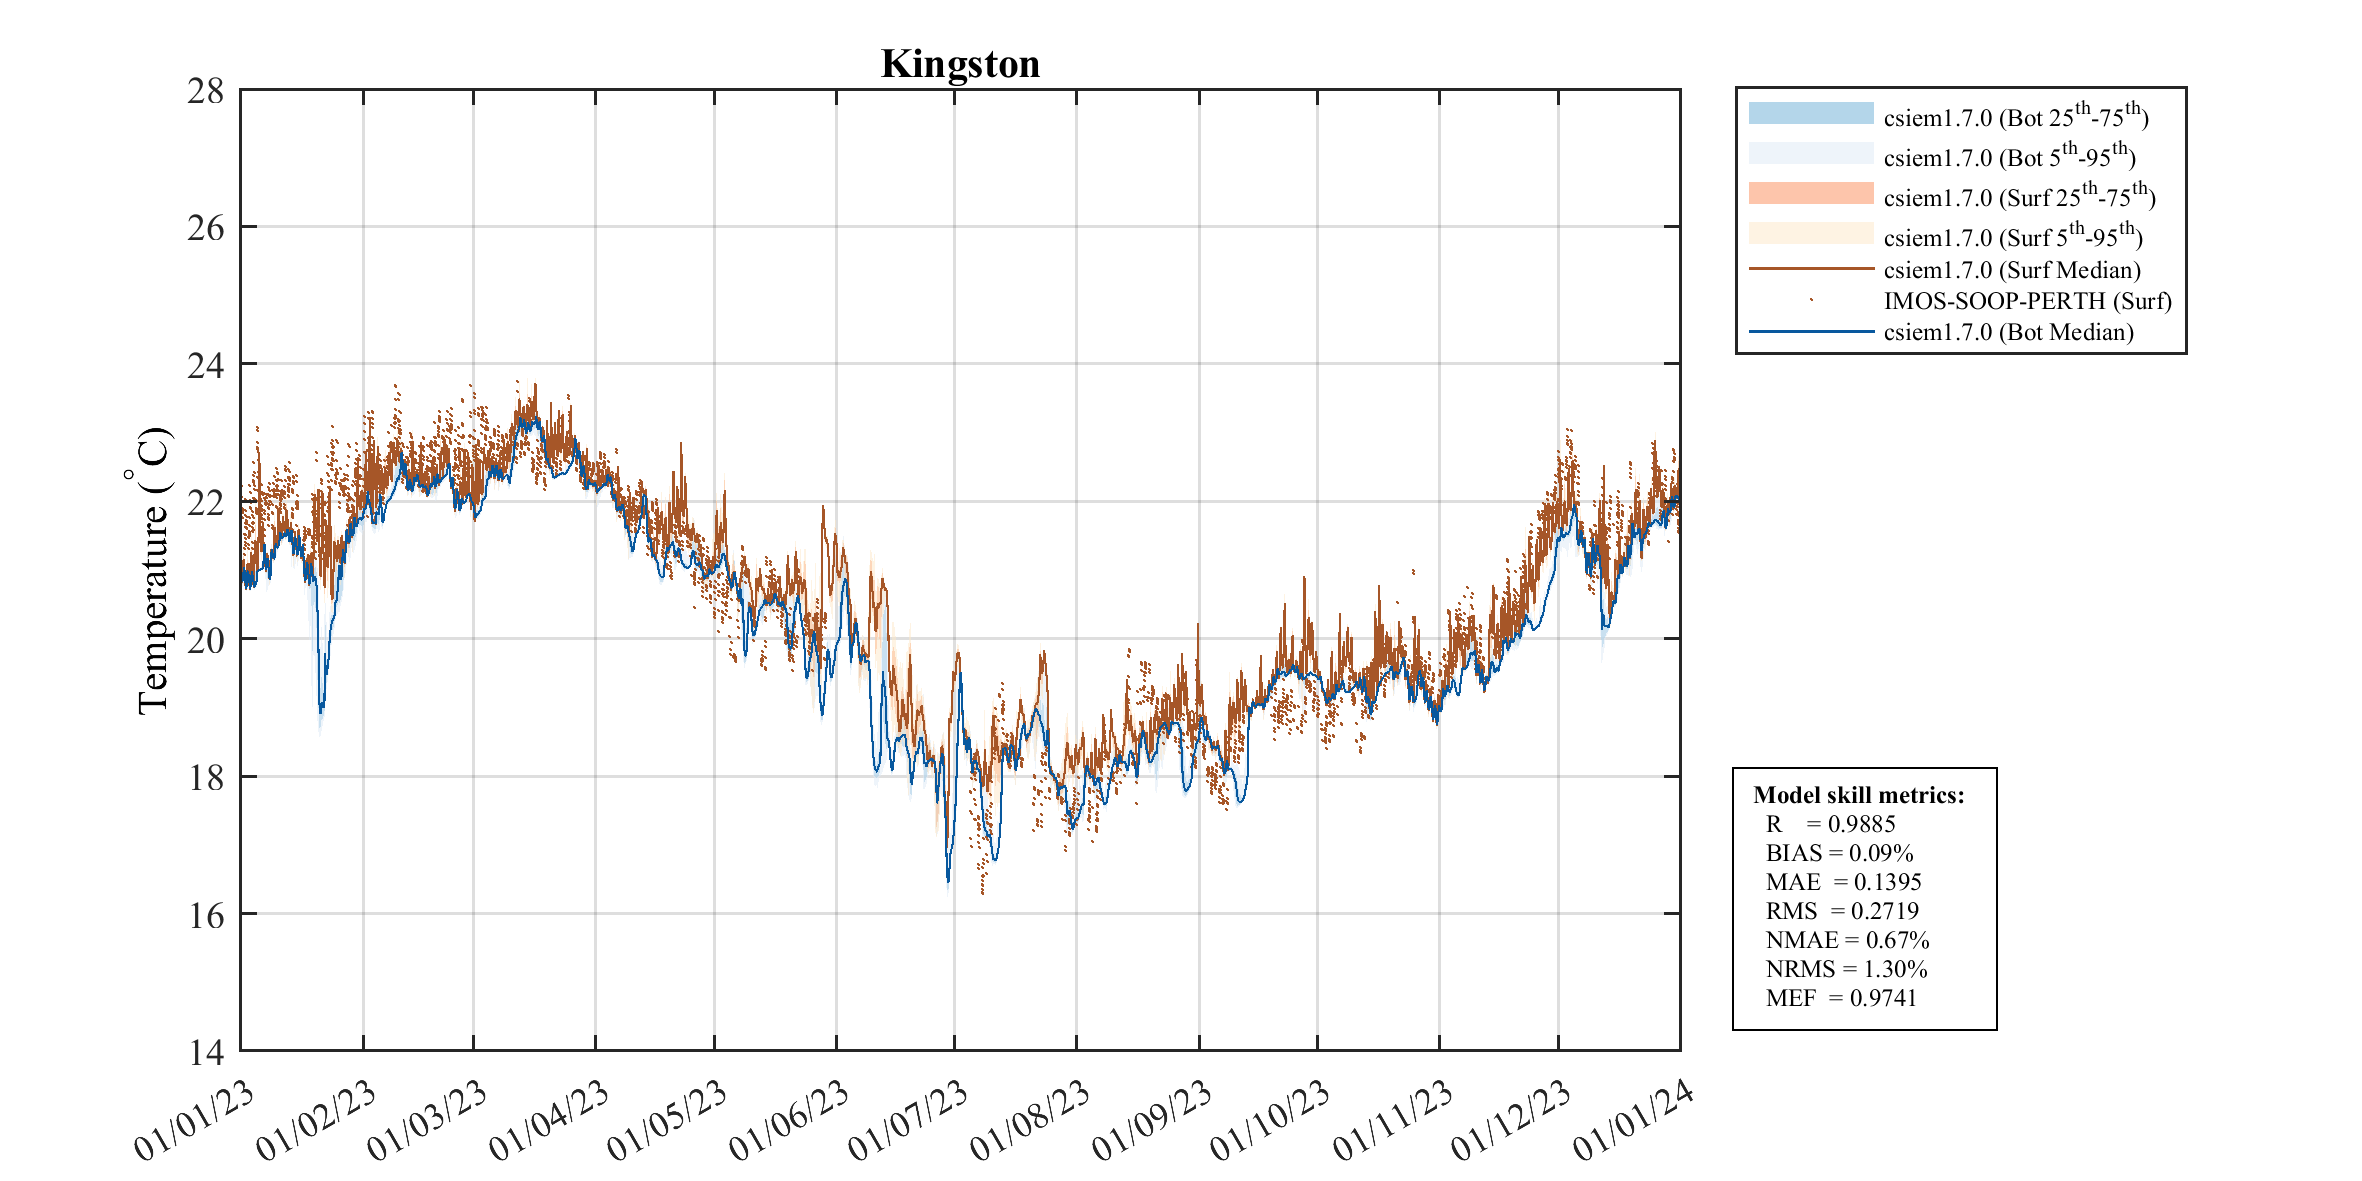
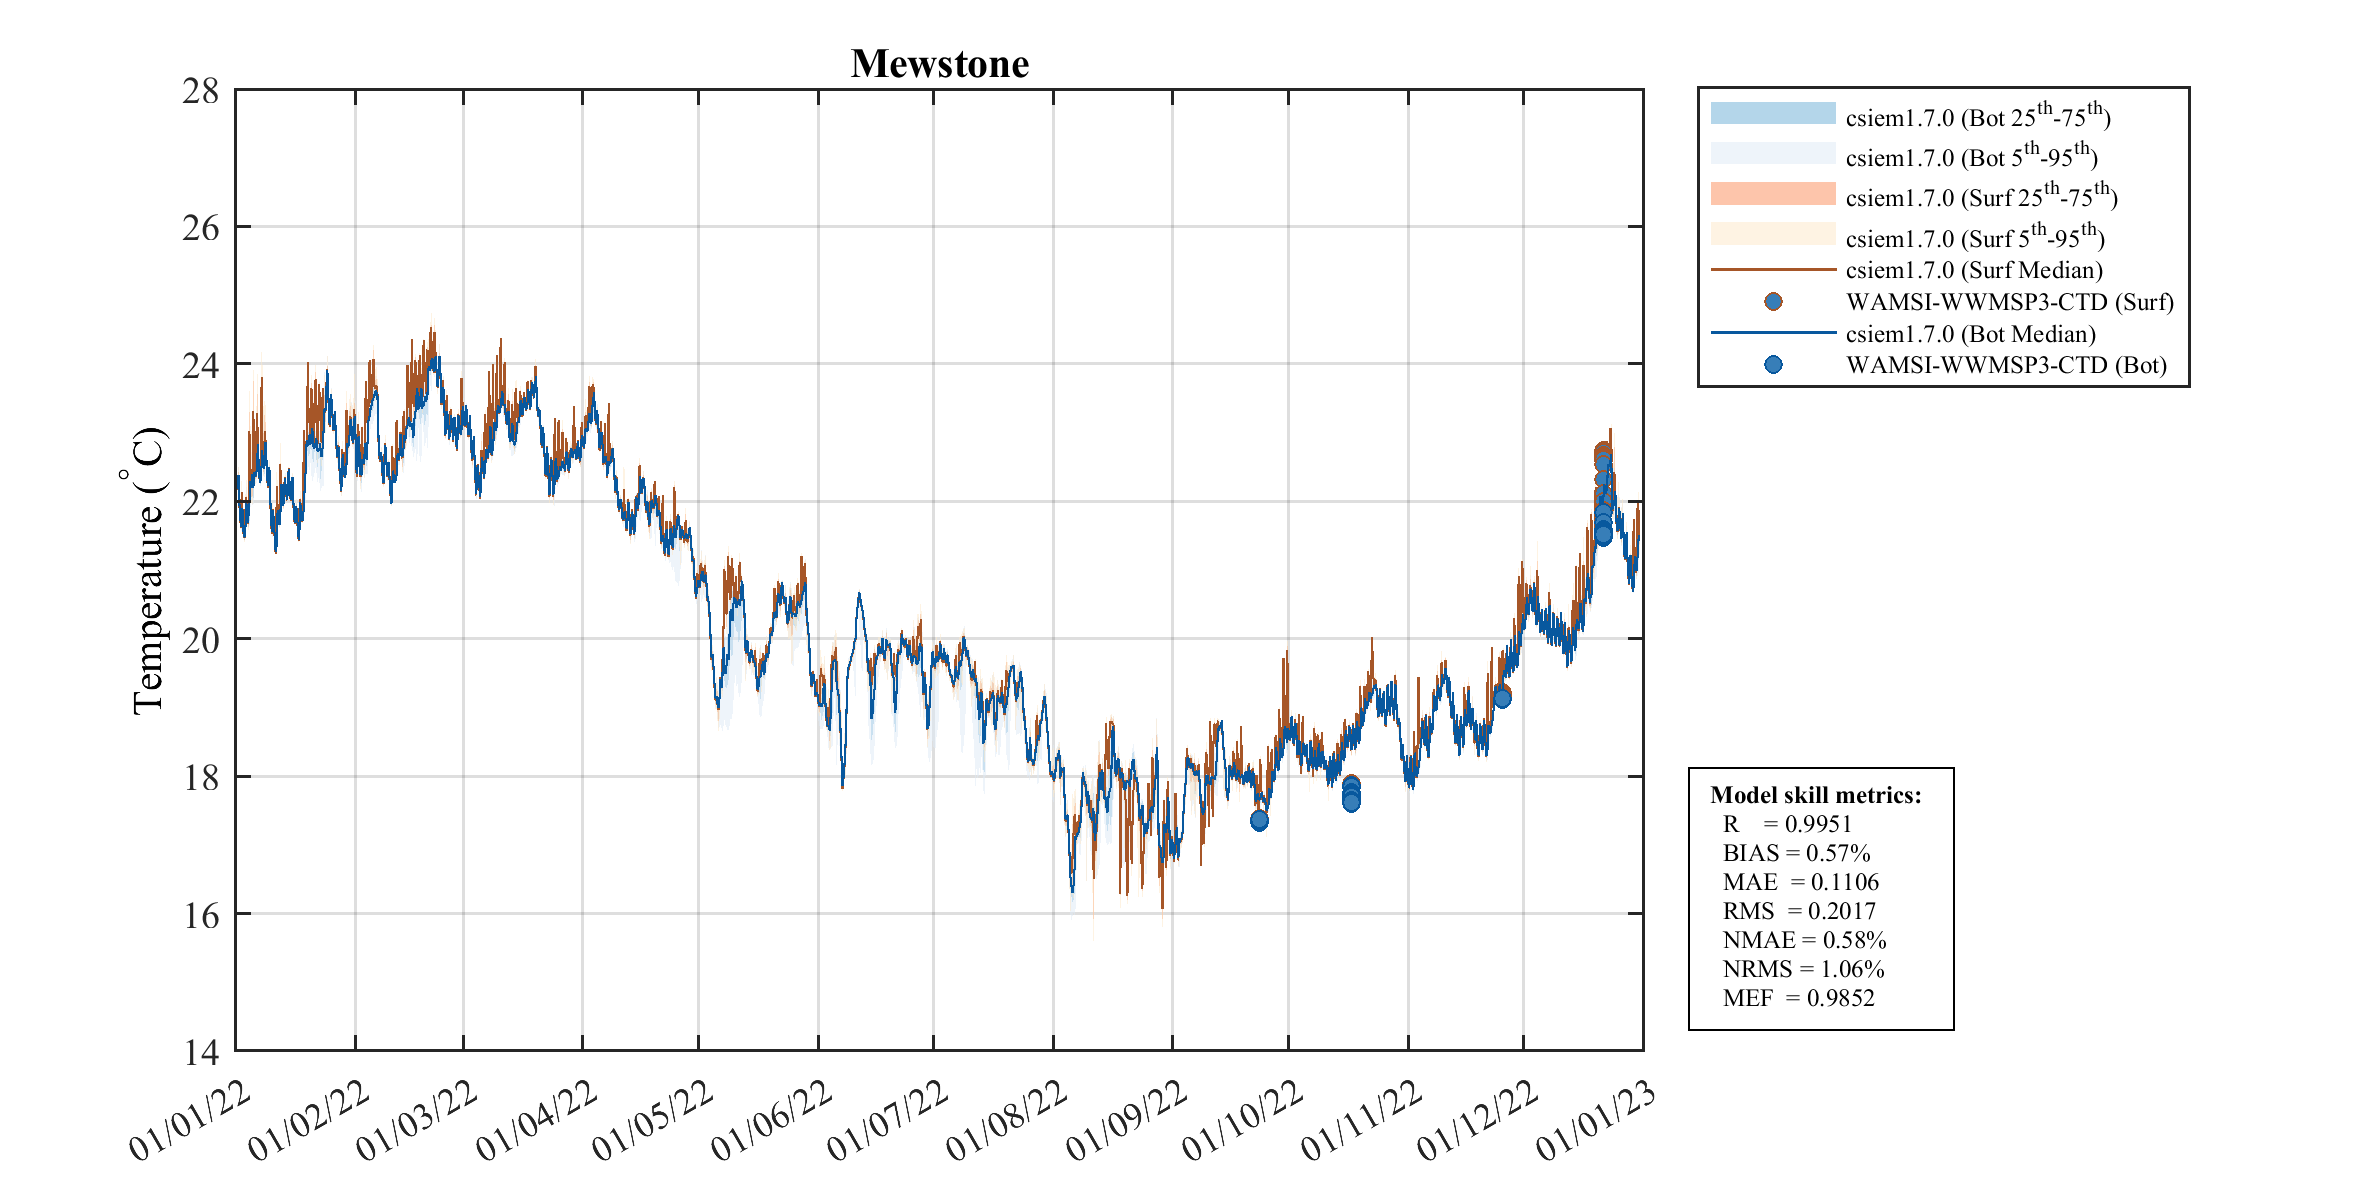
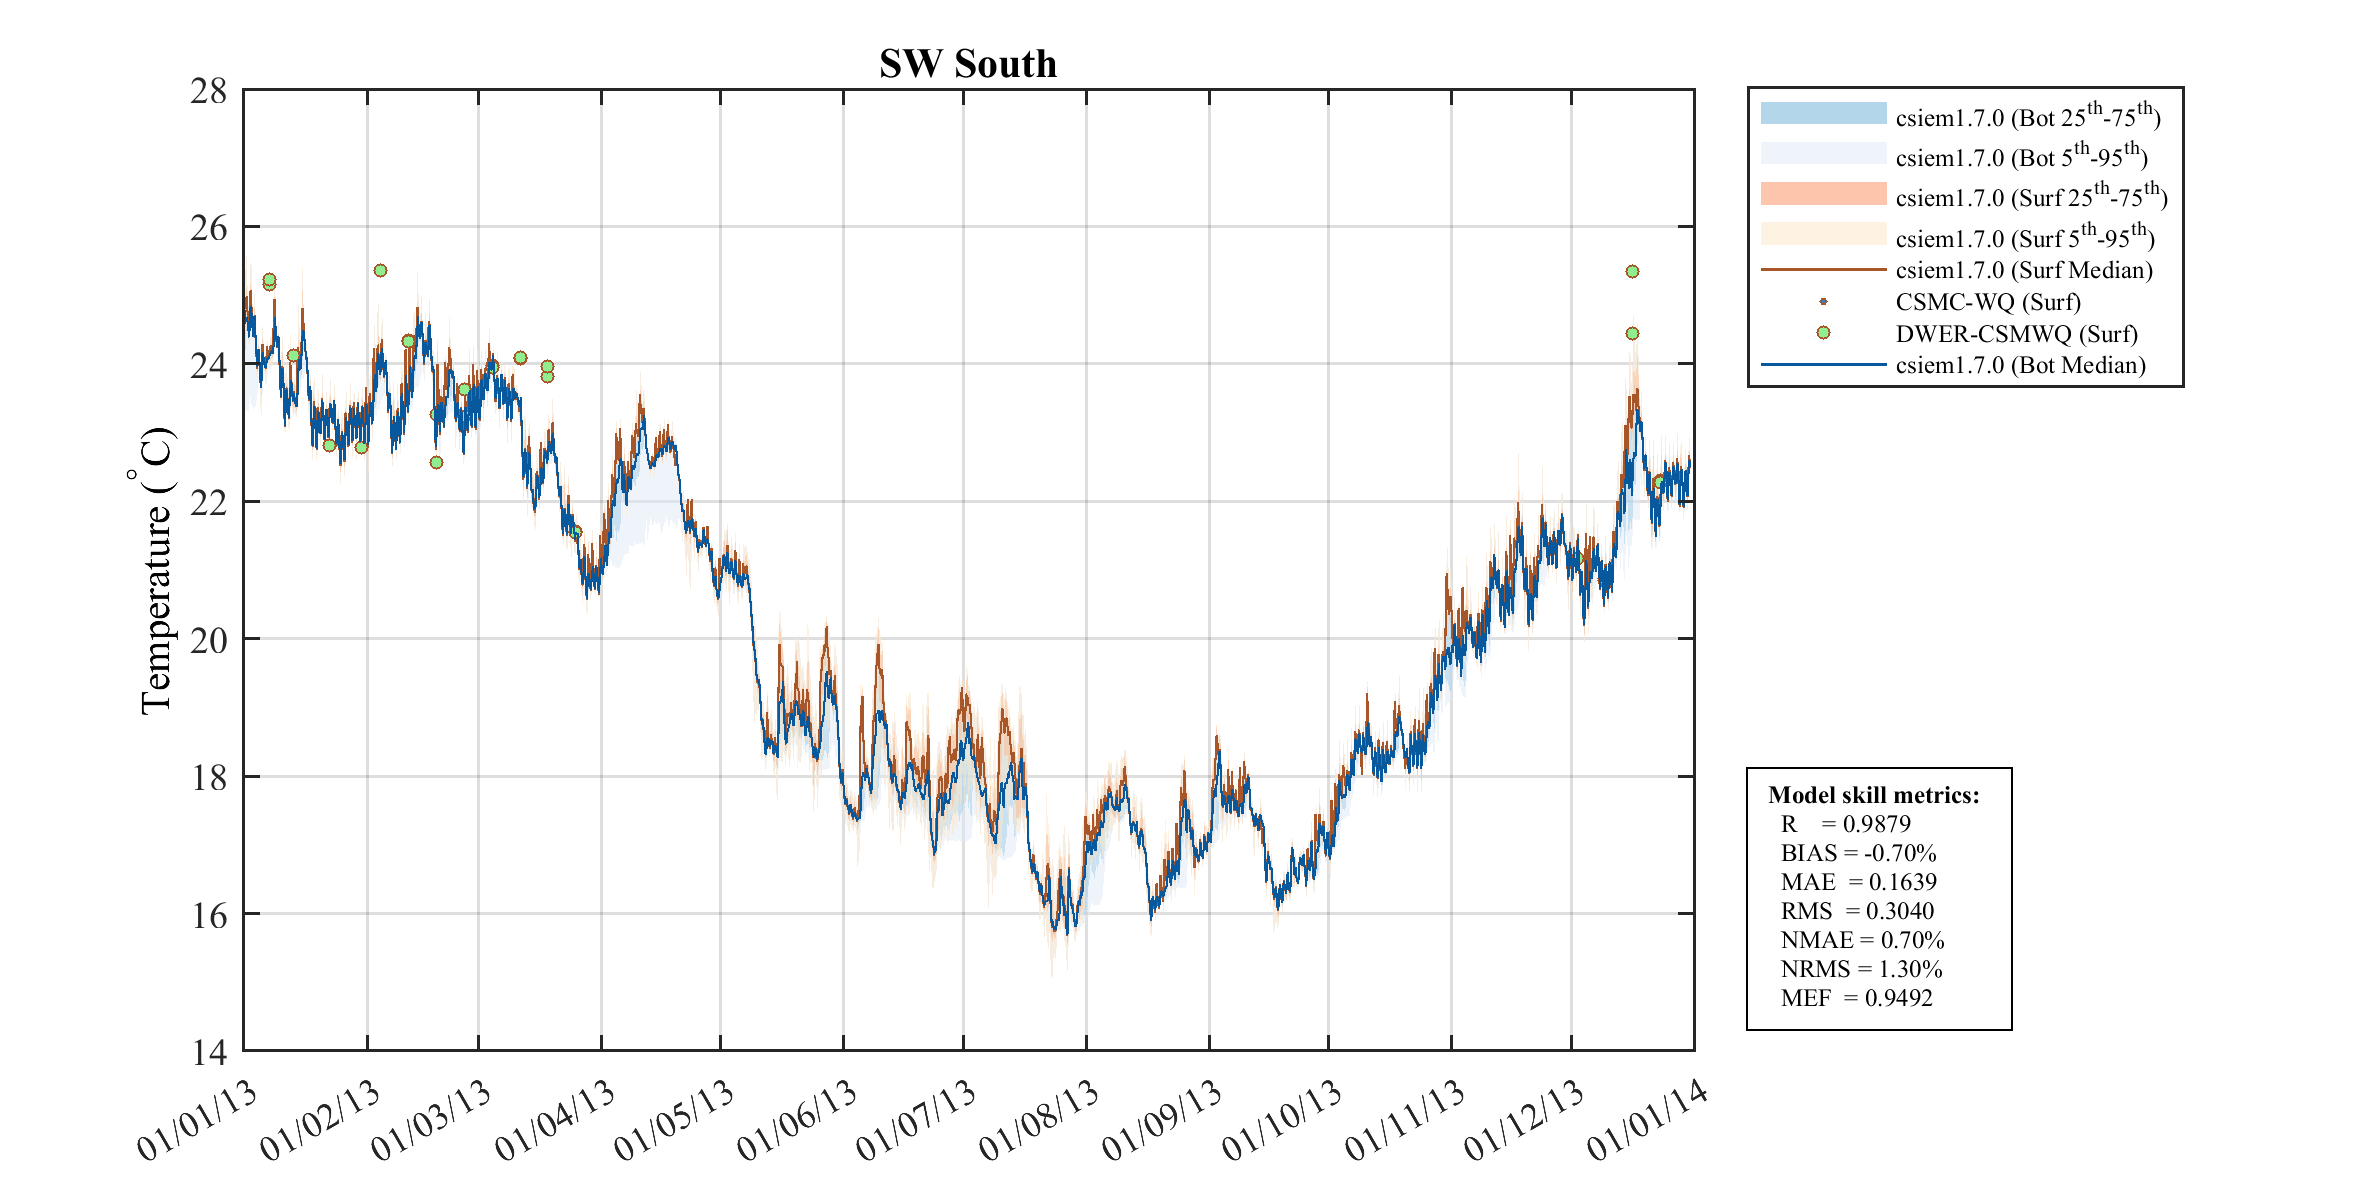
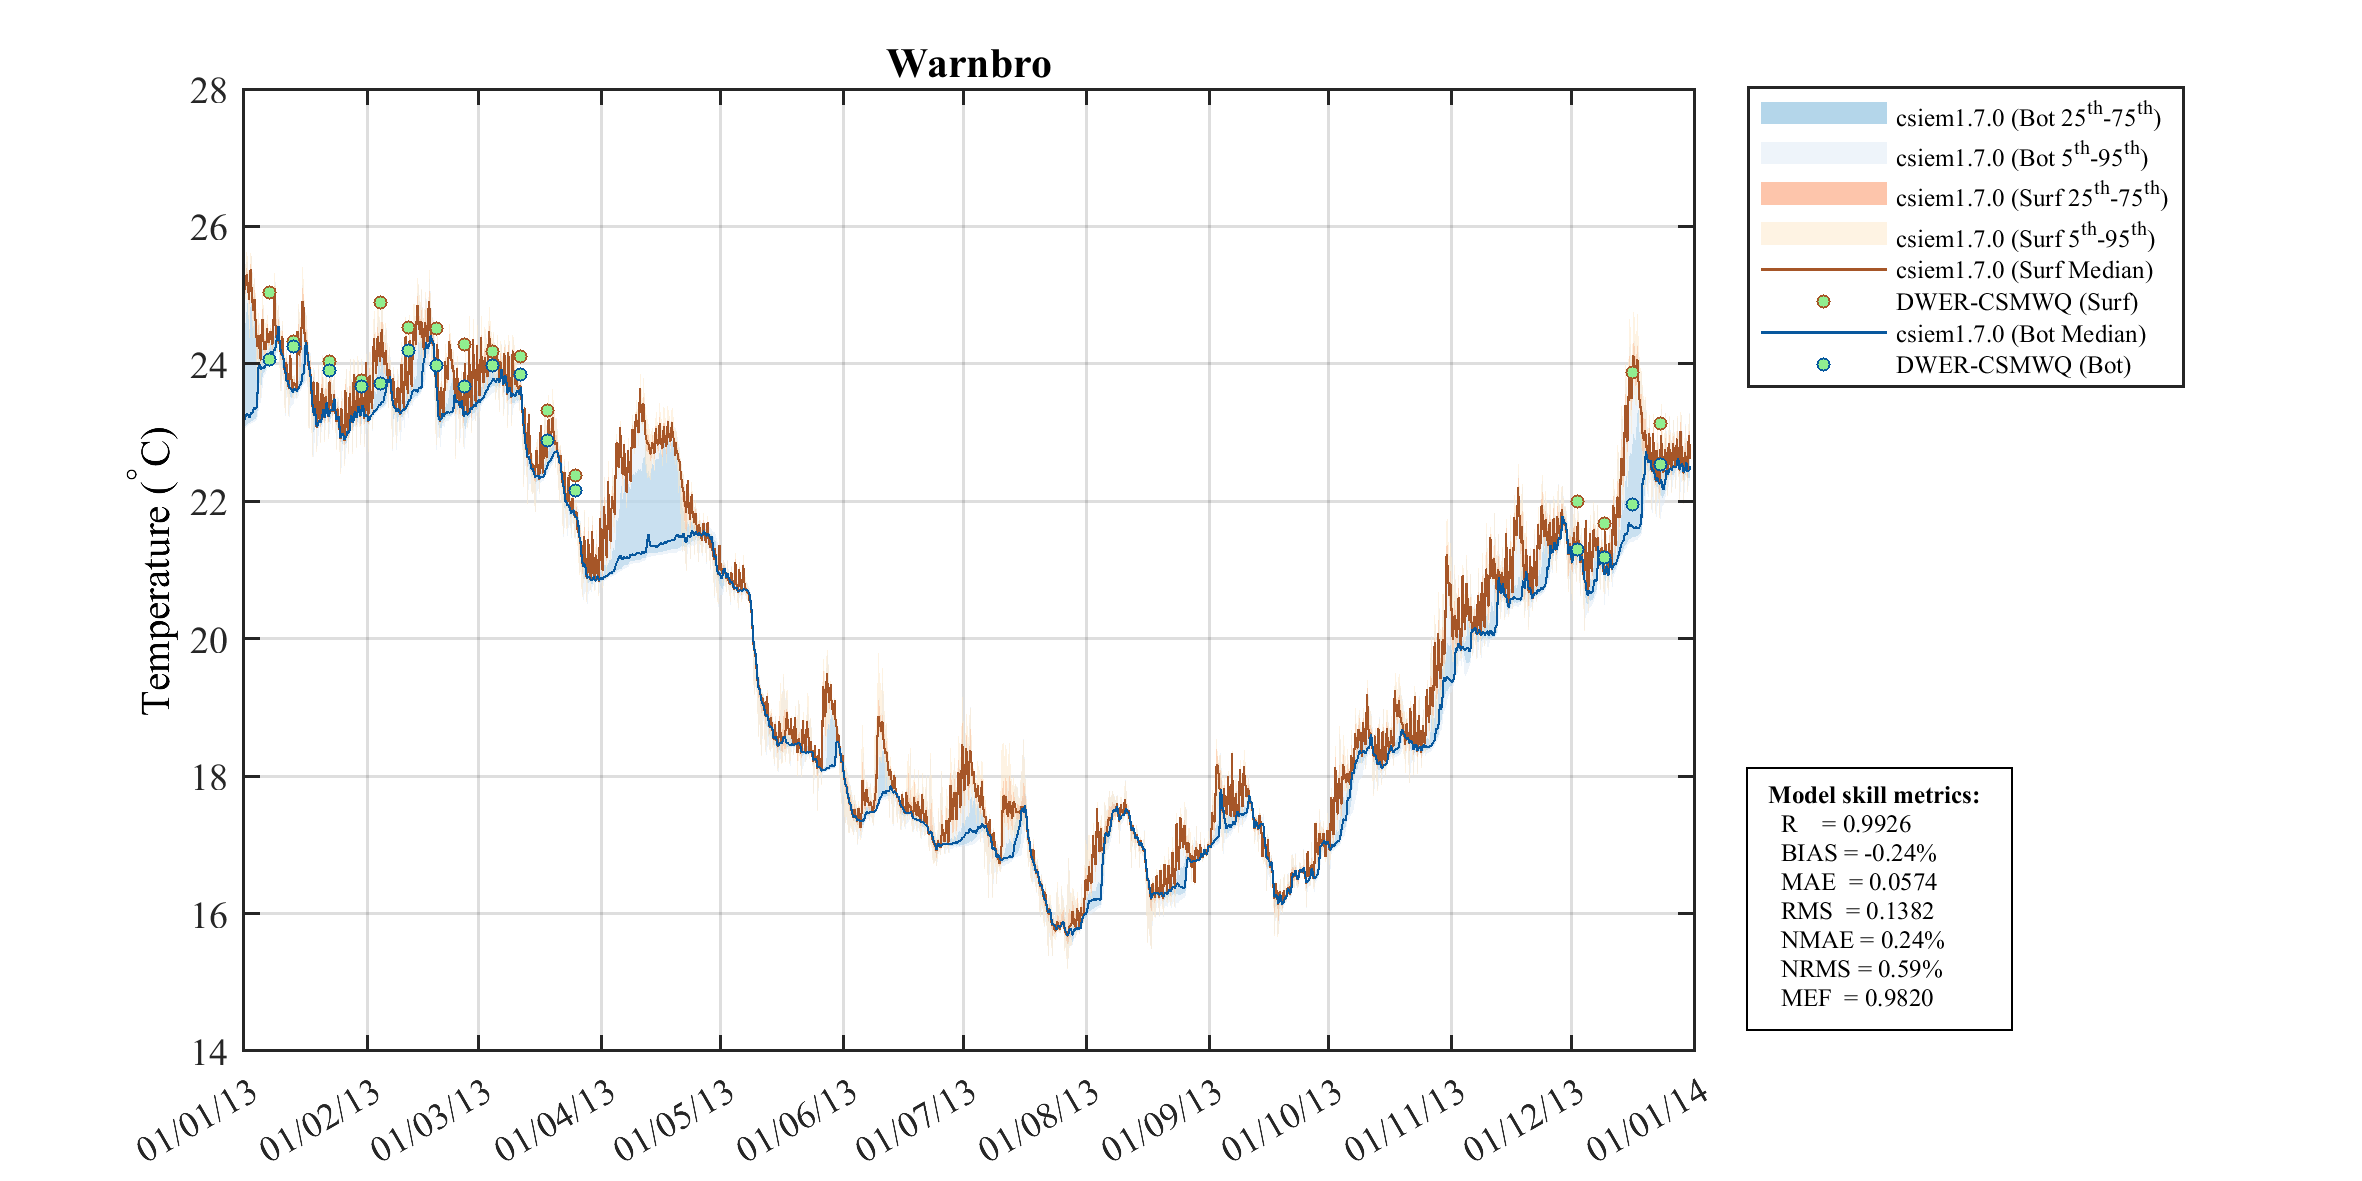
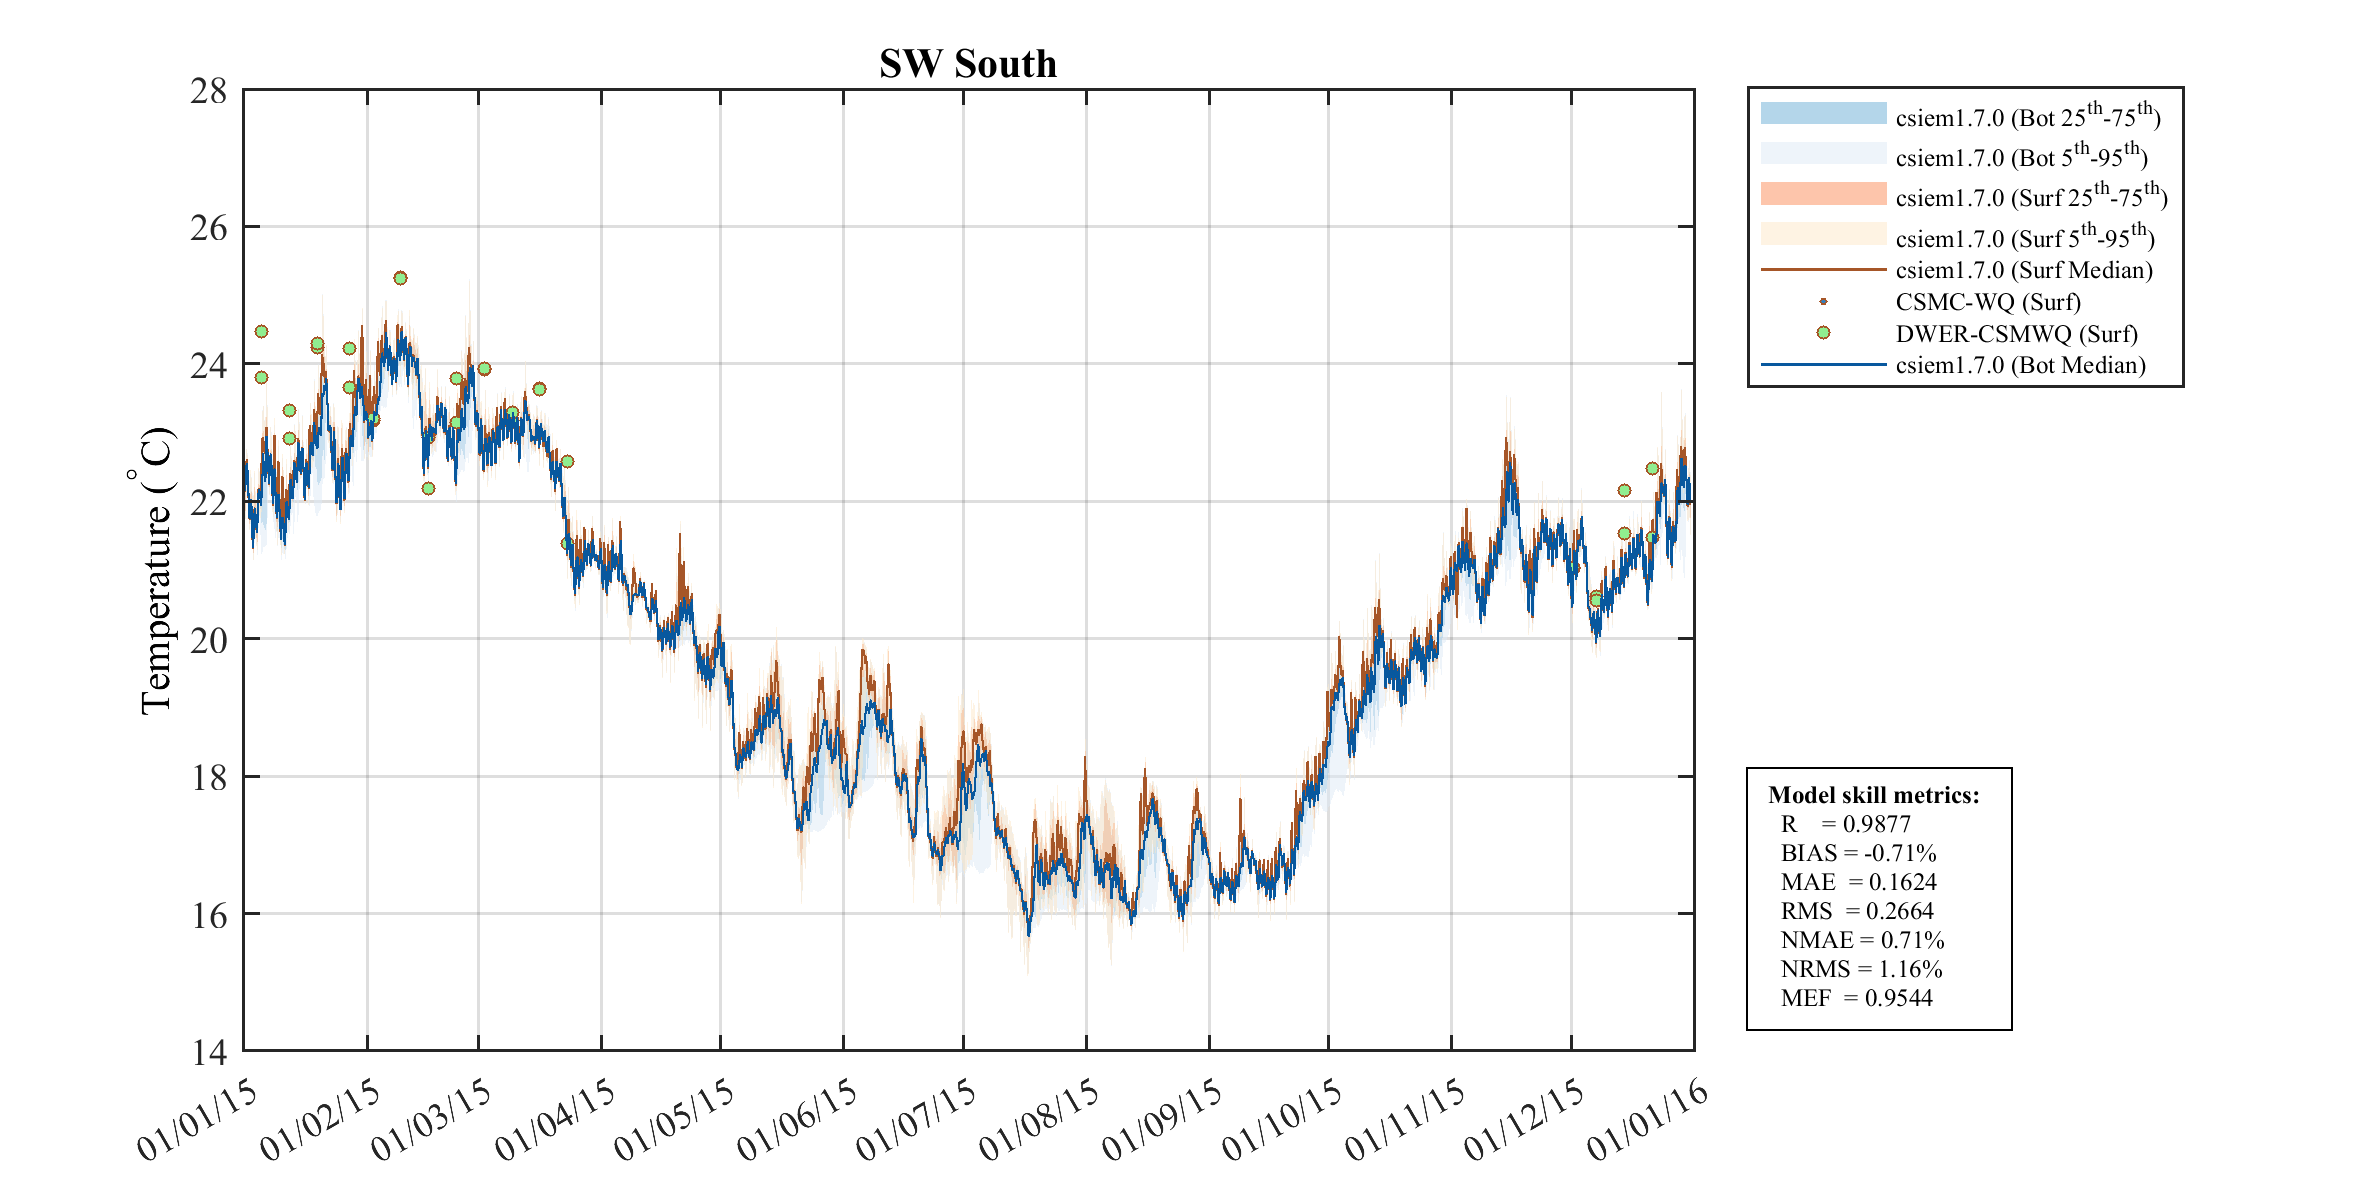
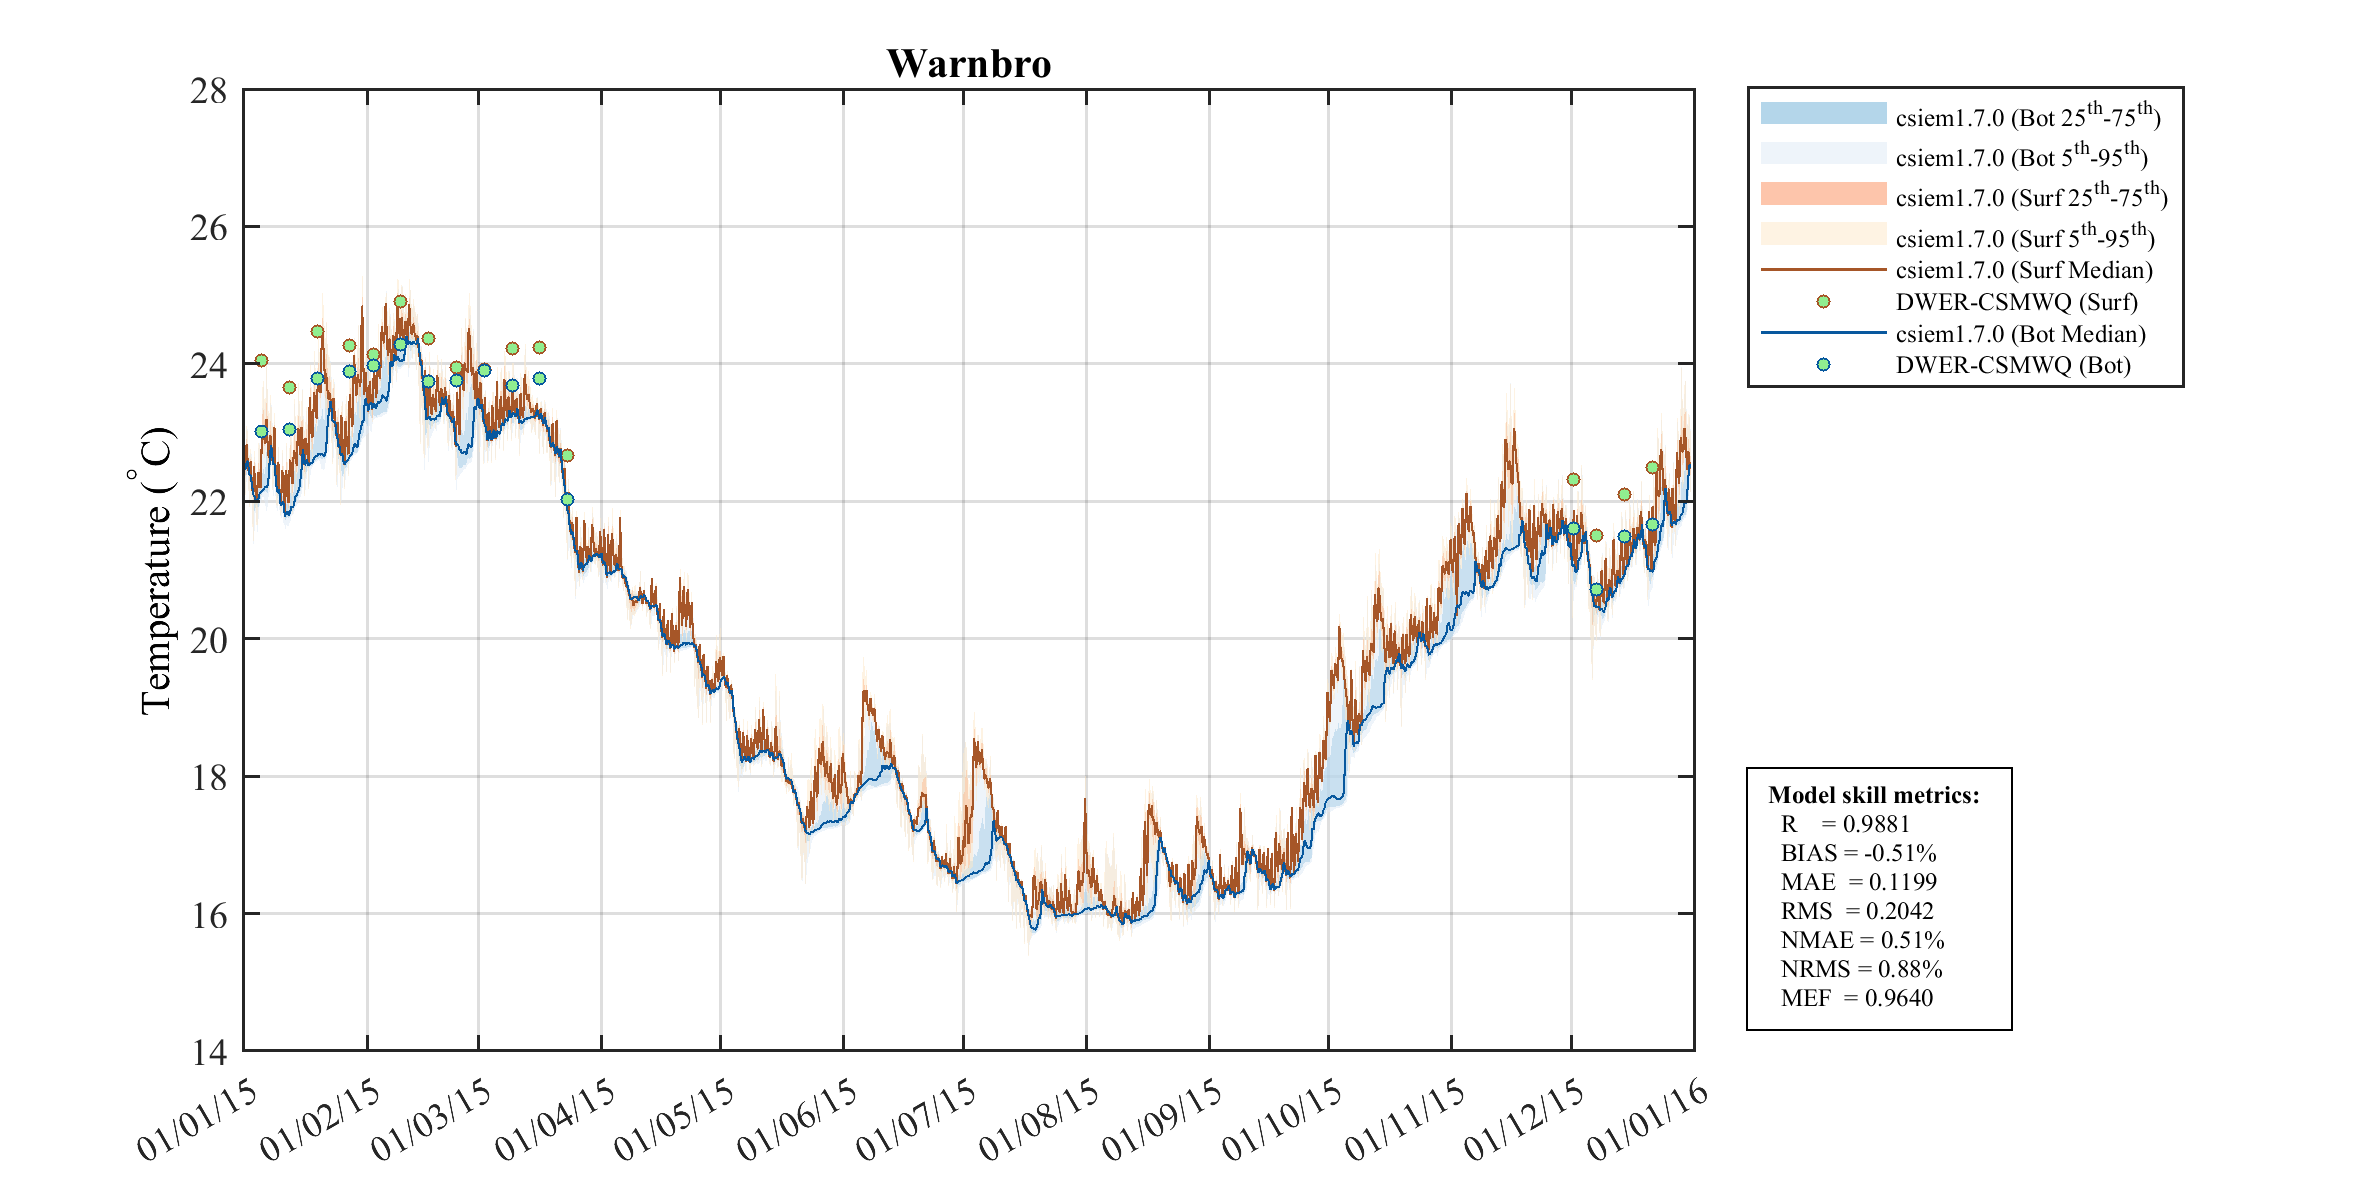
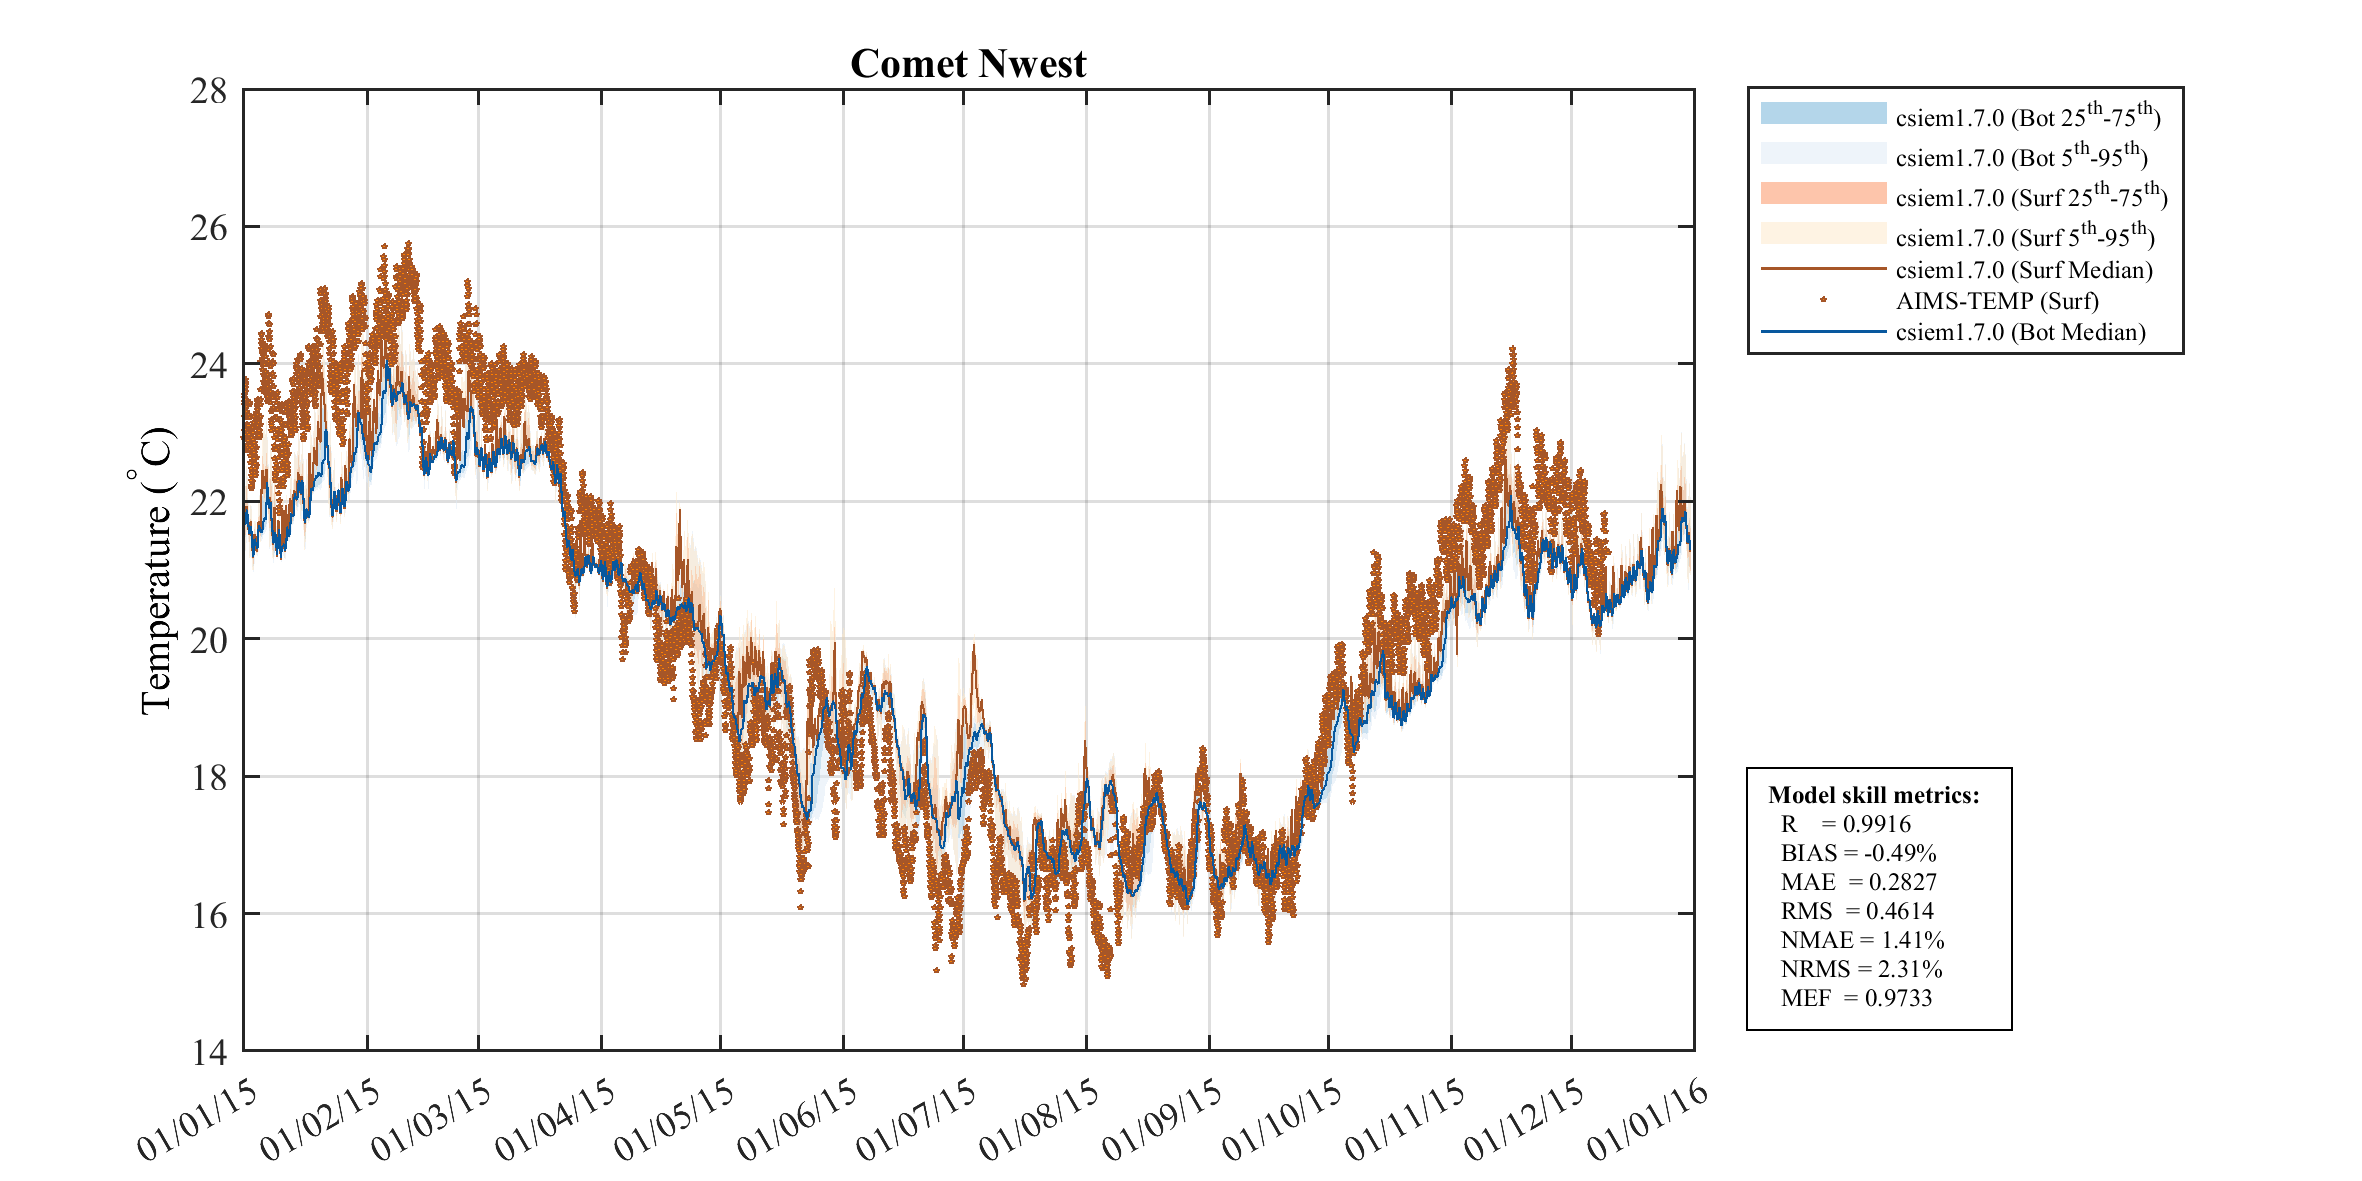
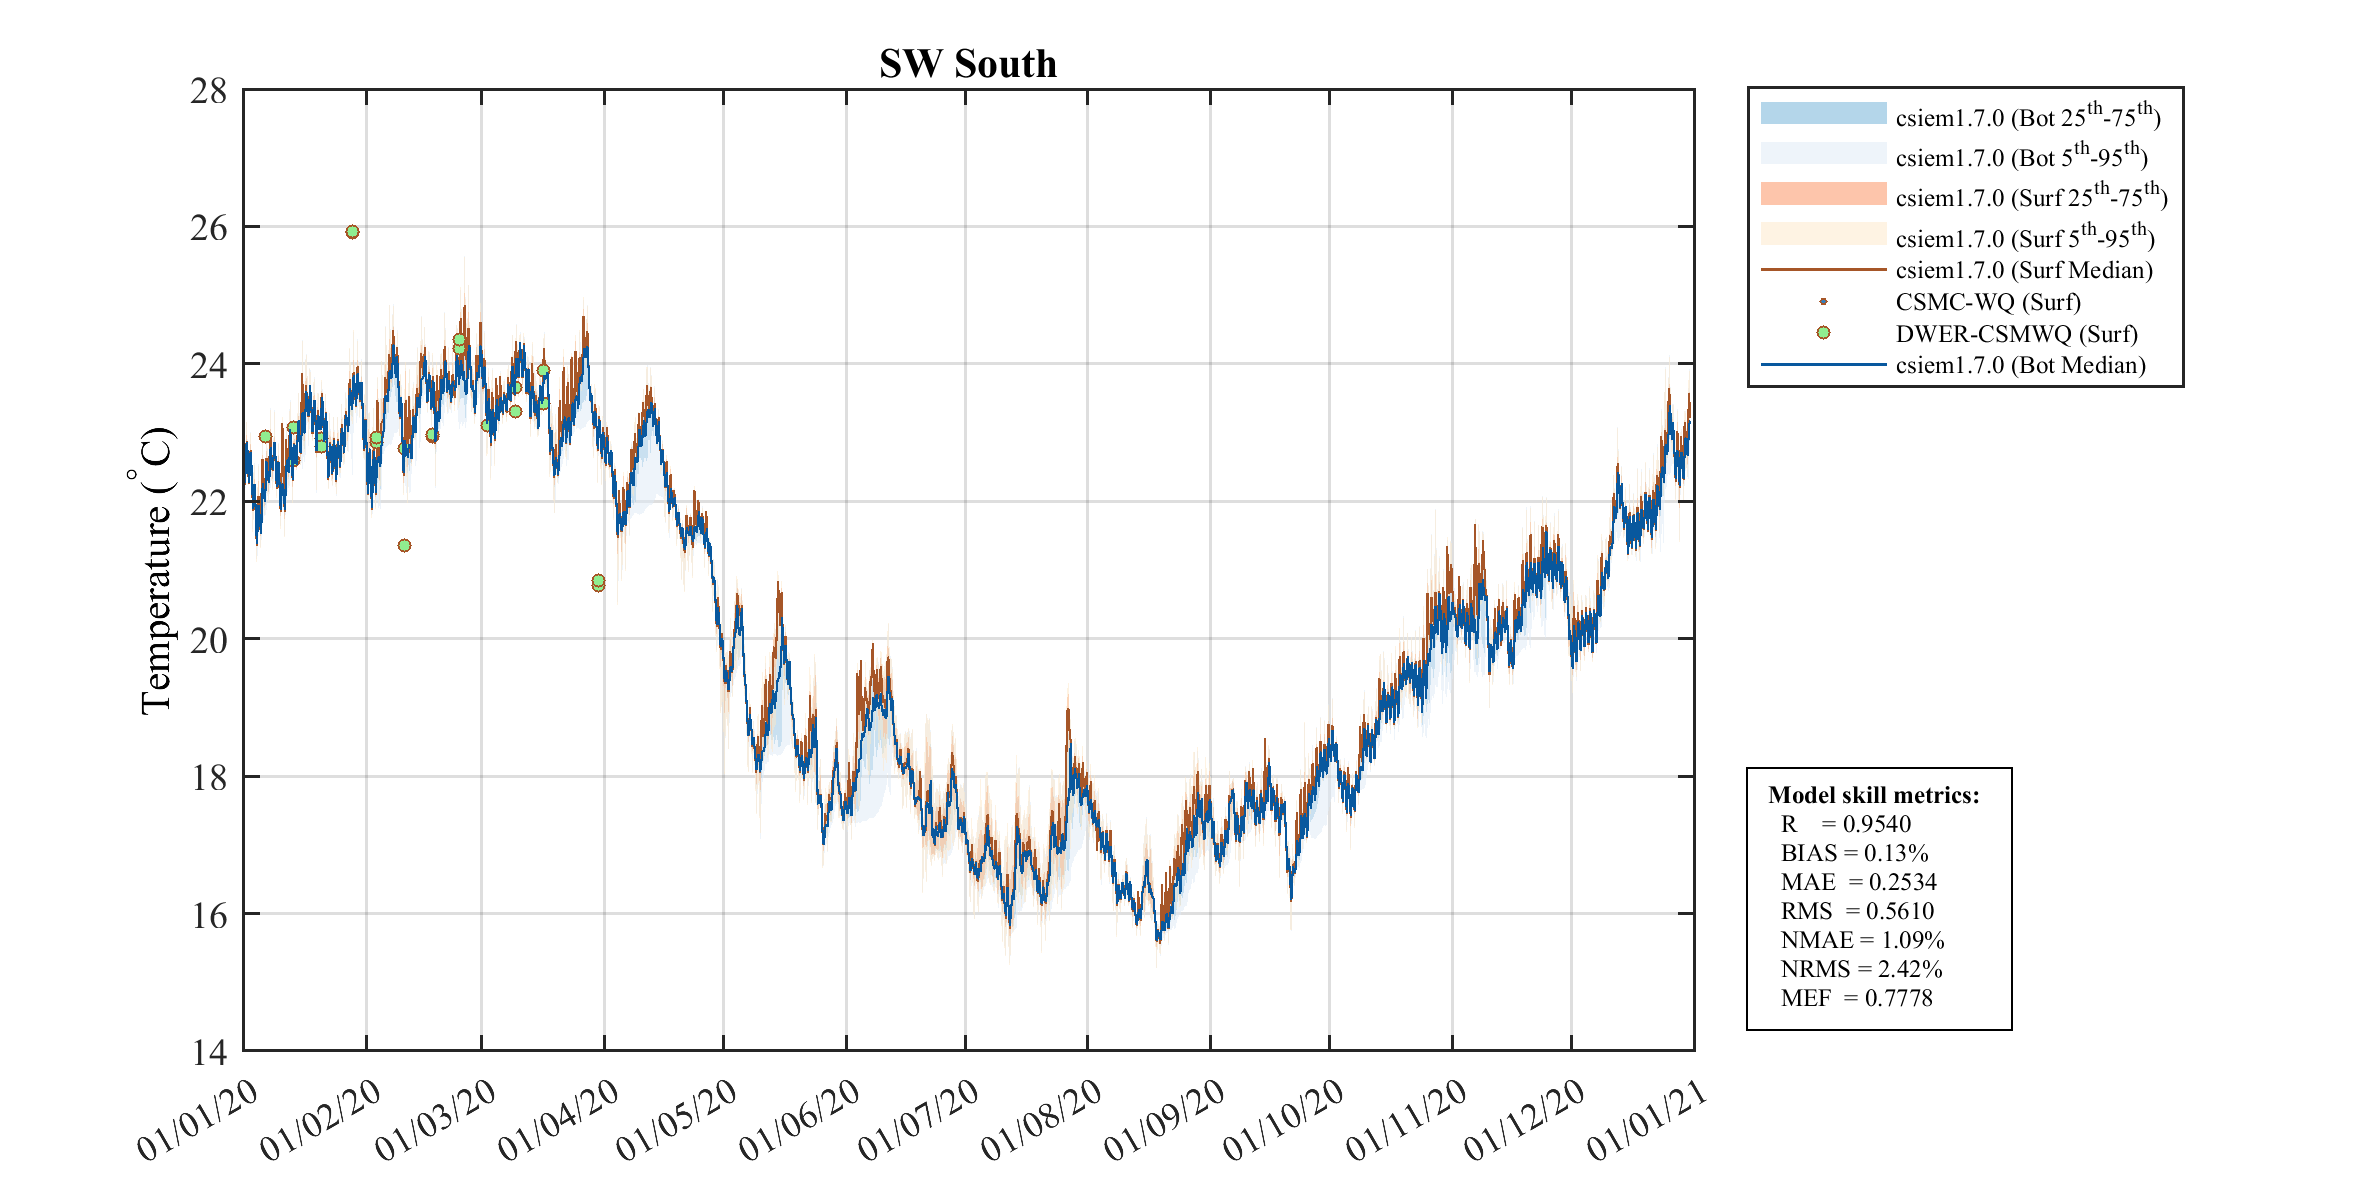
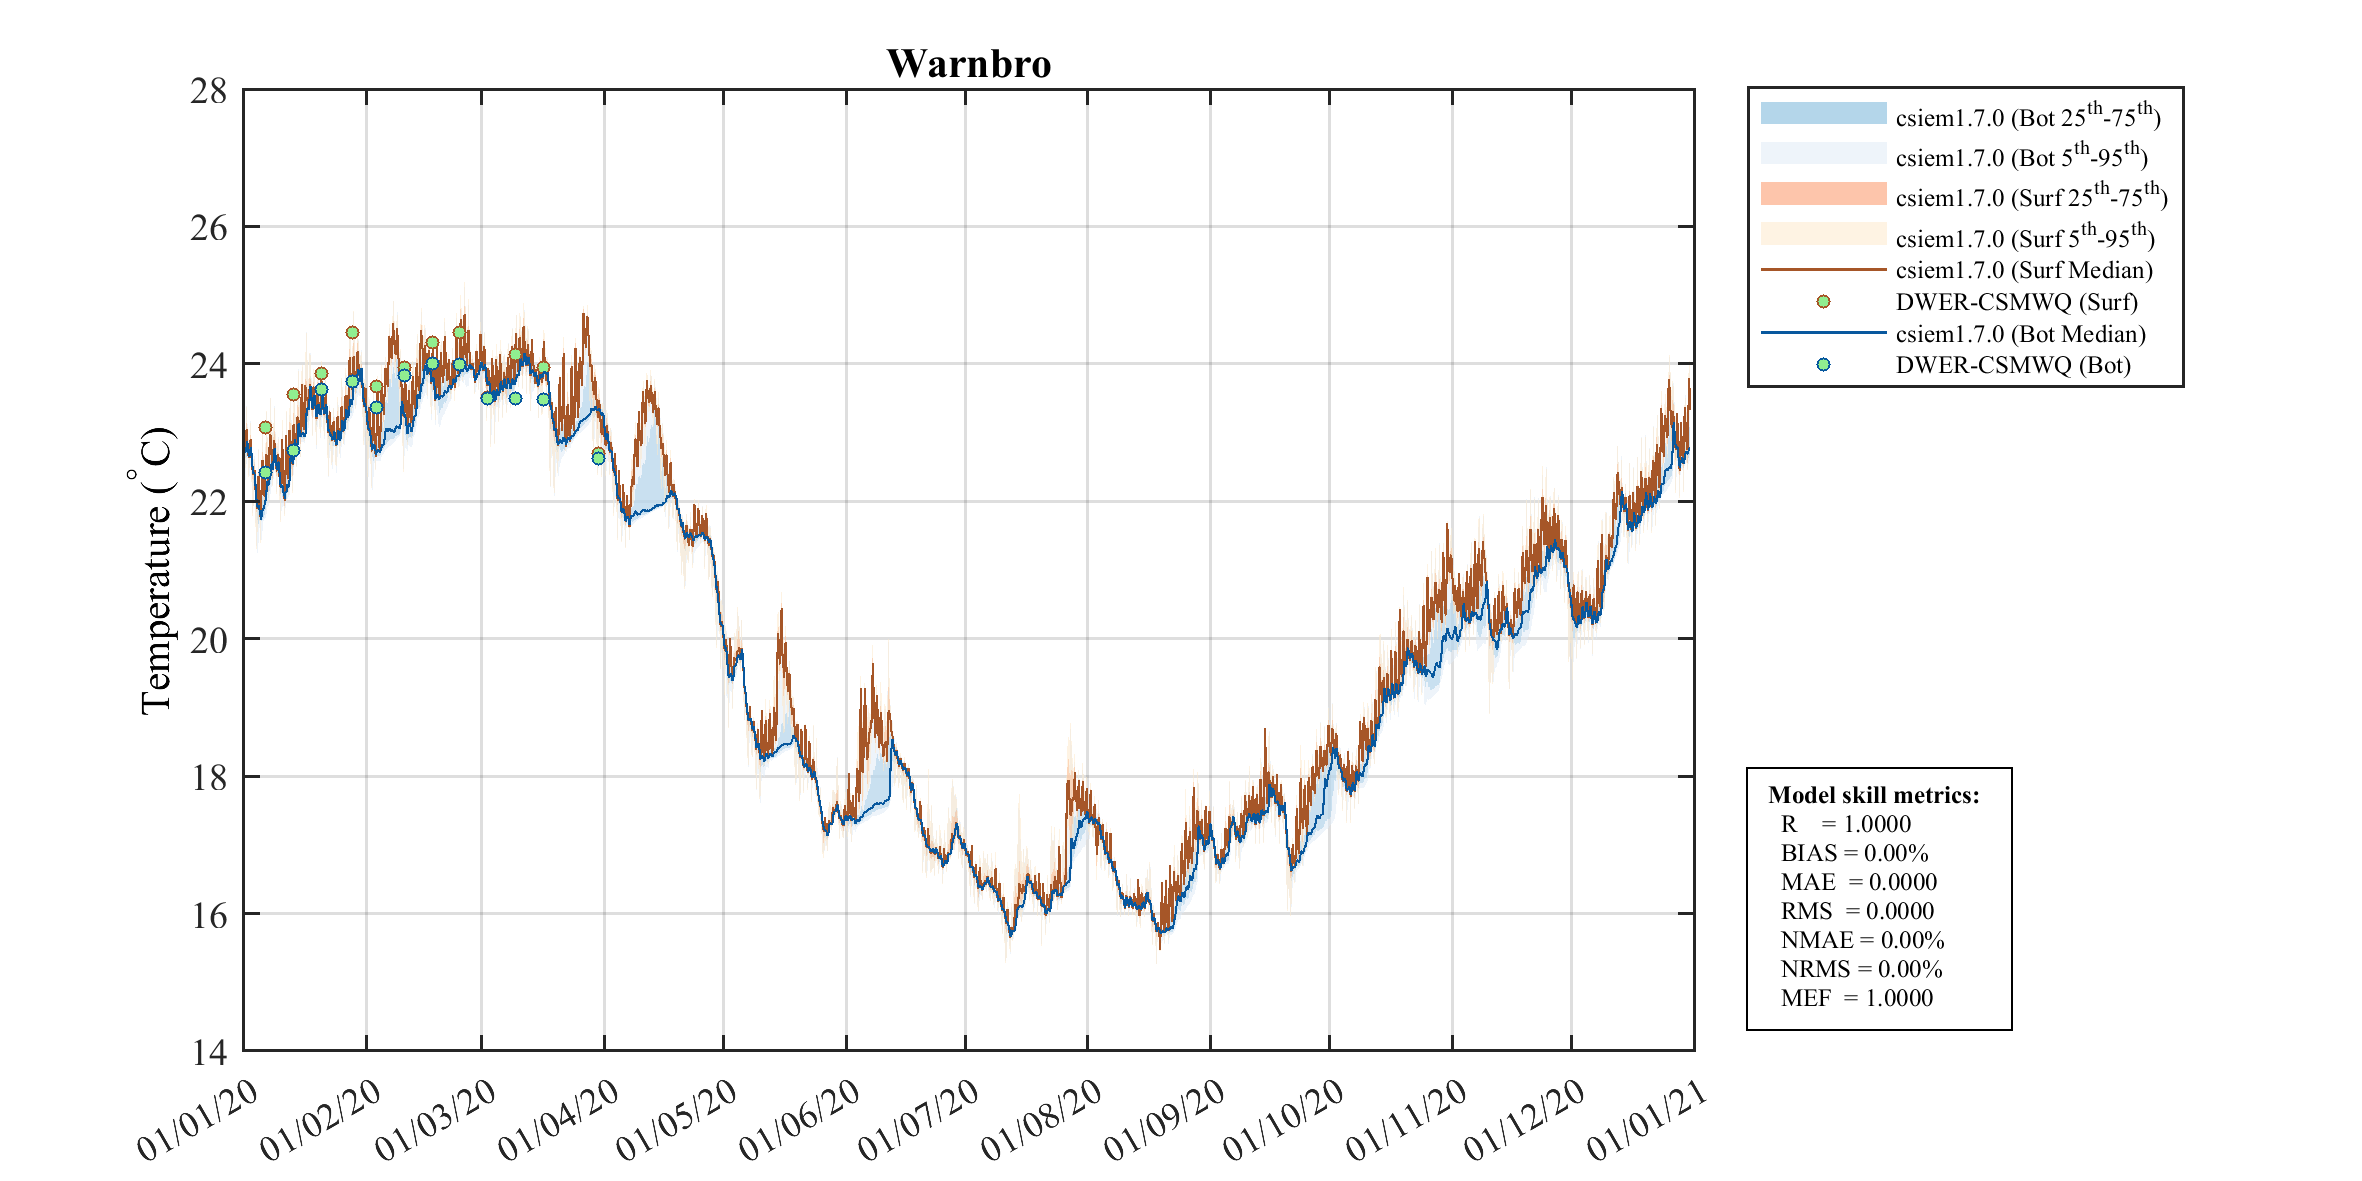
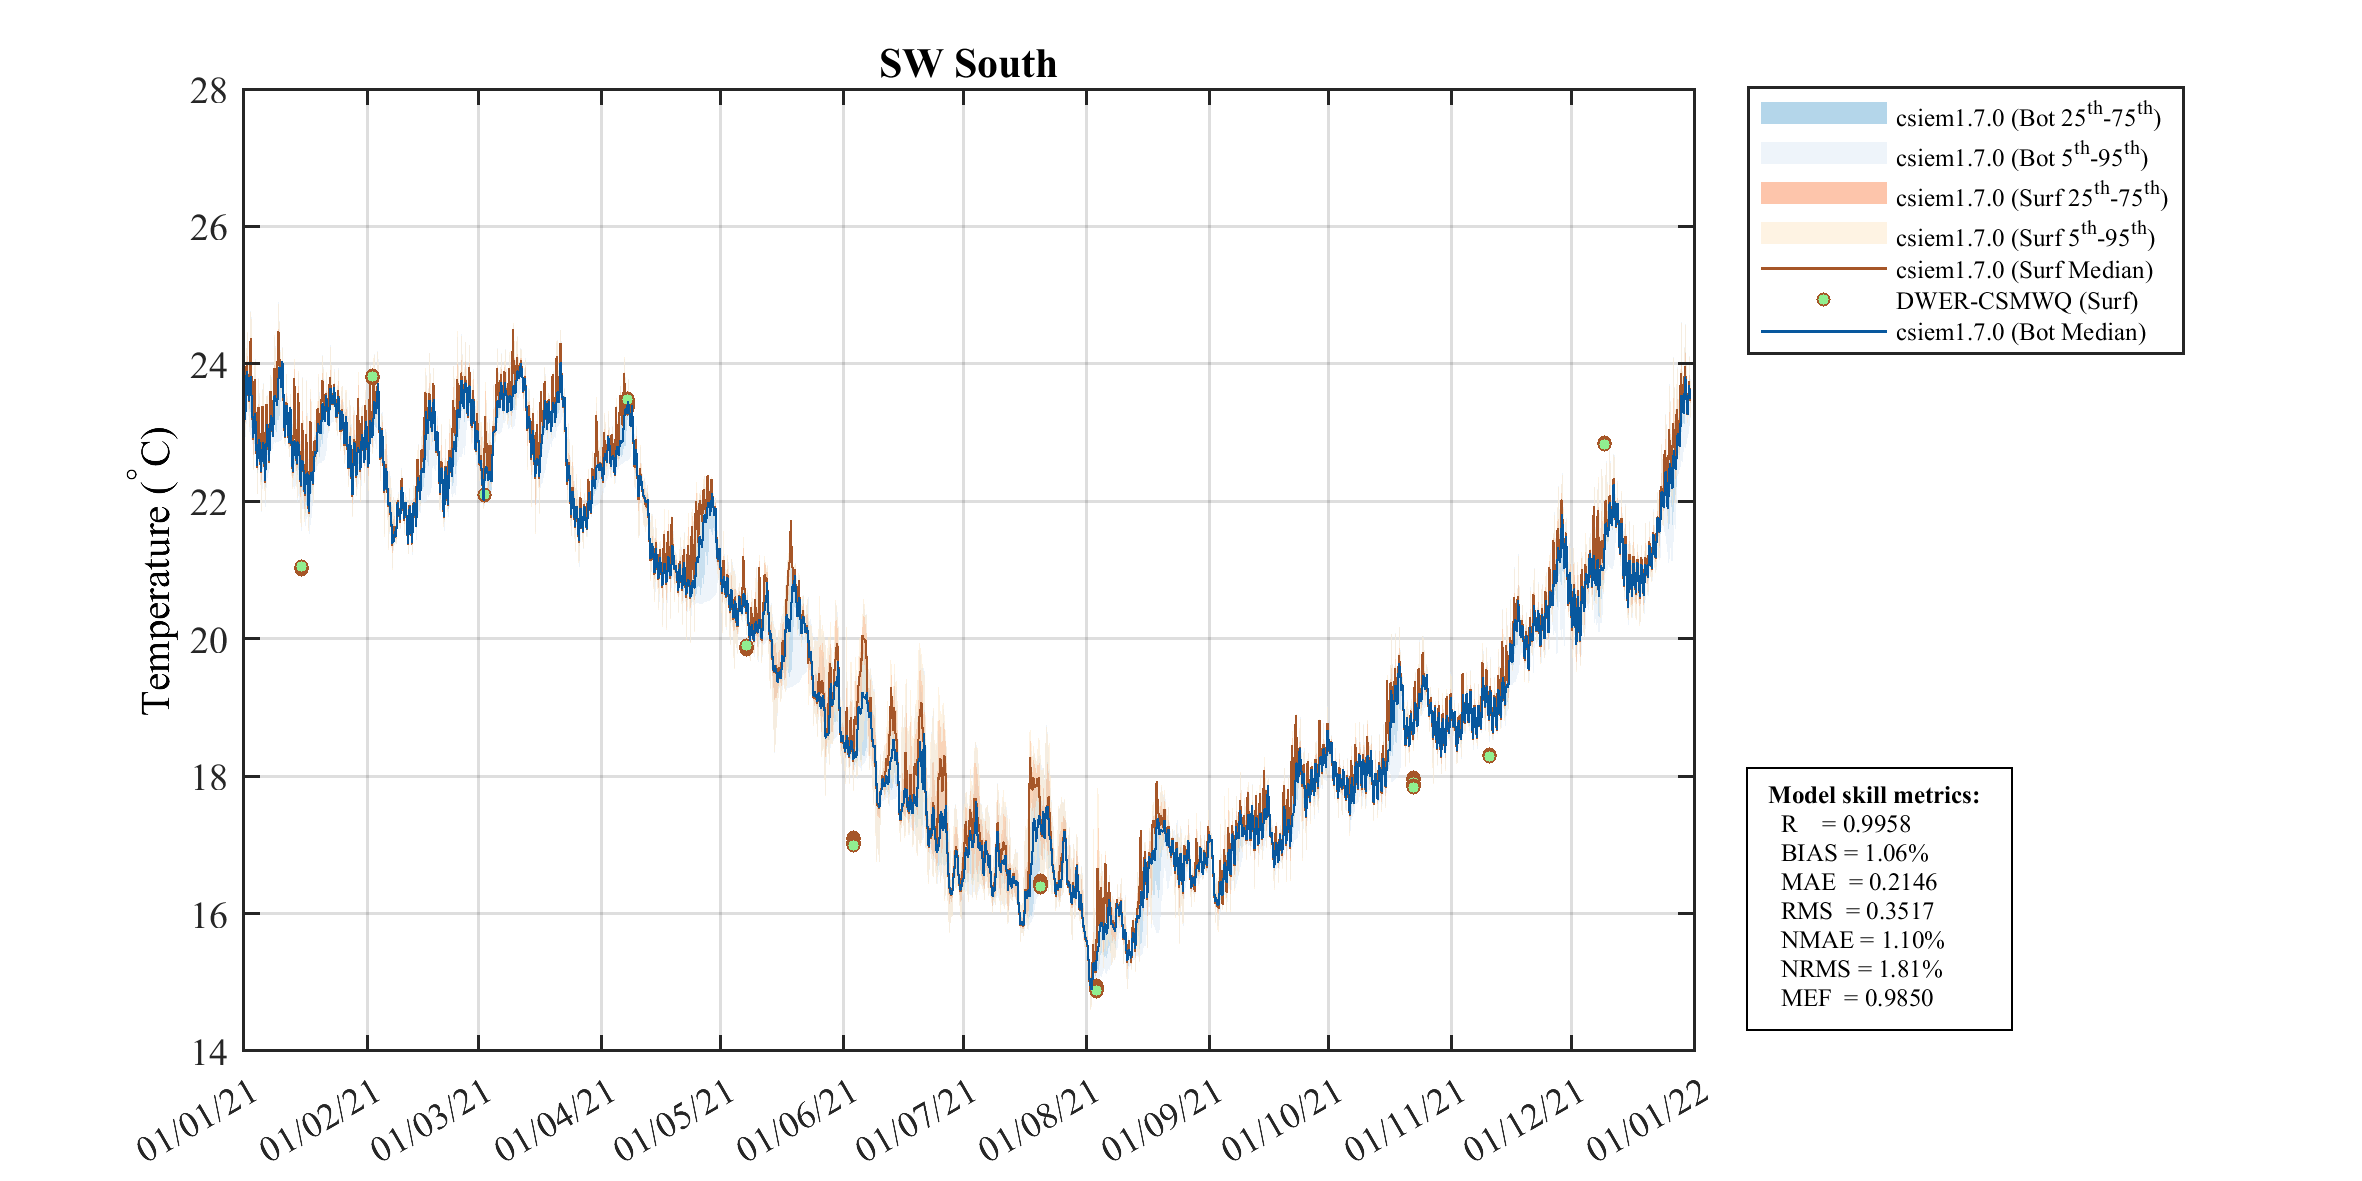
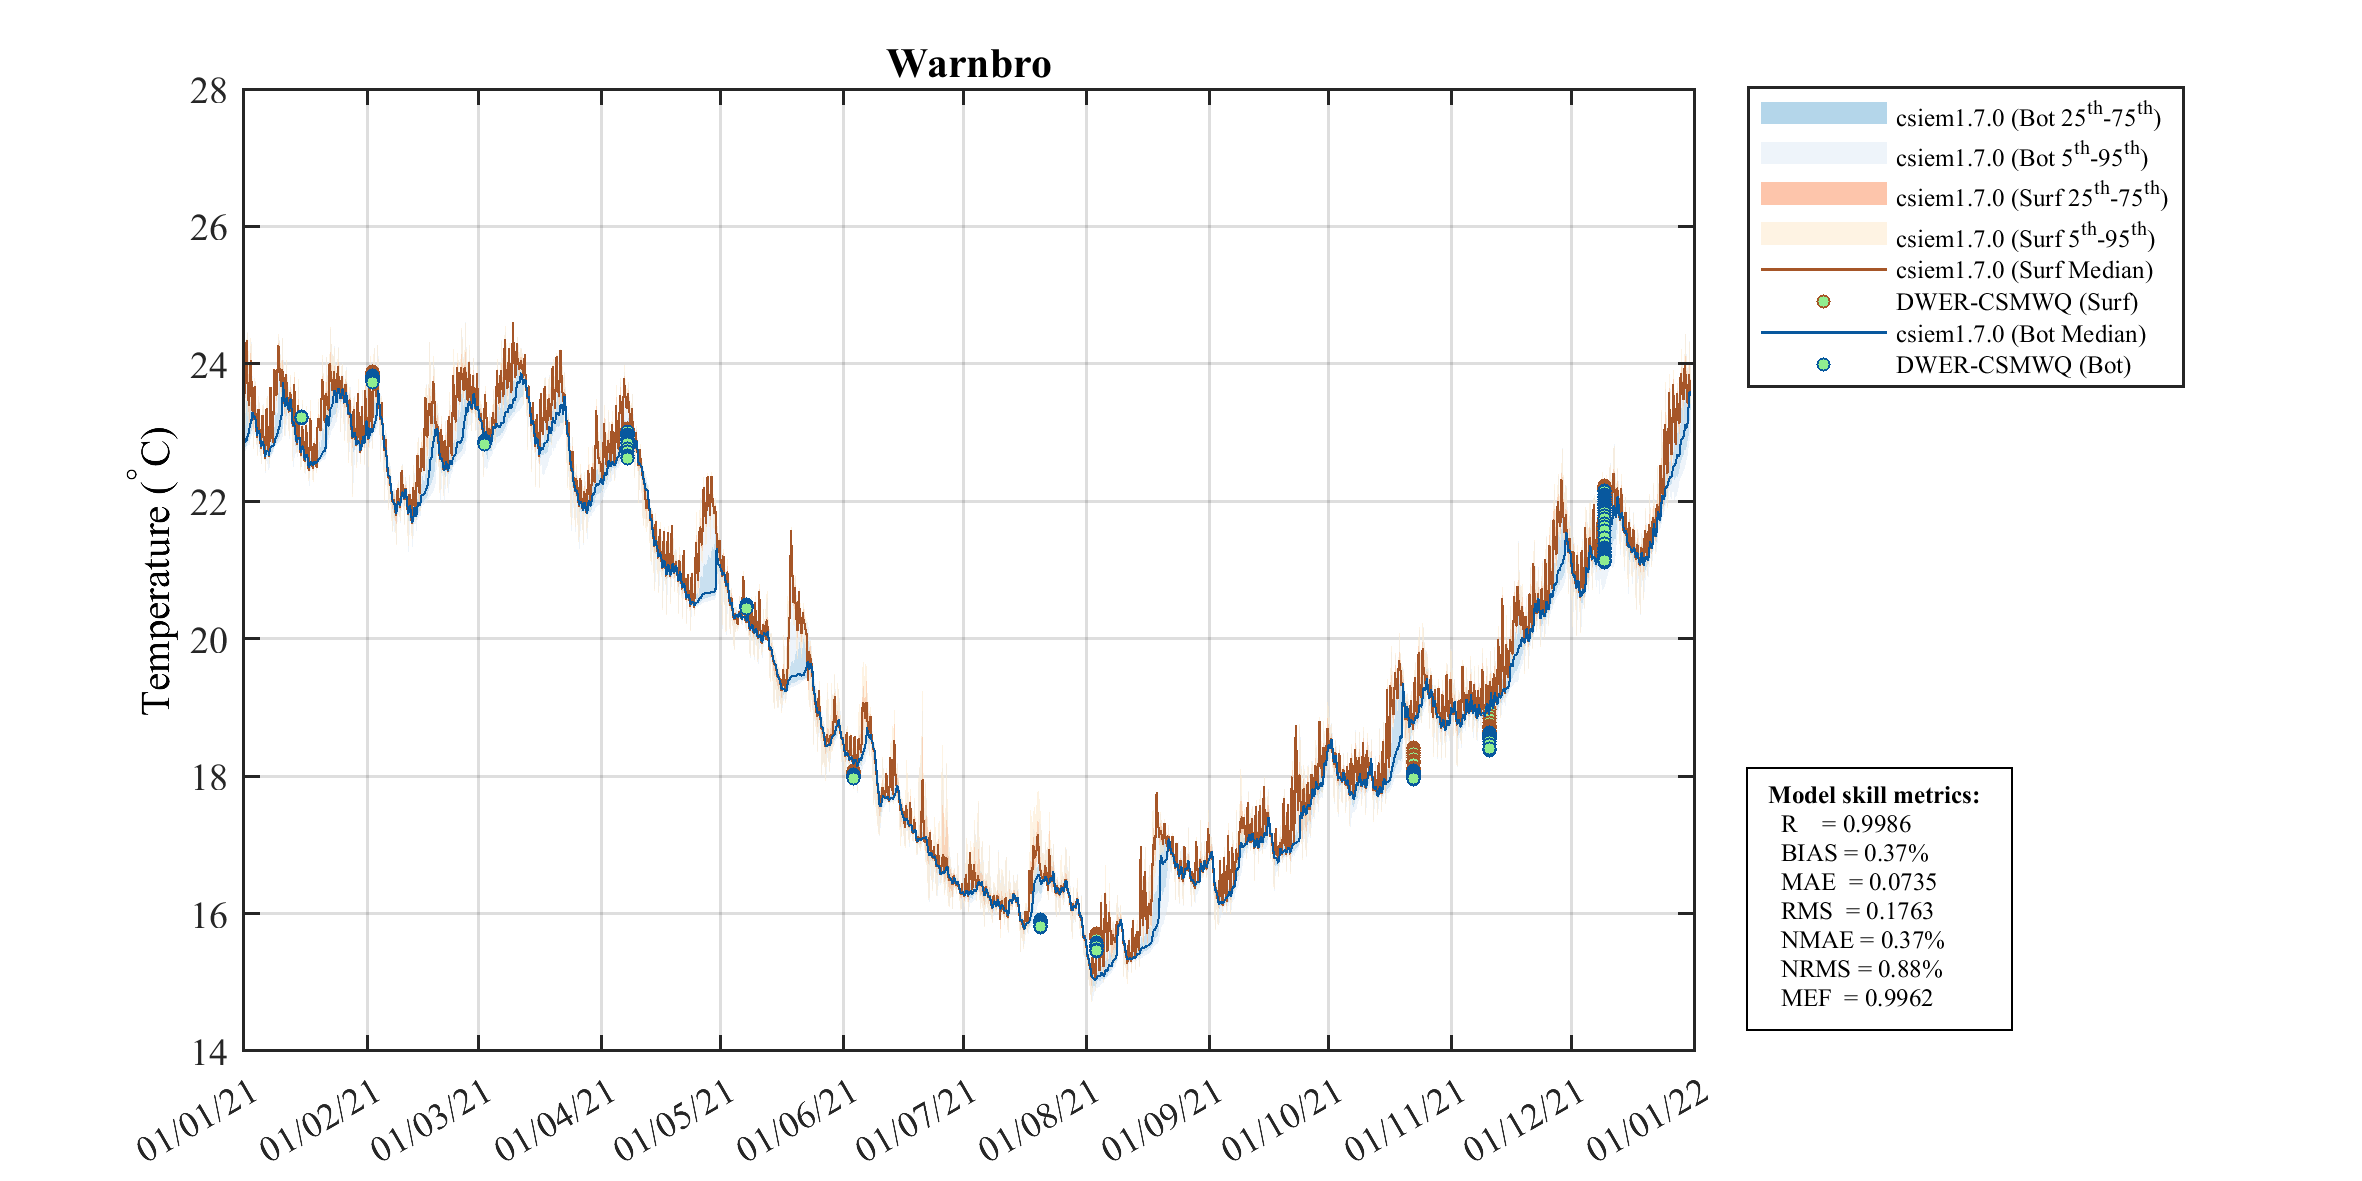
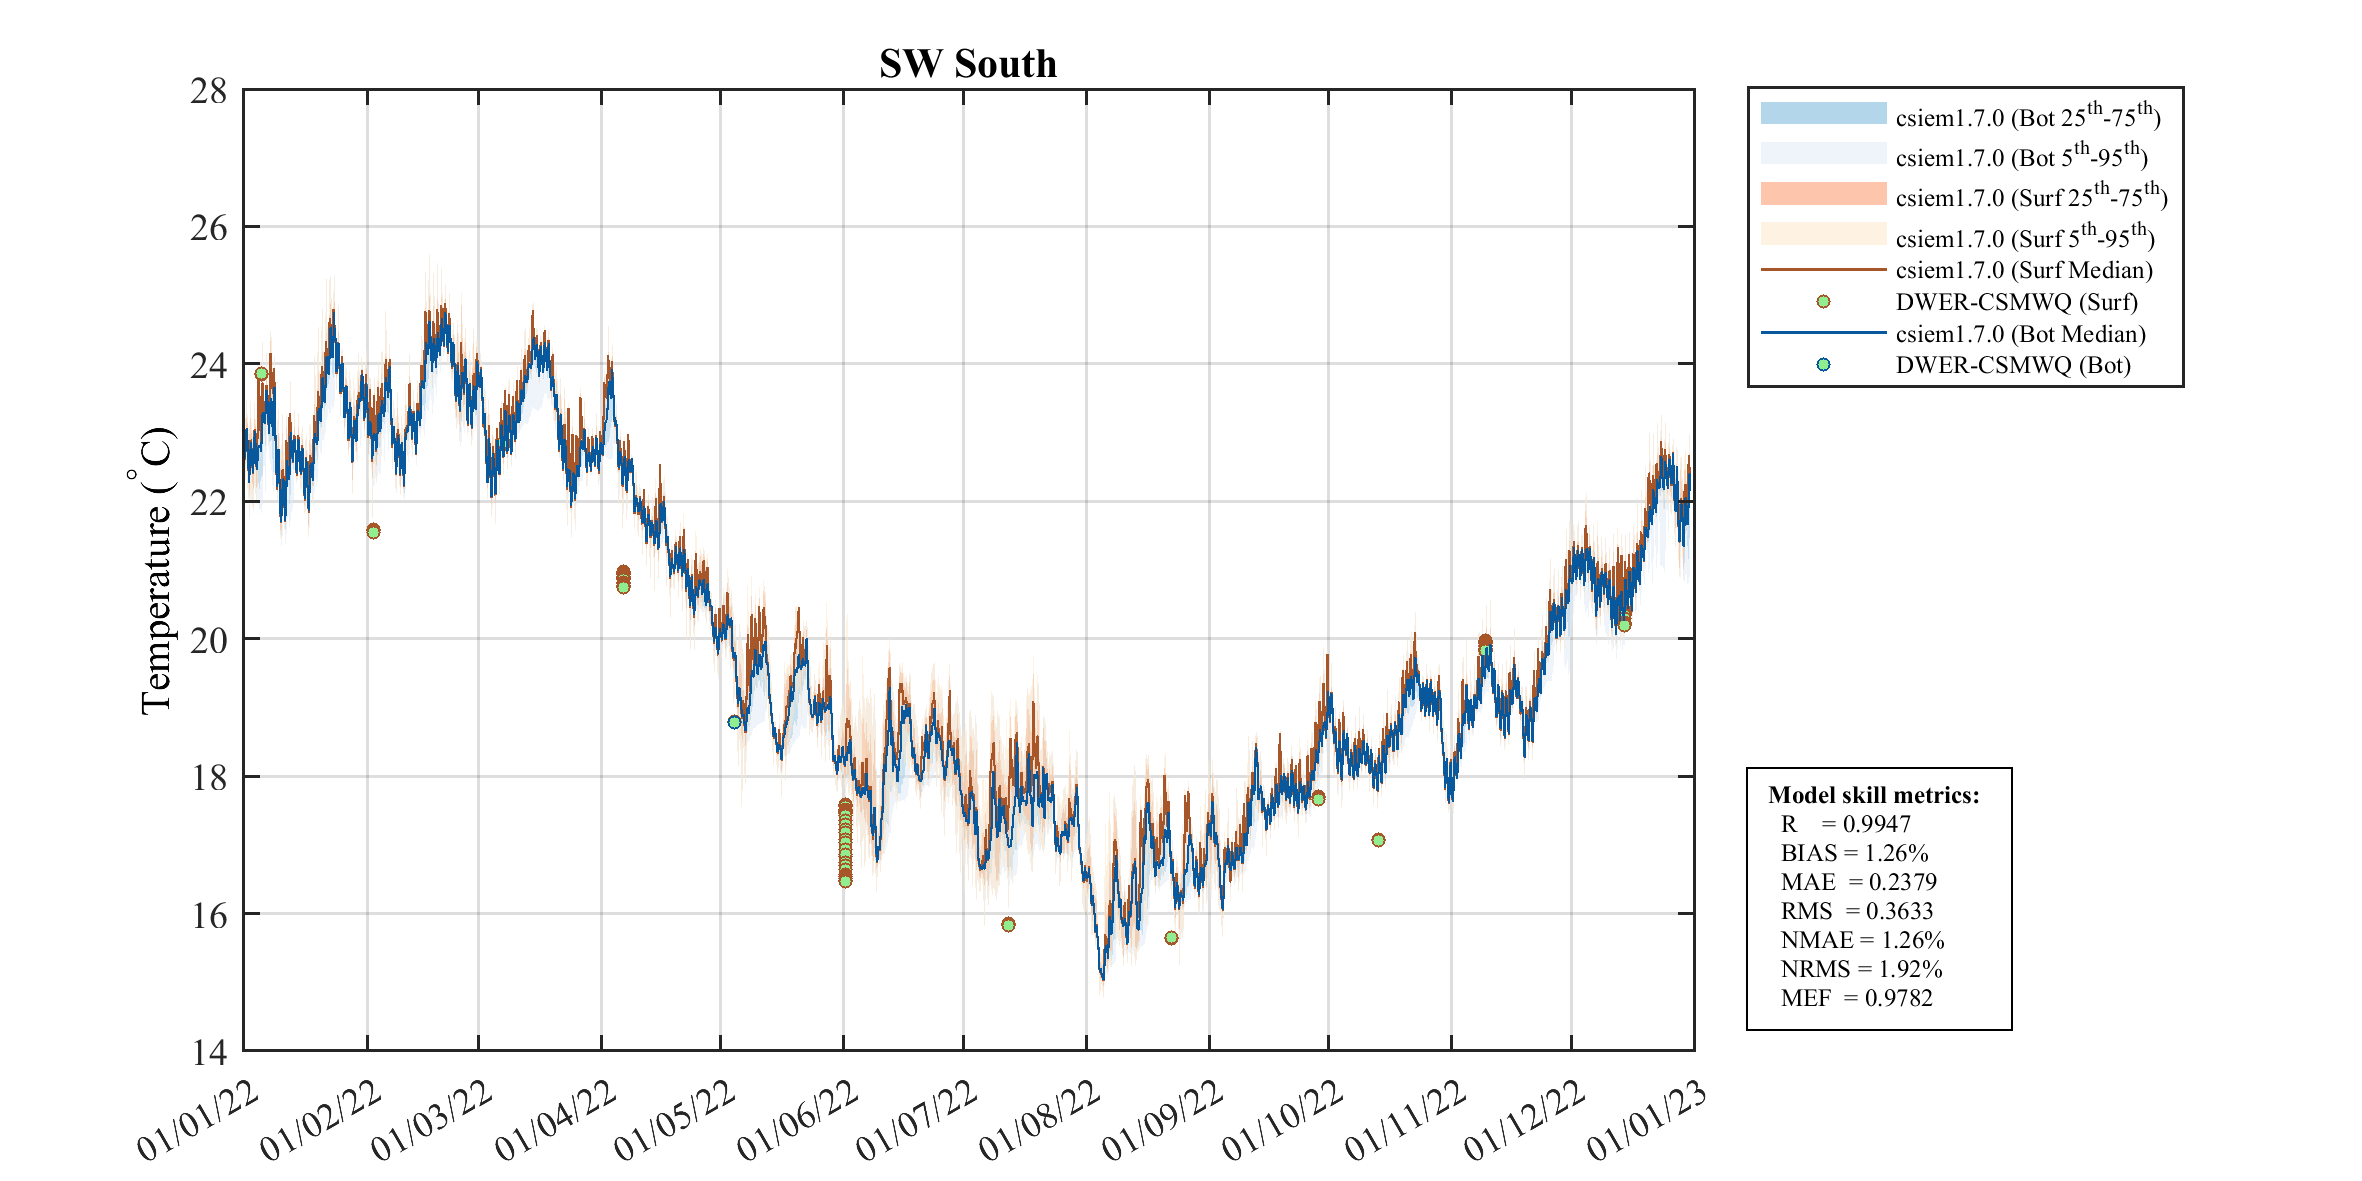
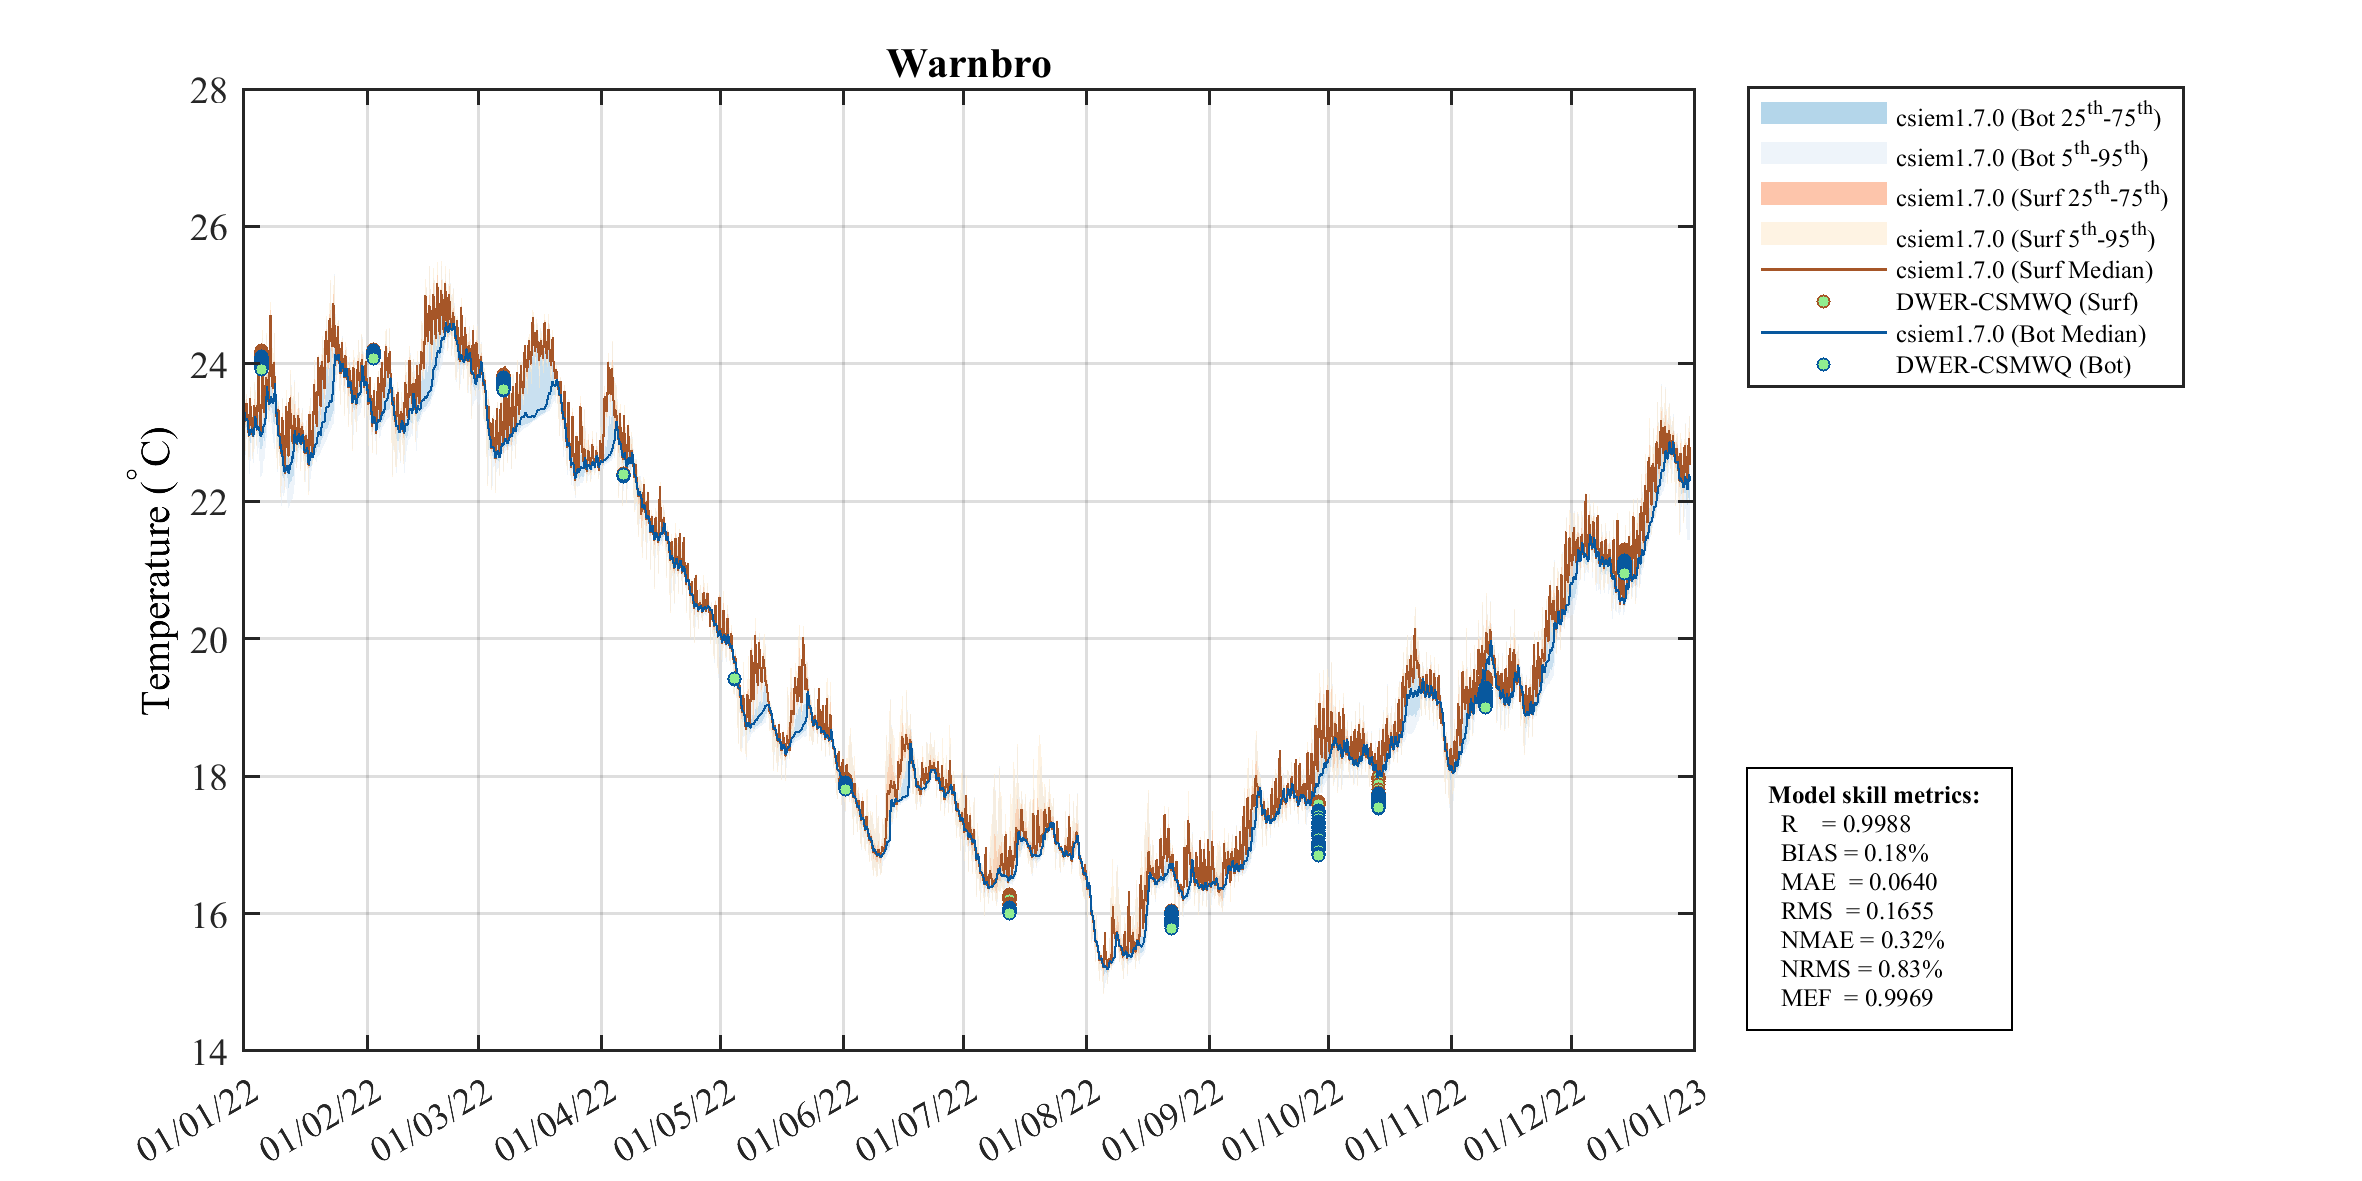
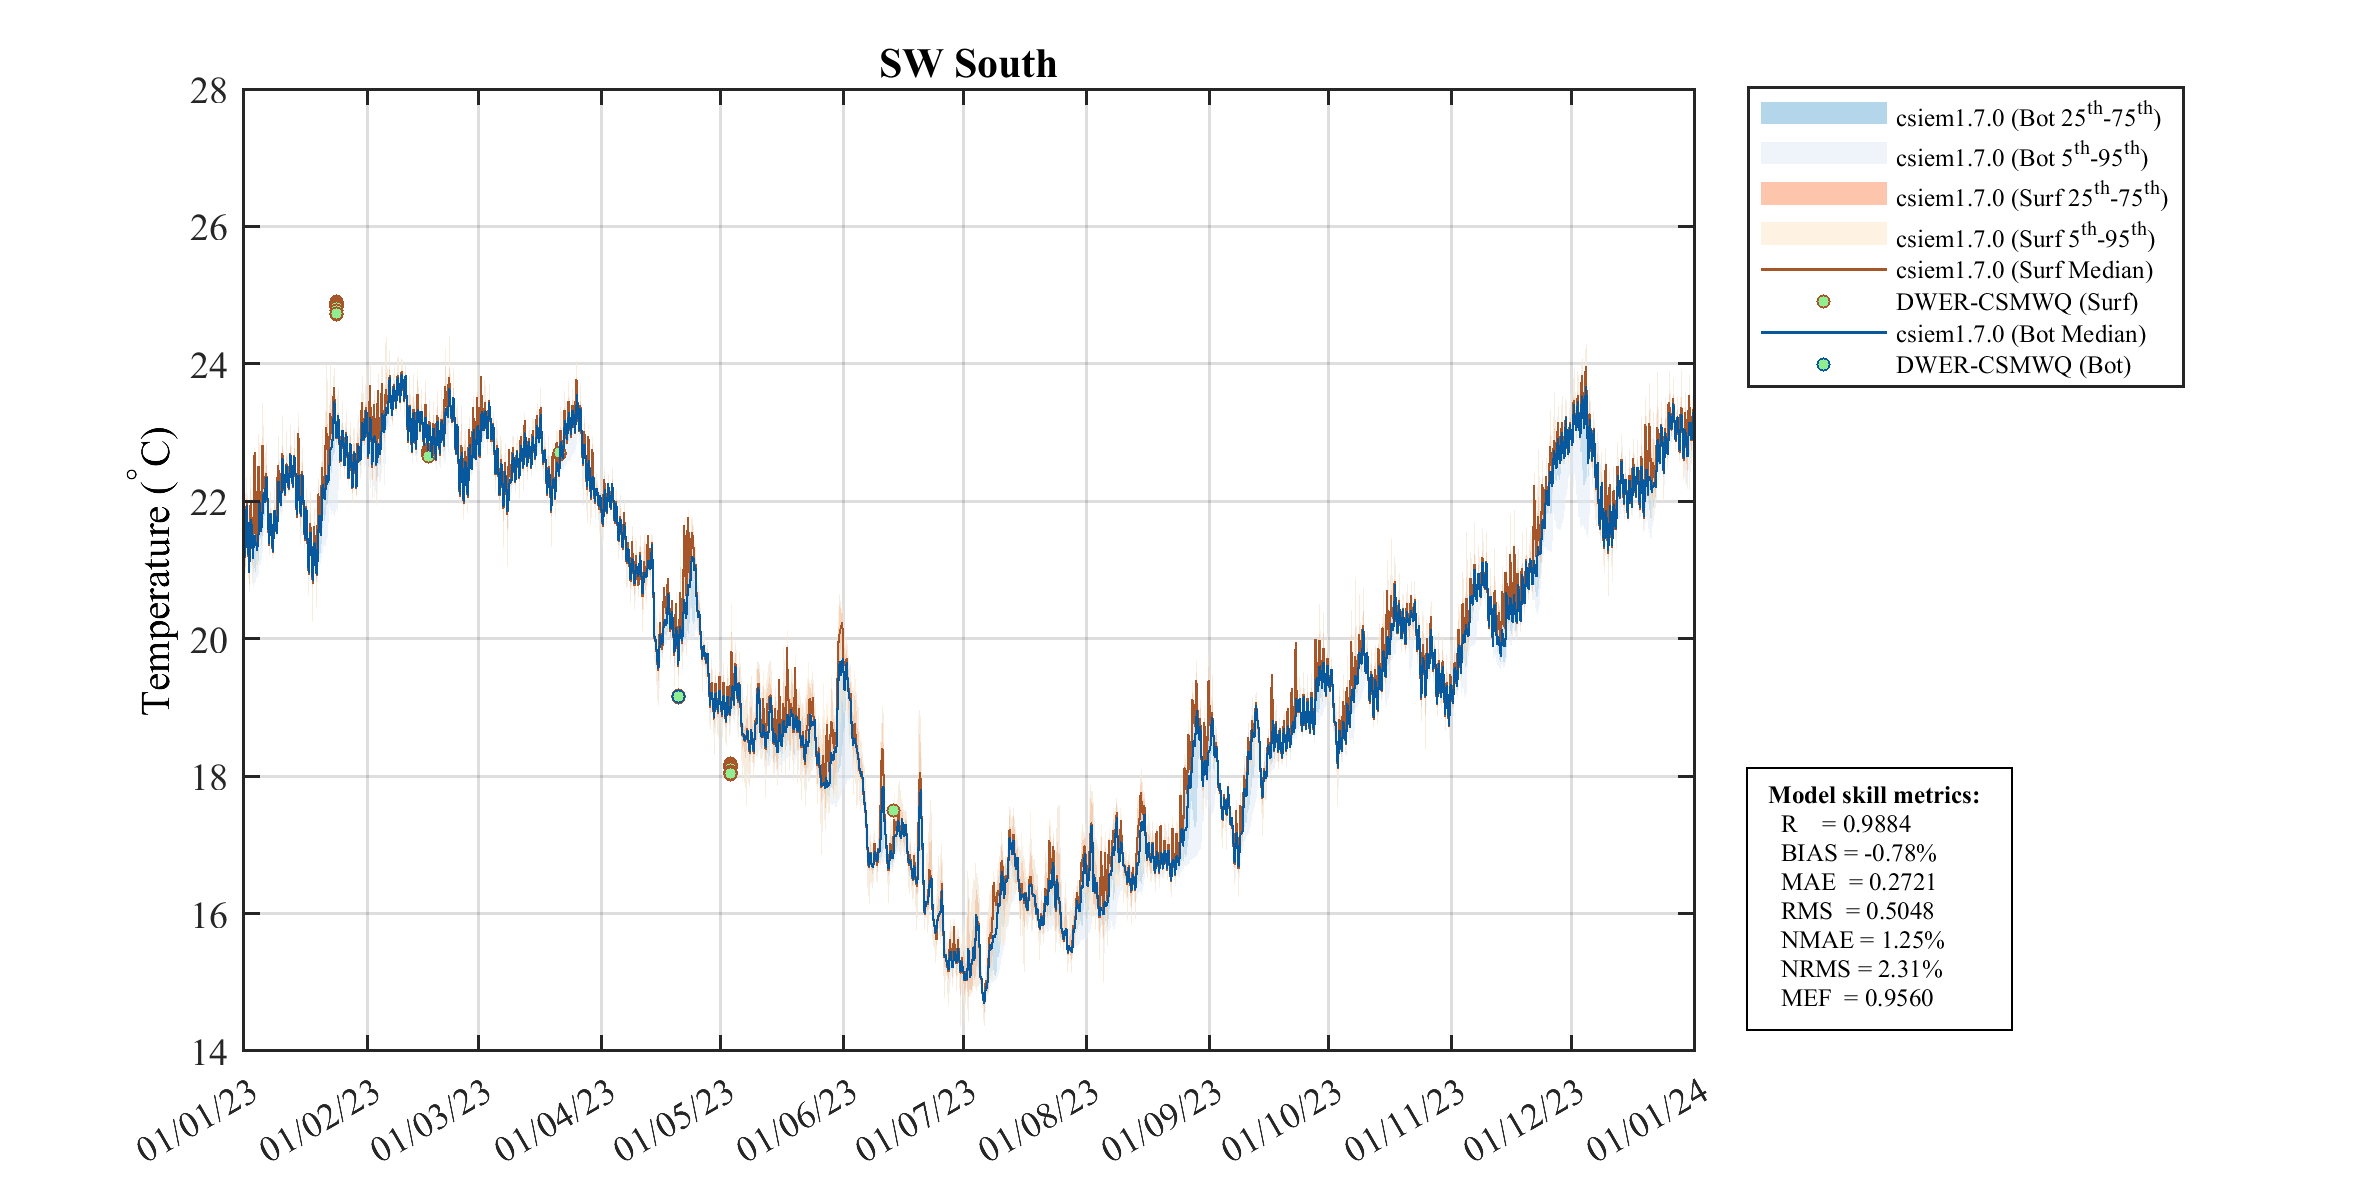
South (Warnbro, Comet Bay & Surrounds)
Assessment polygons for South (Warnbro, Comet Bay & Surrounds)
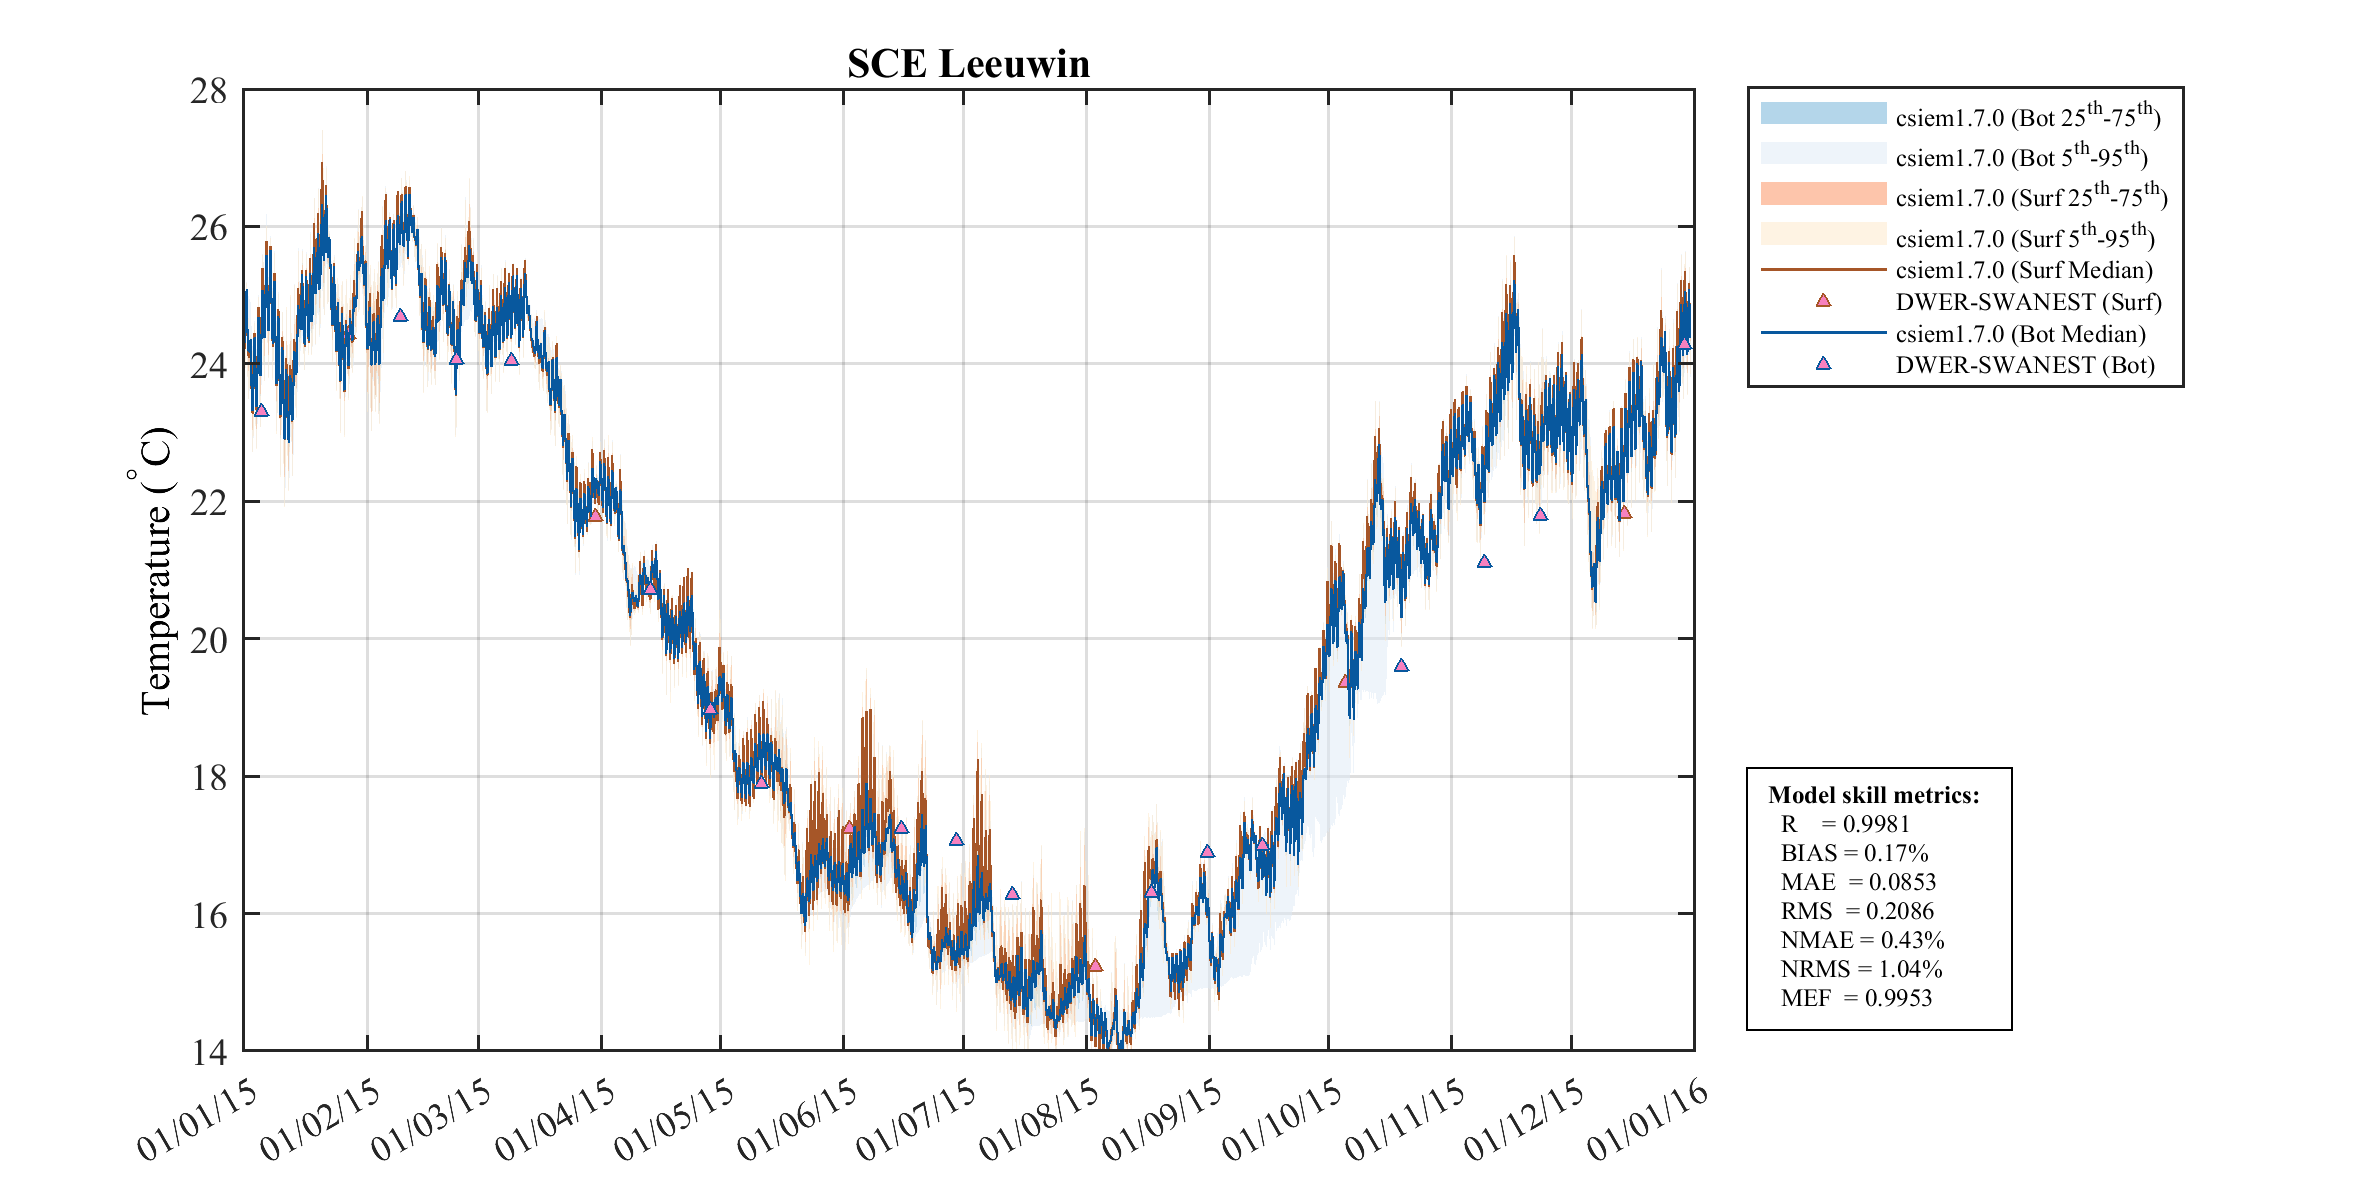
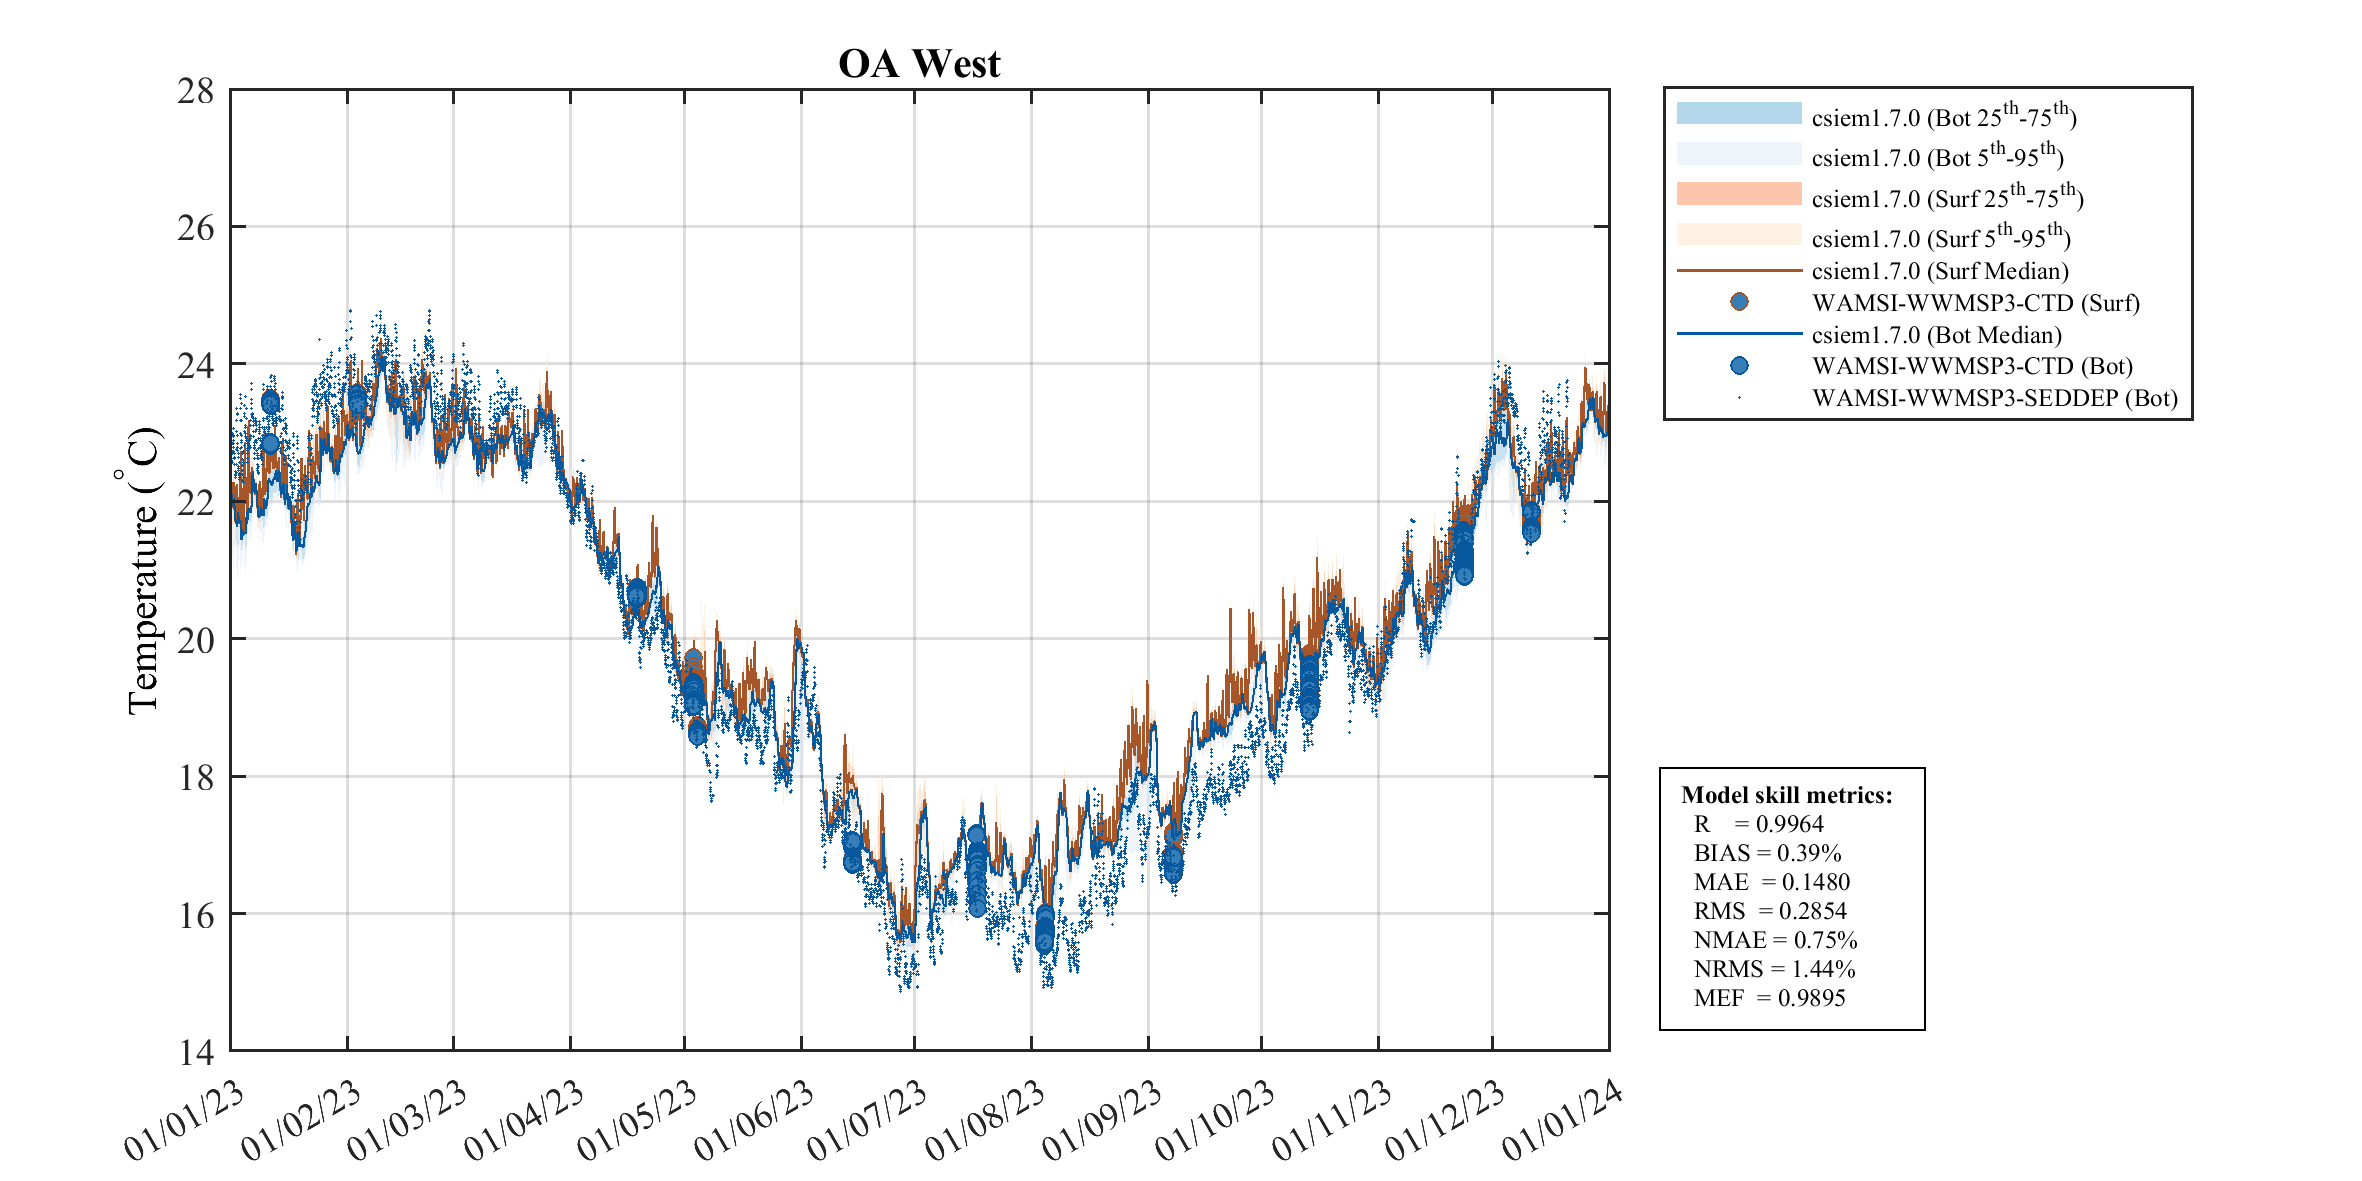
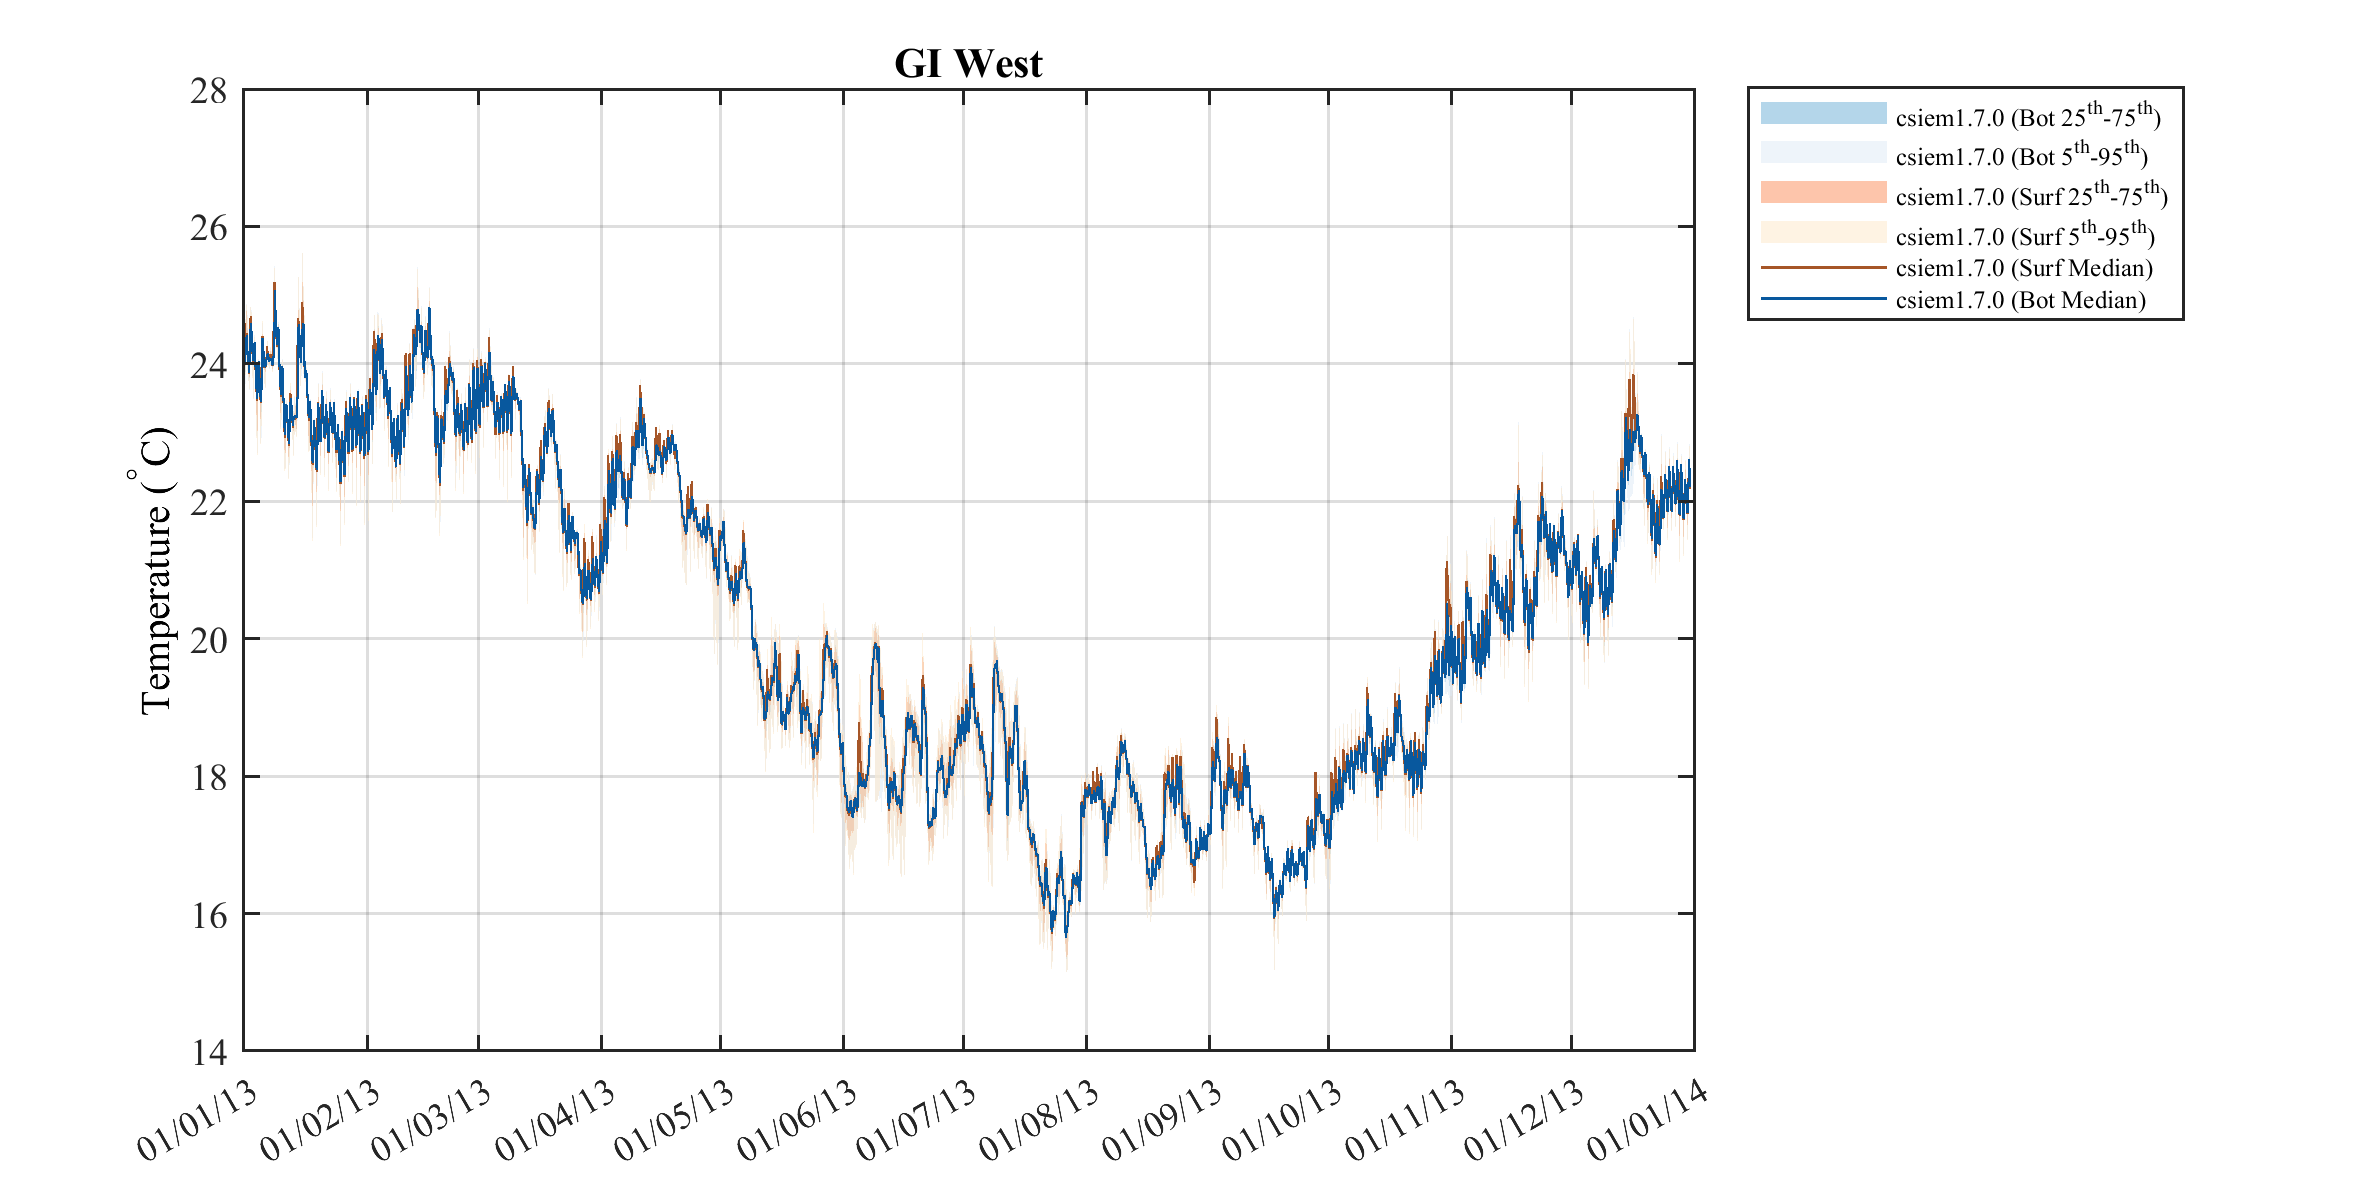
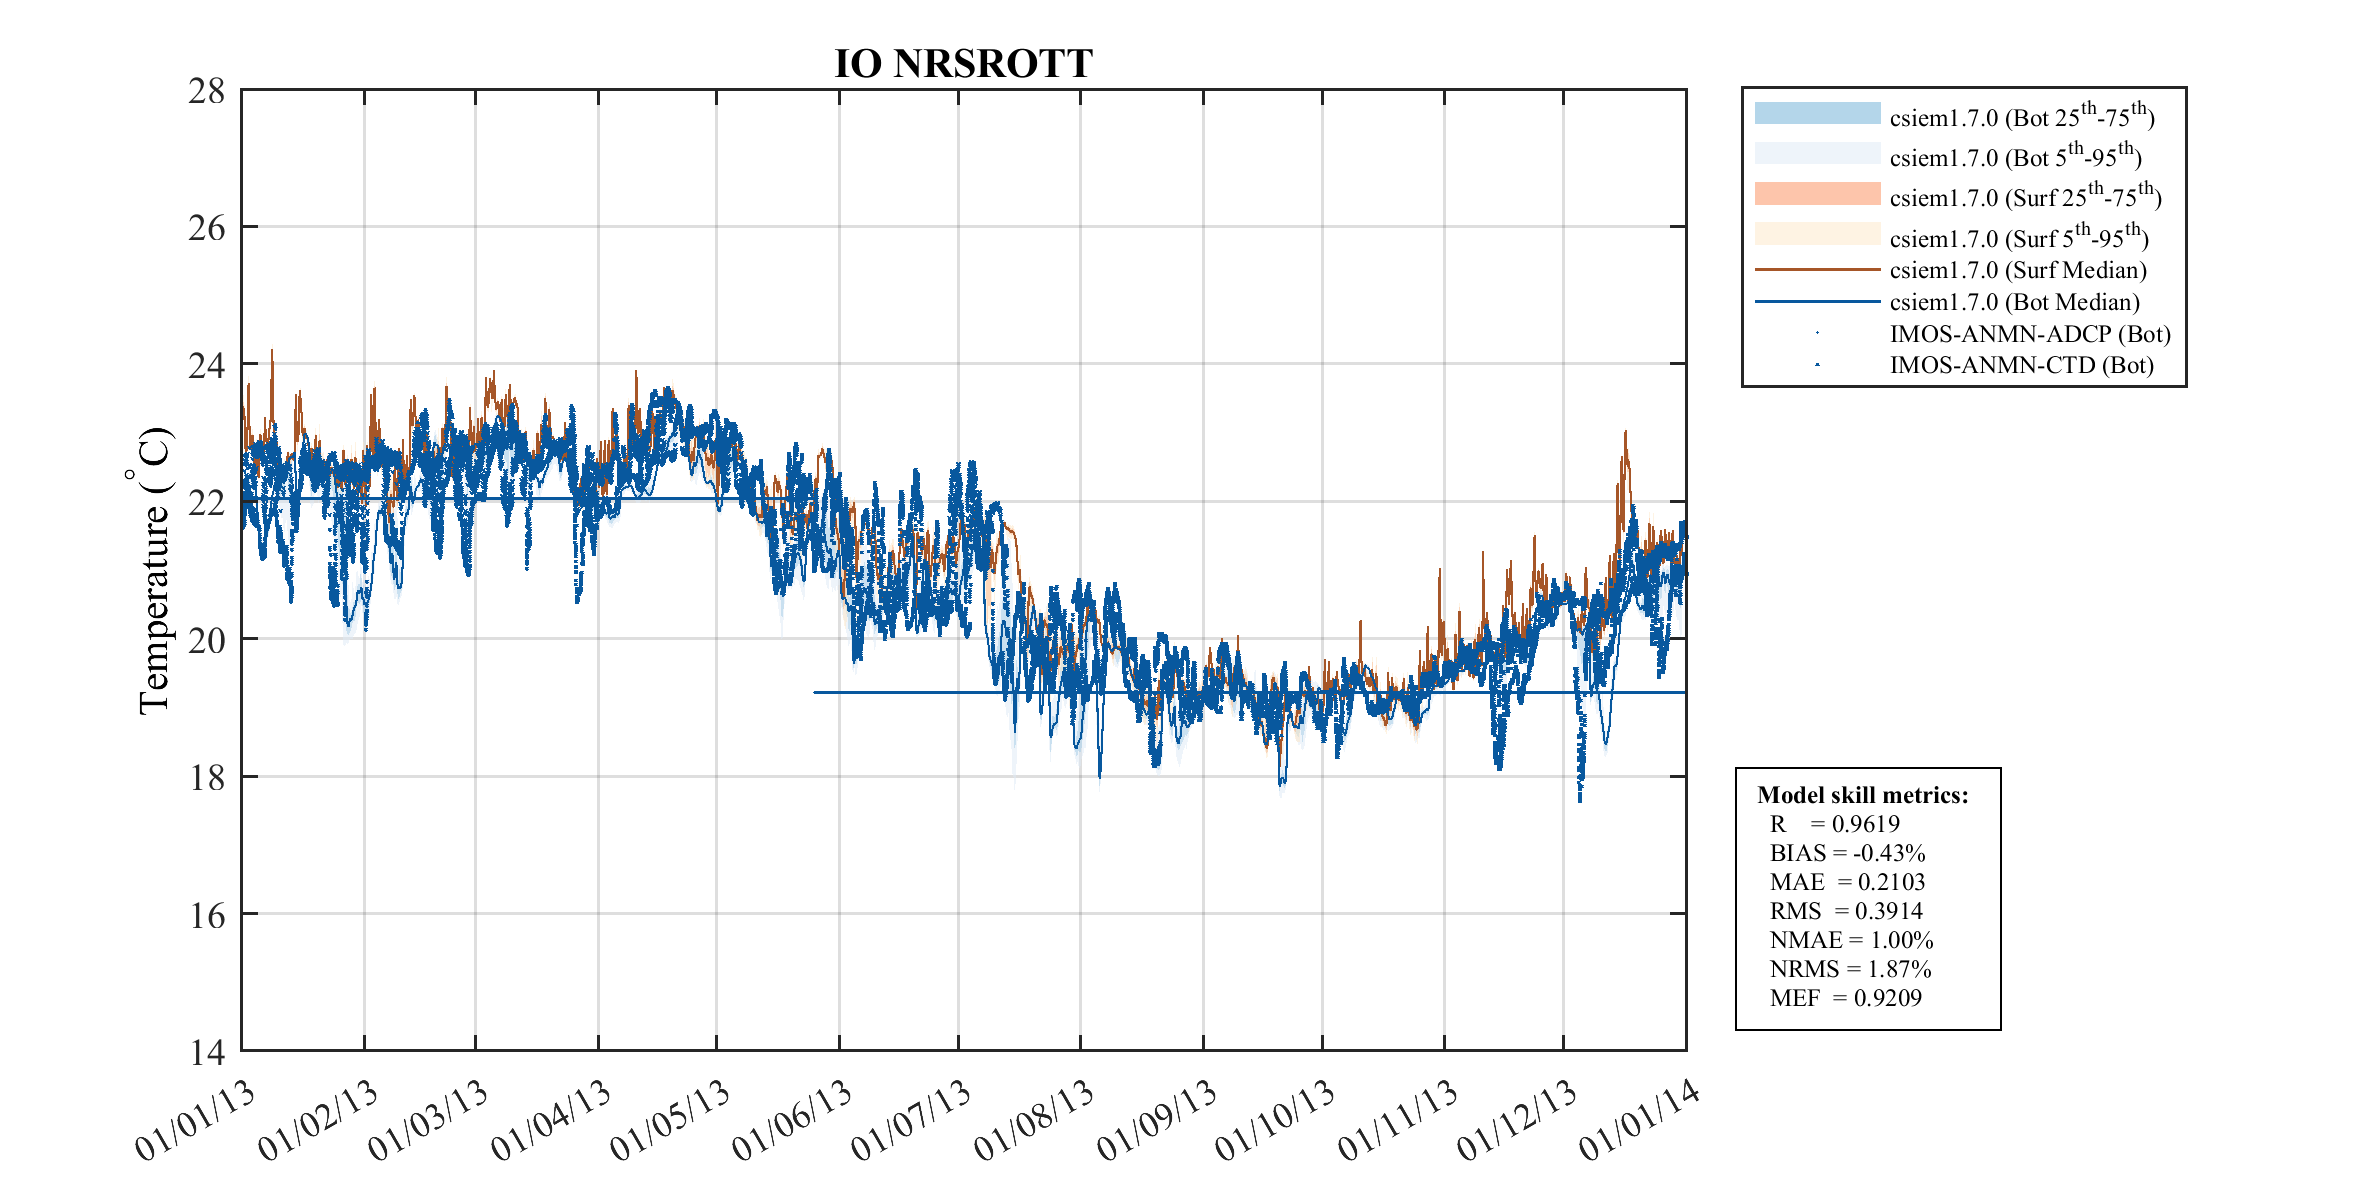
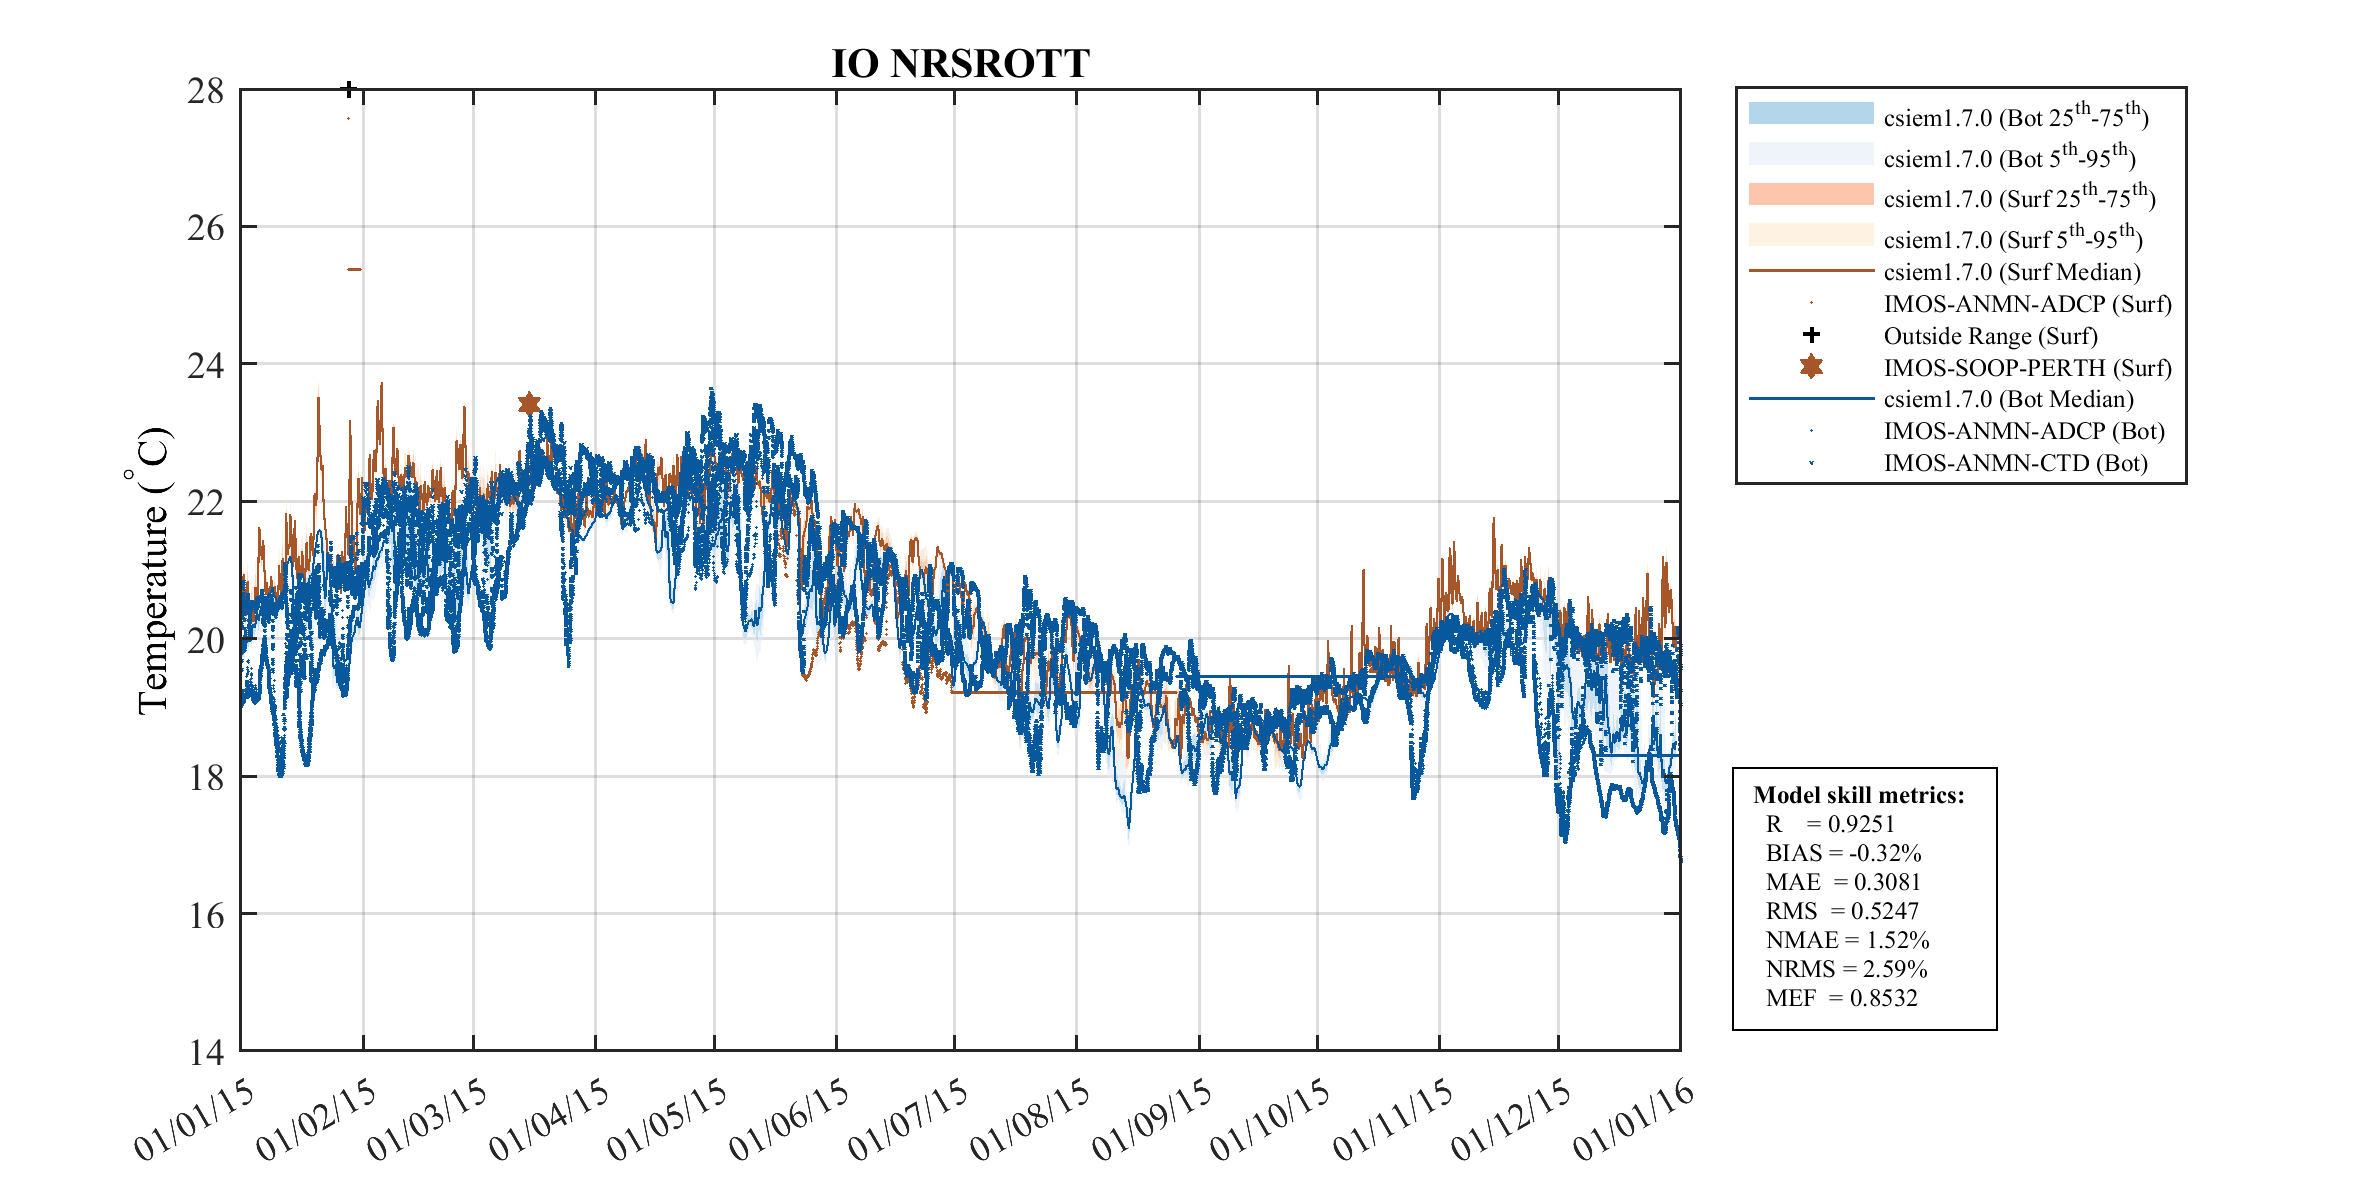
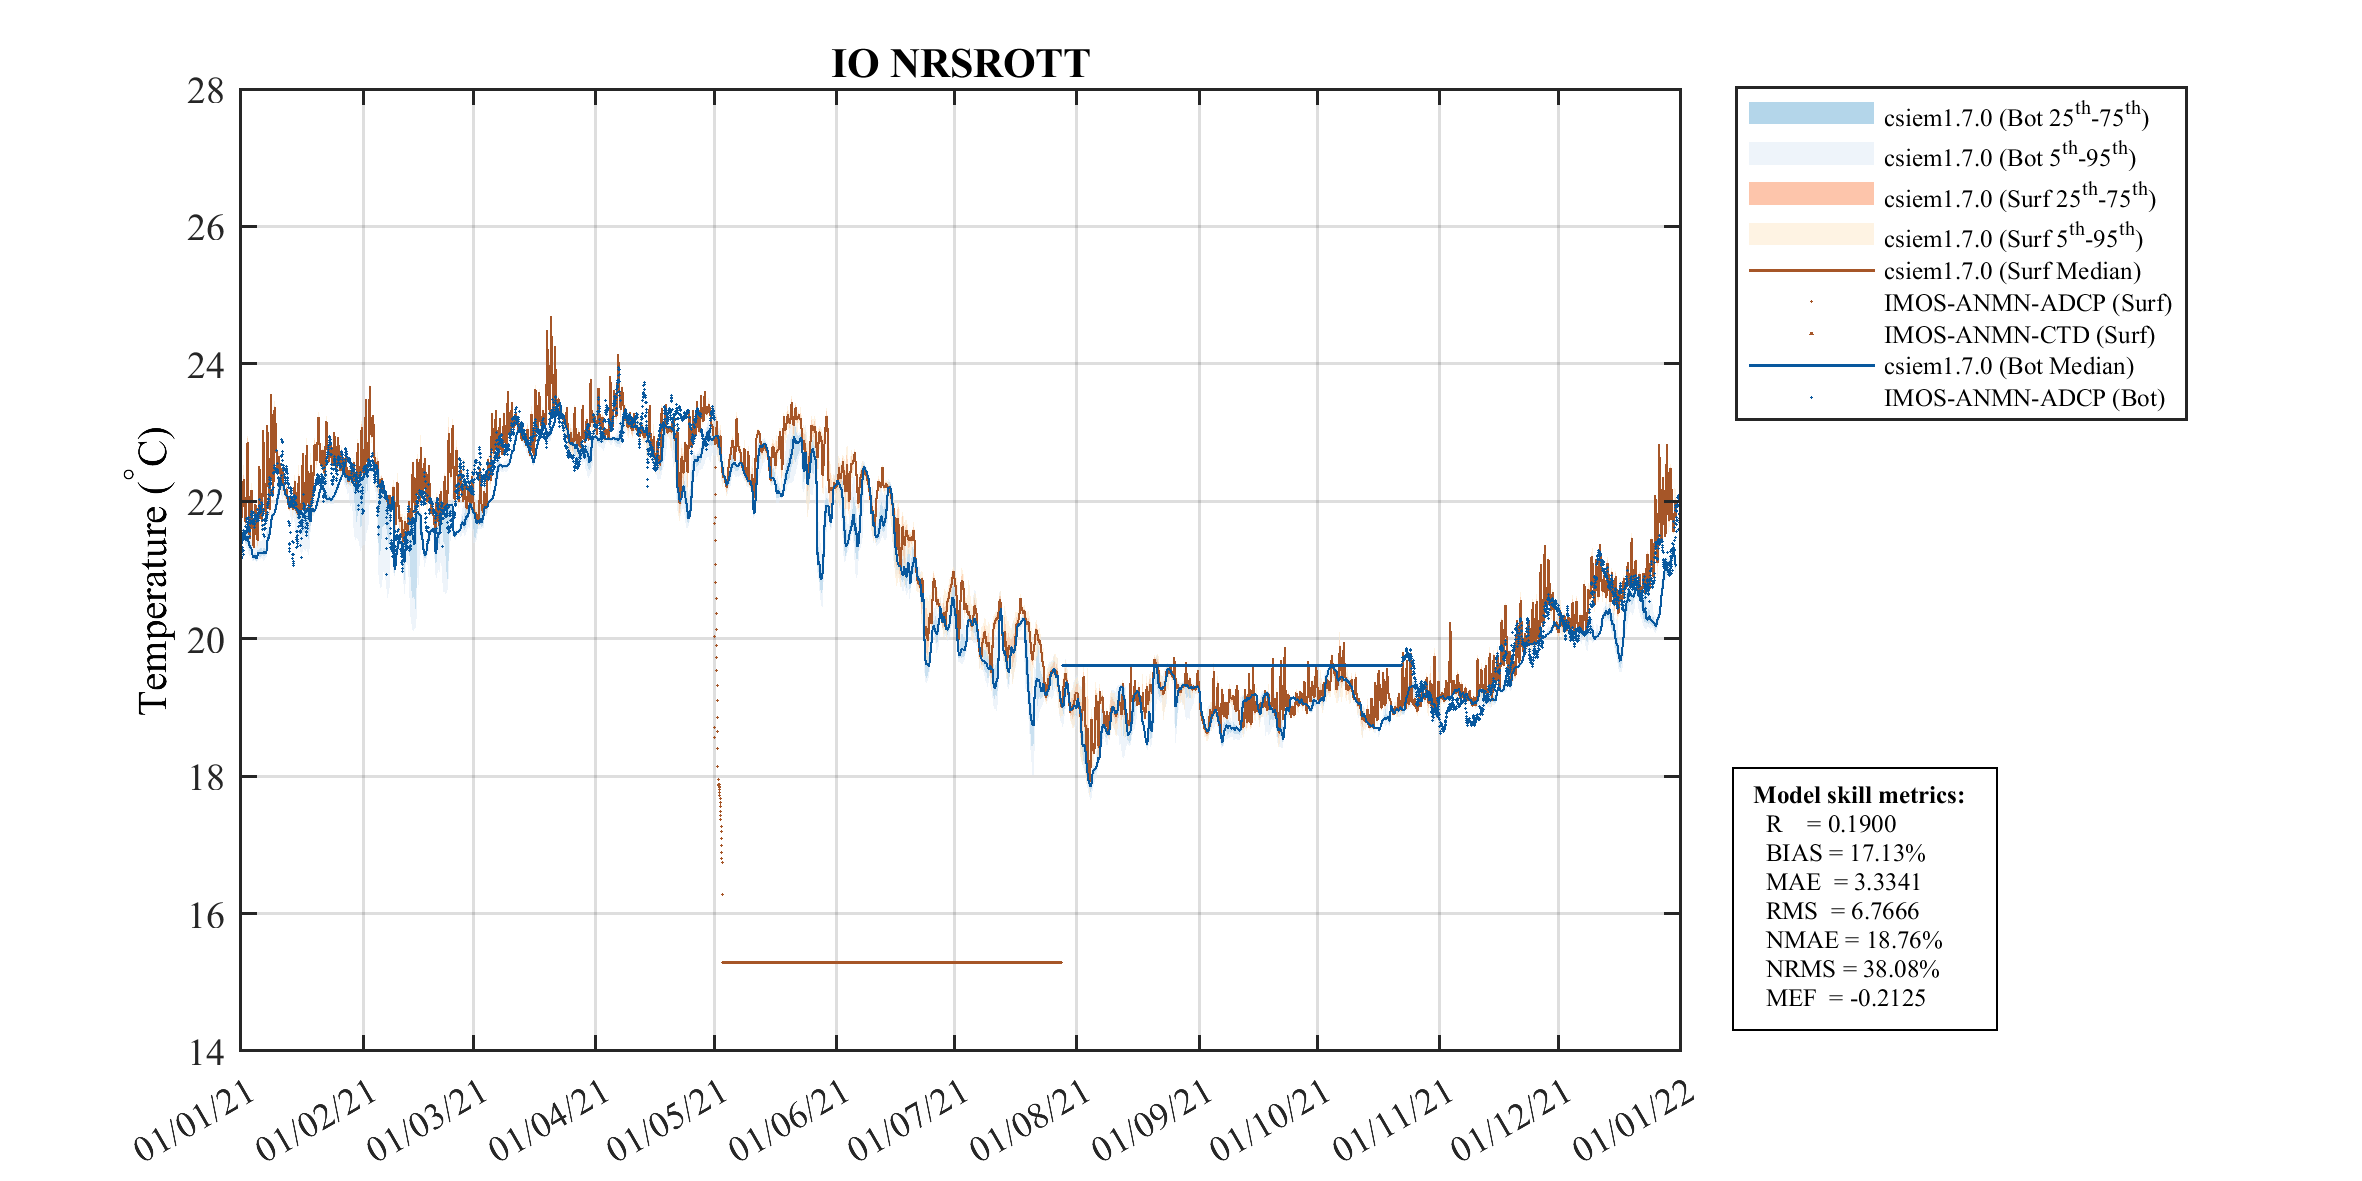
West (Rottnest)
Assessment polygons for West (Rottnest)
NO VALIDATION DATA
NO VALIDATION DATA
NO VALIDATION DATA
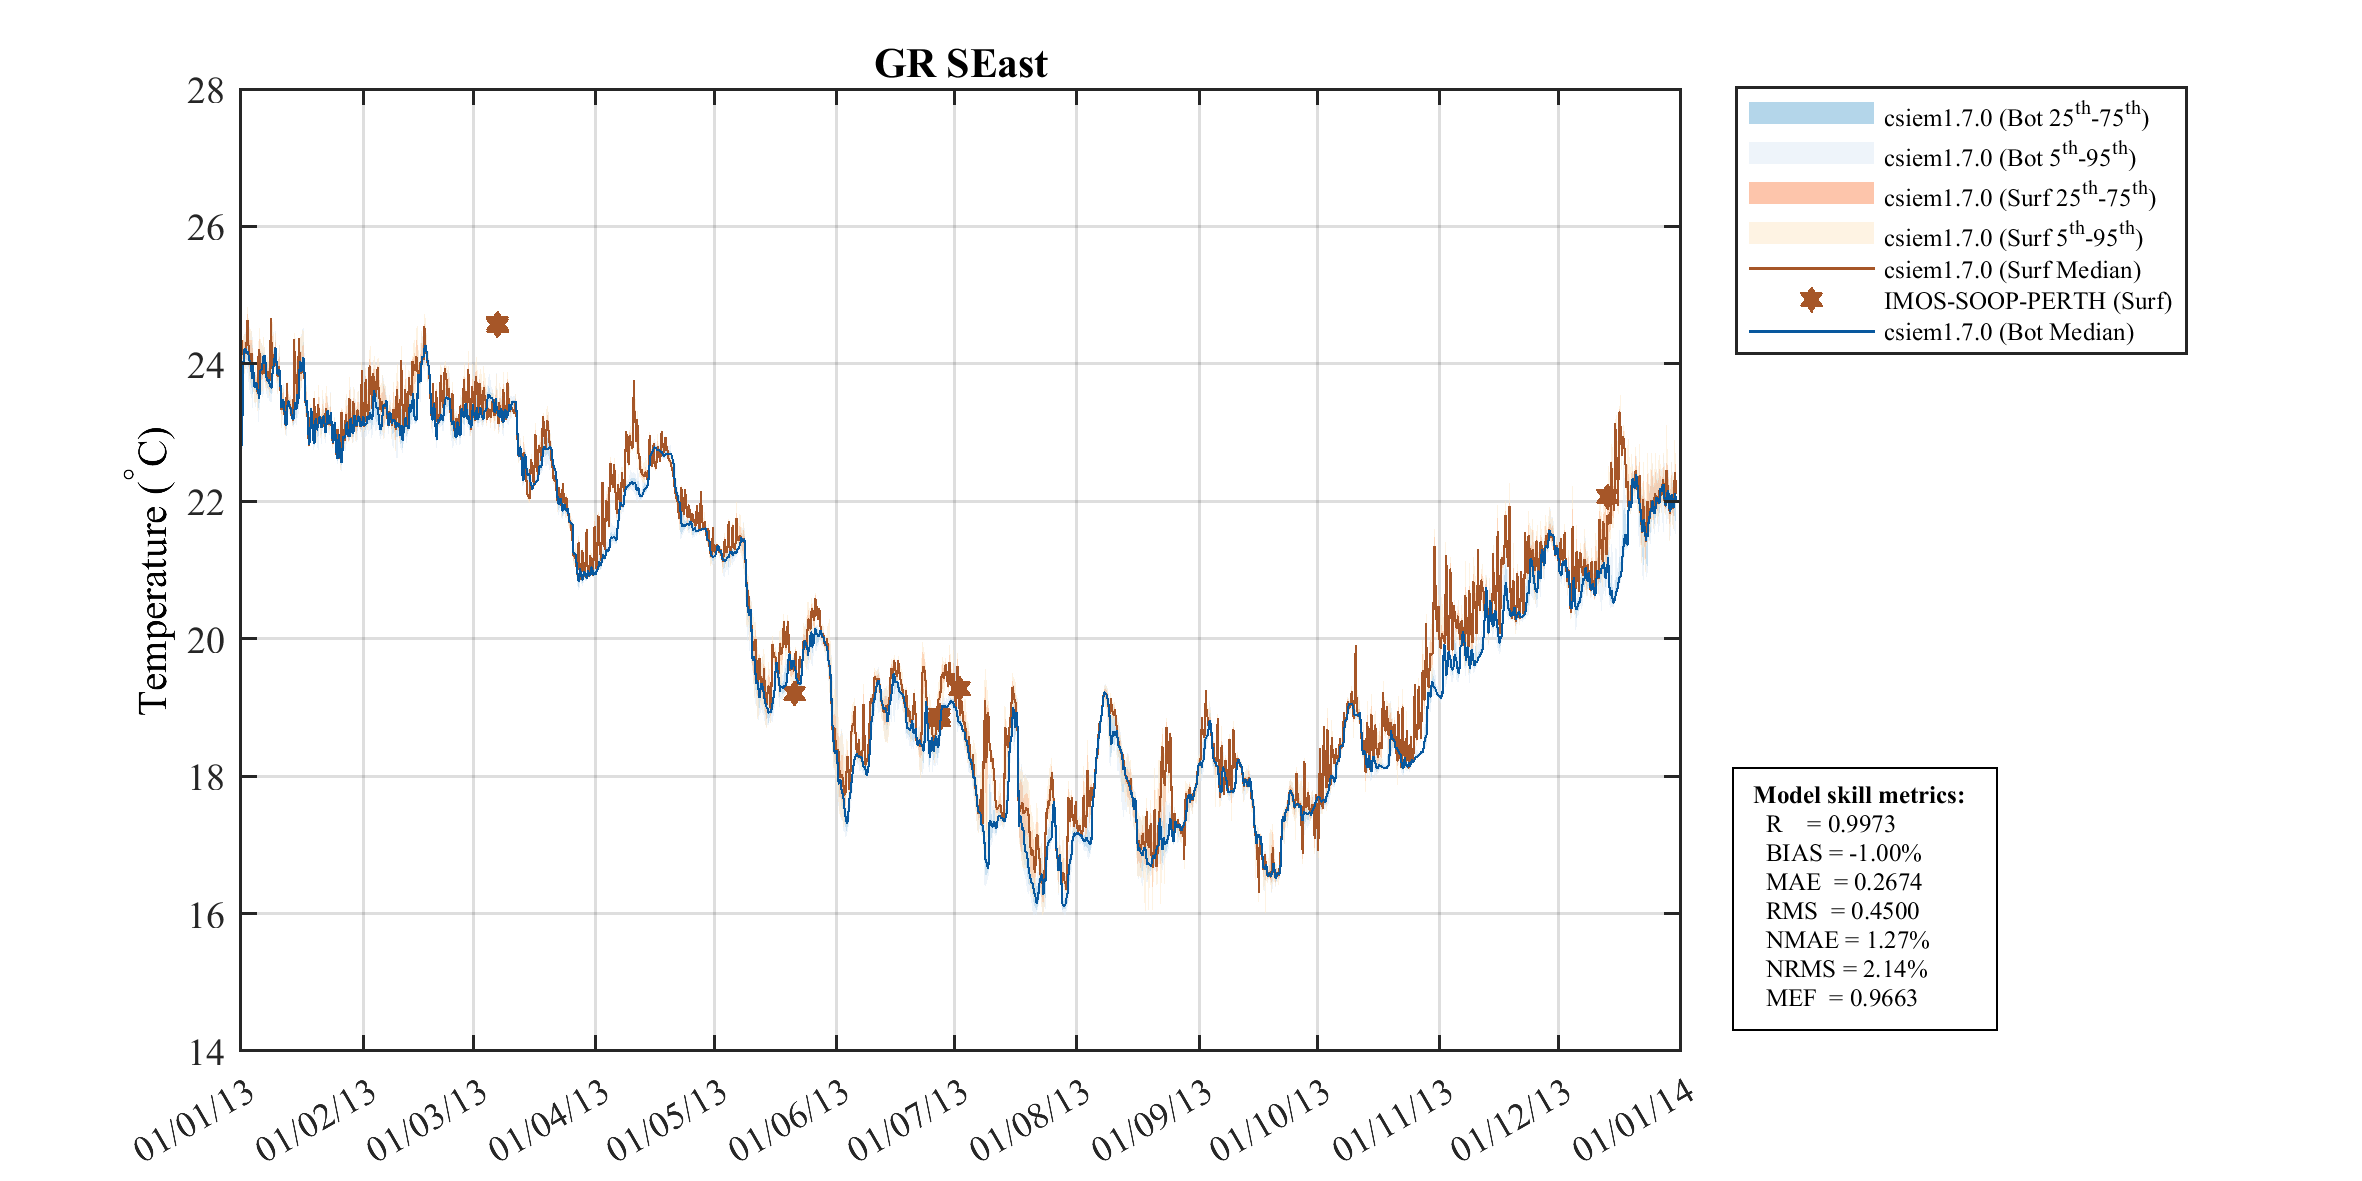
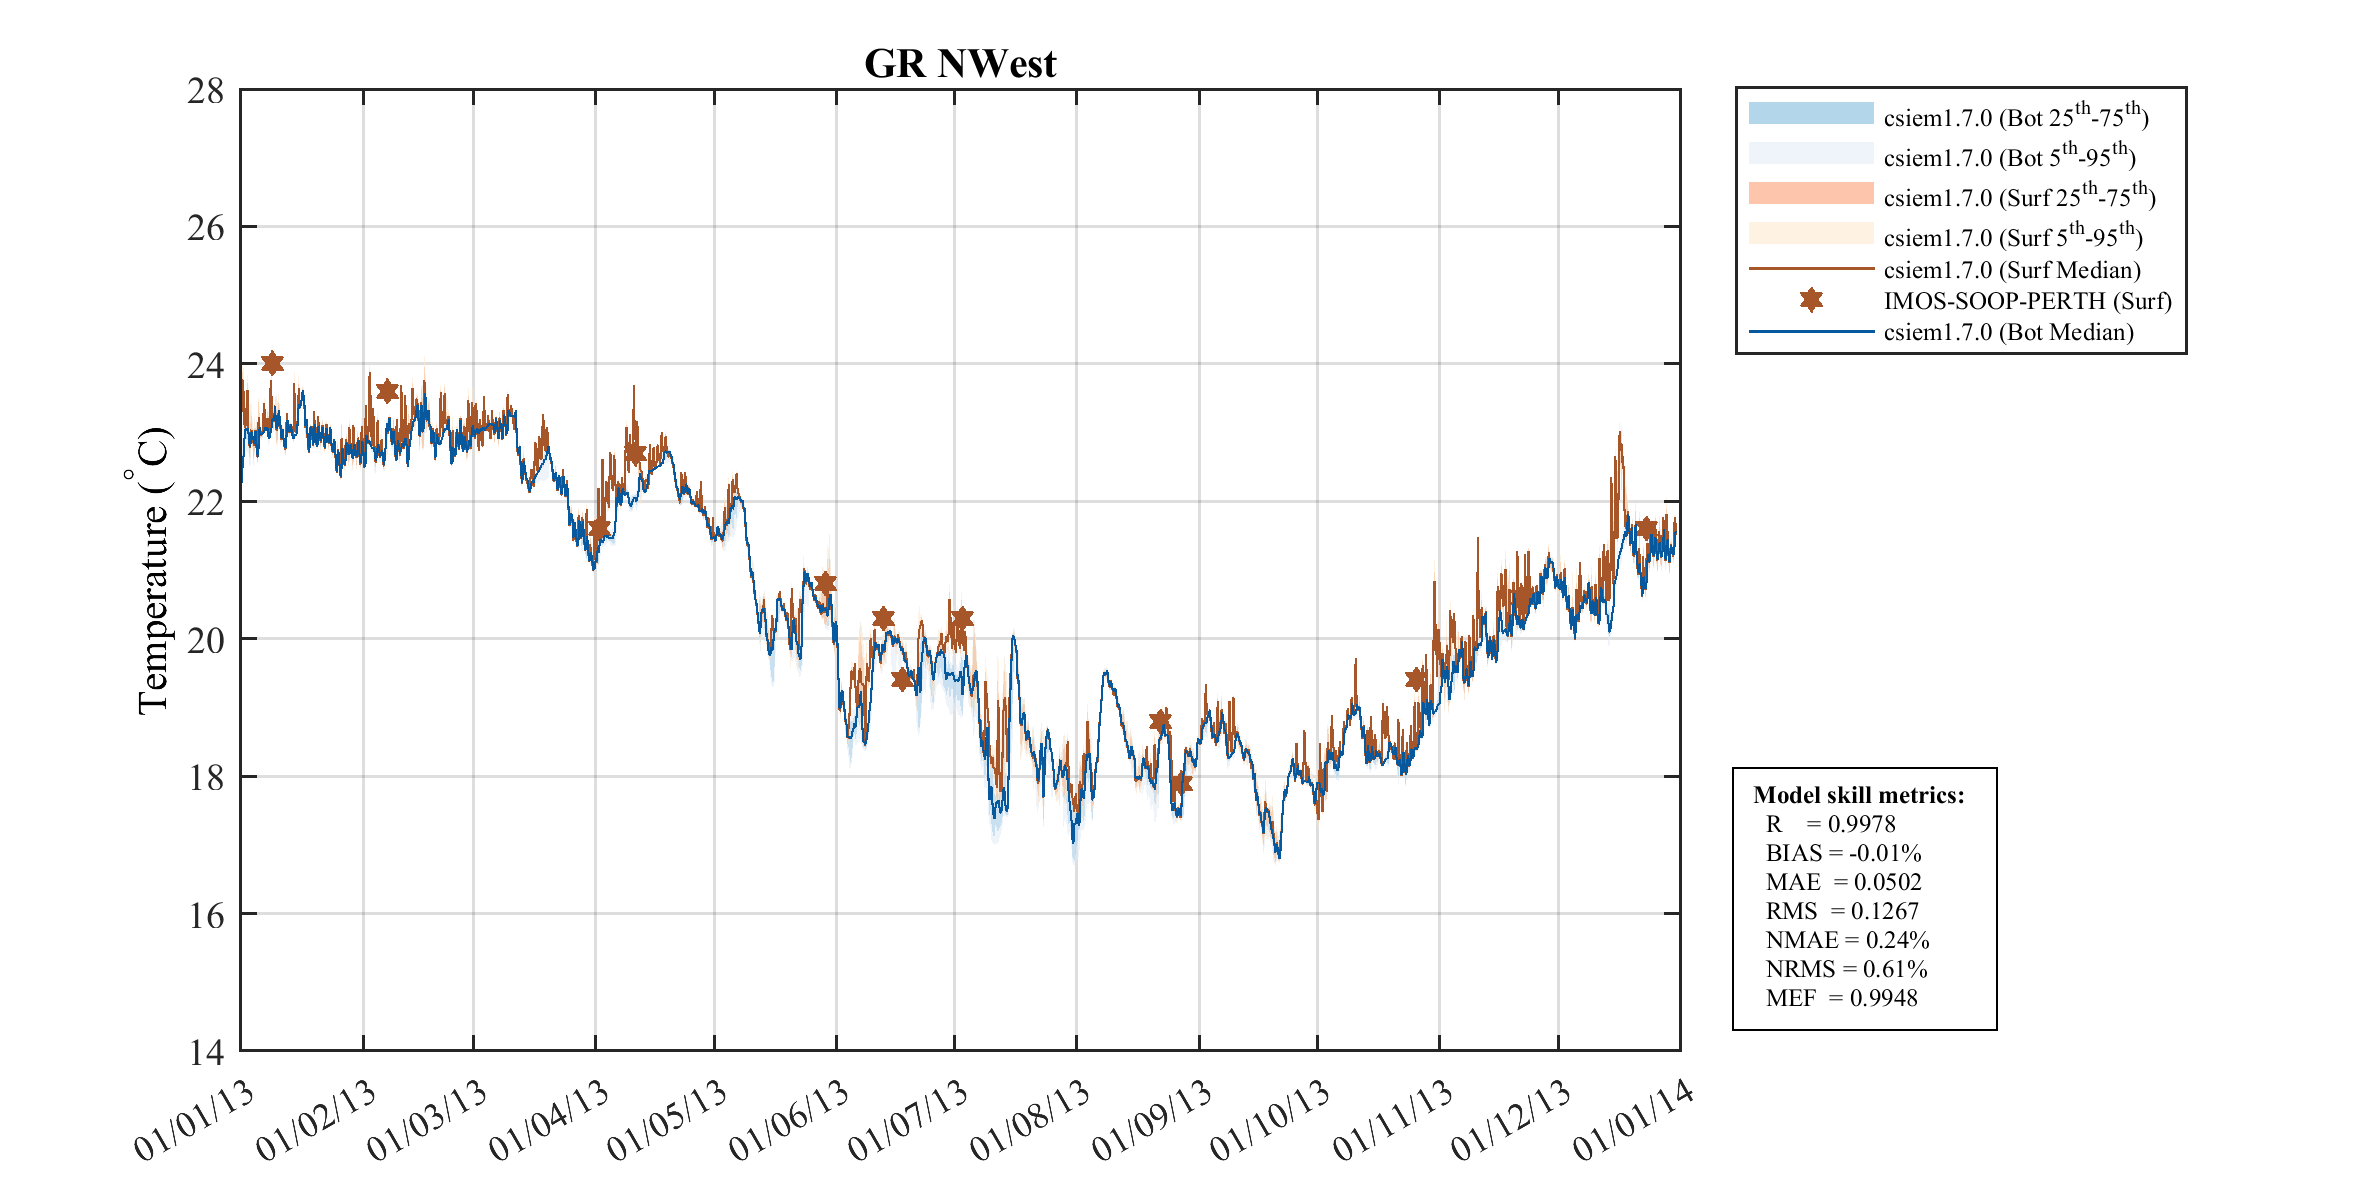
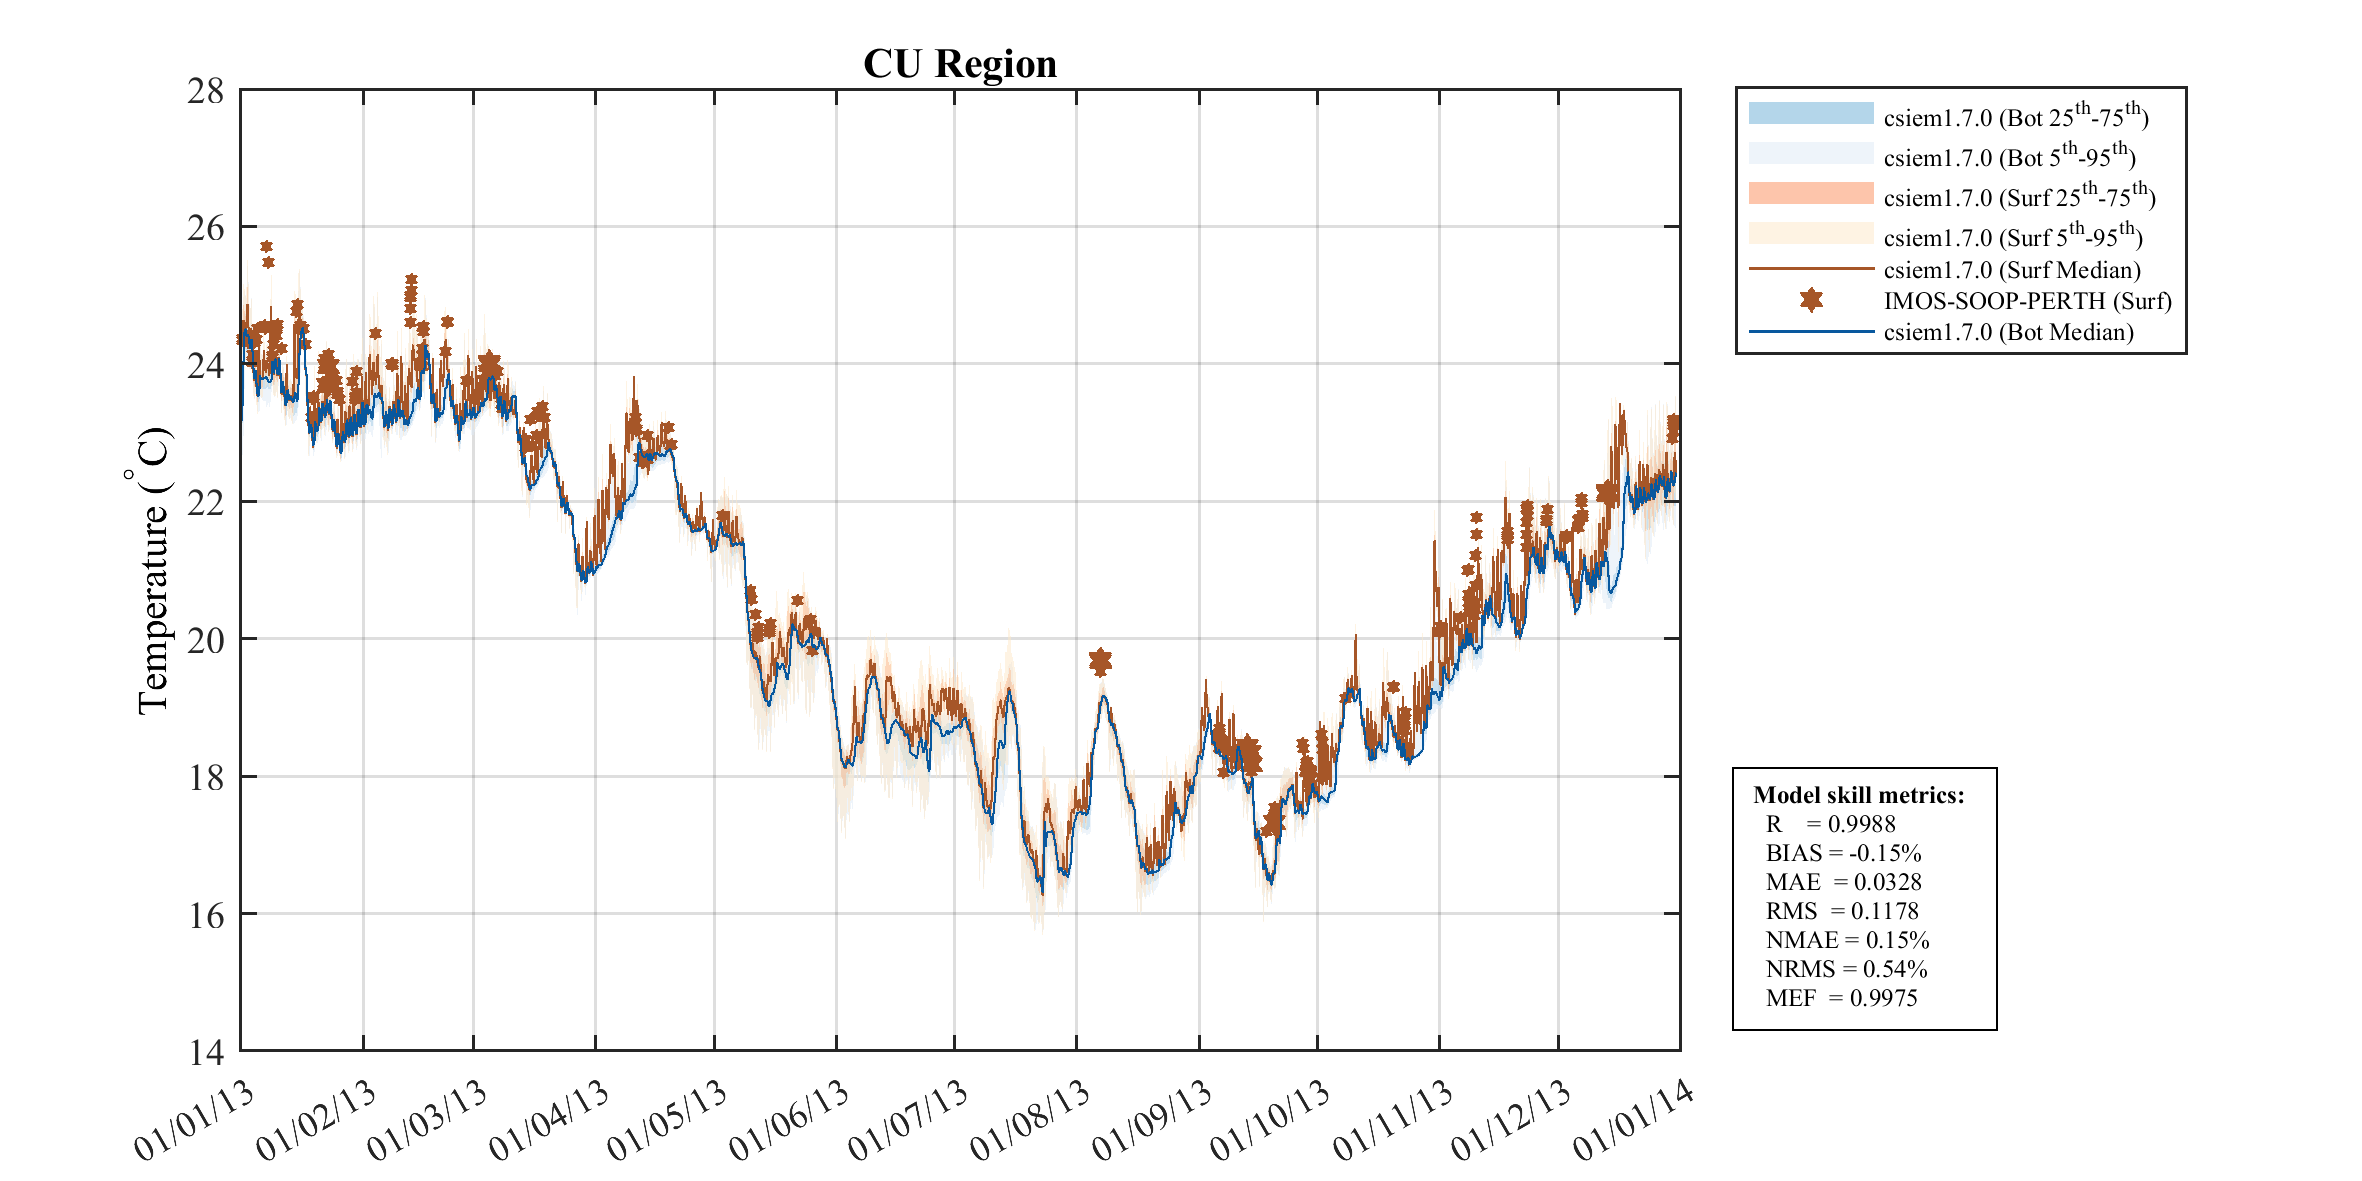
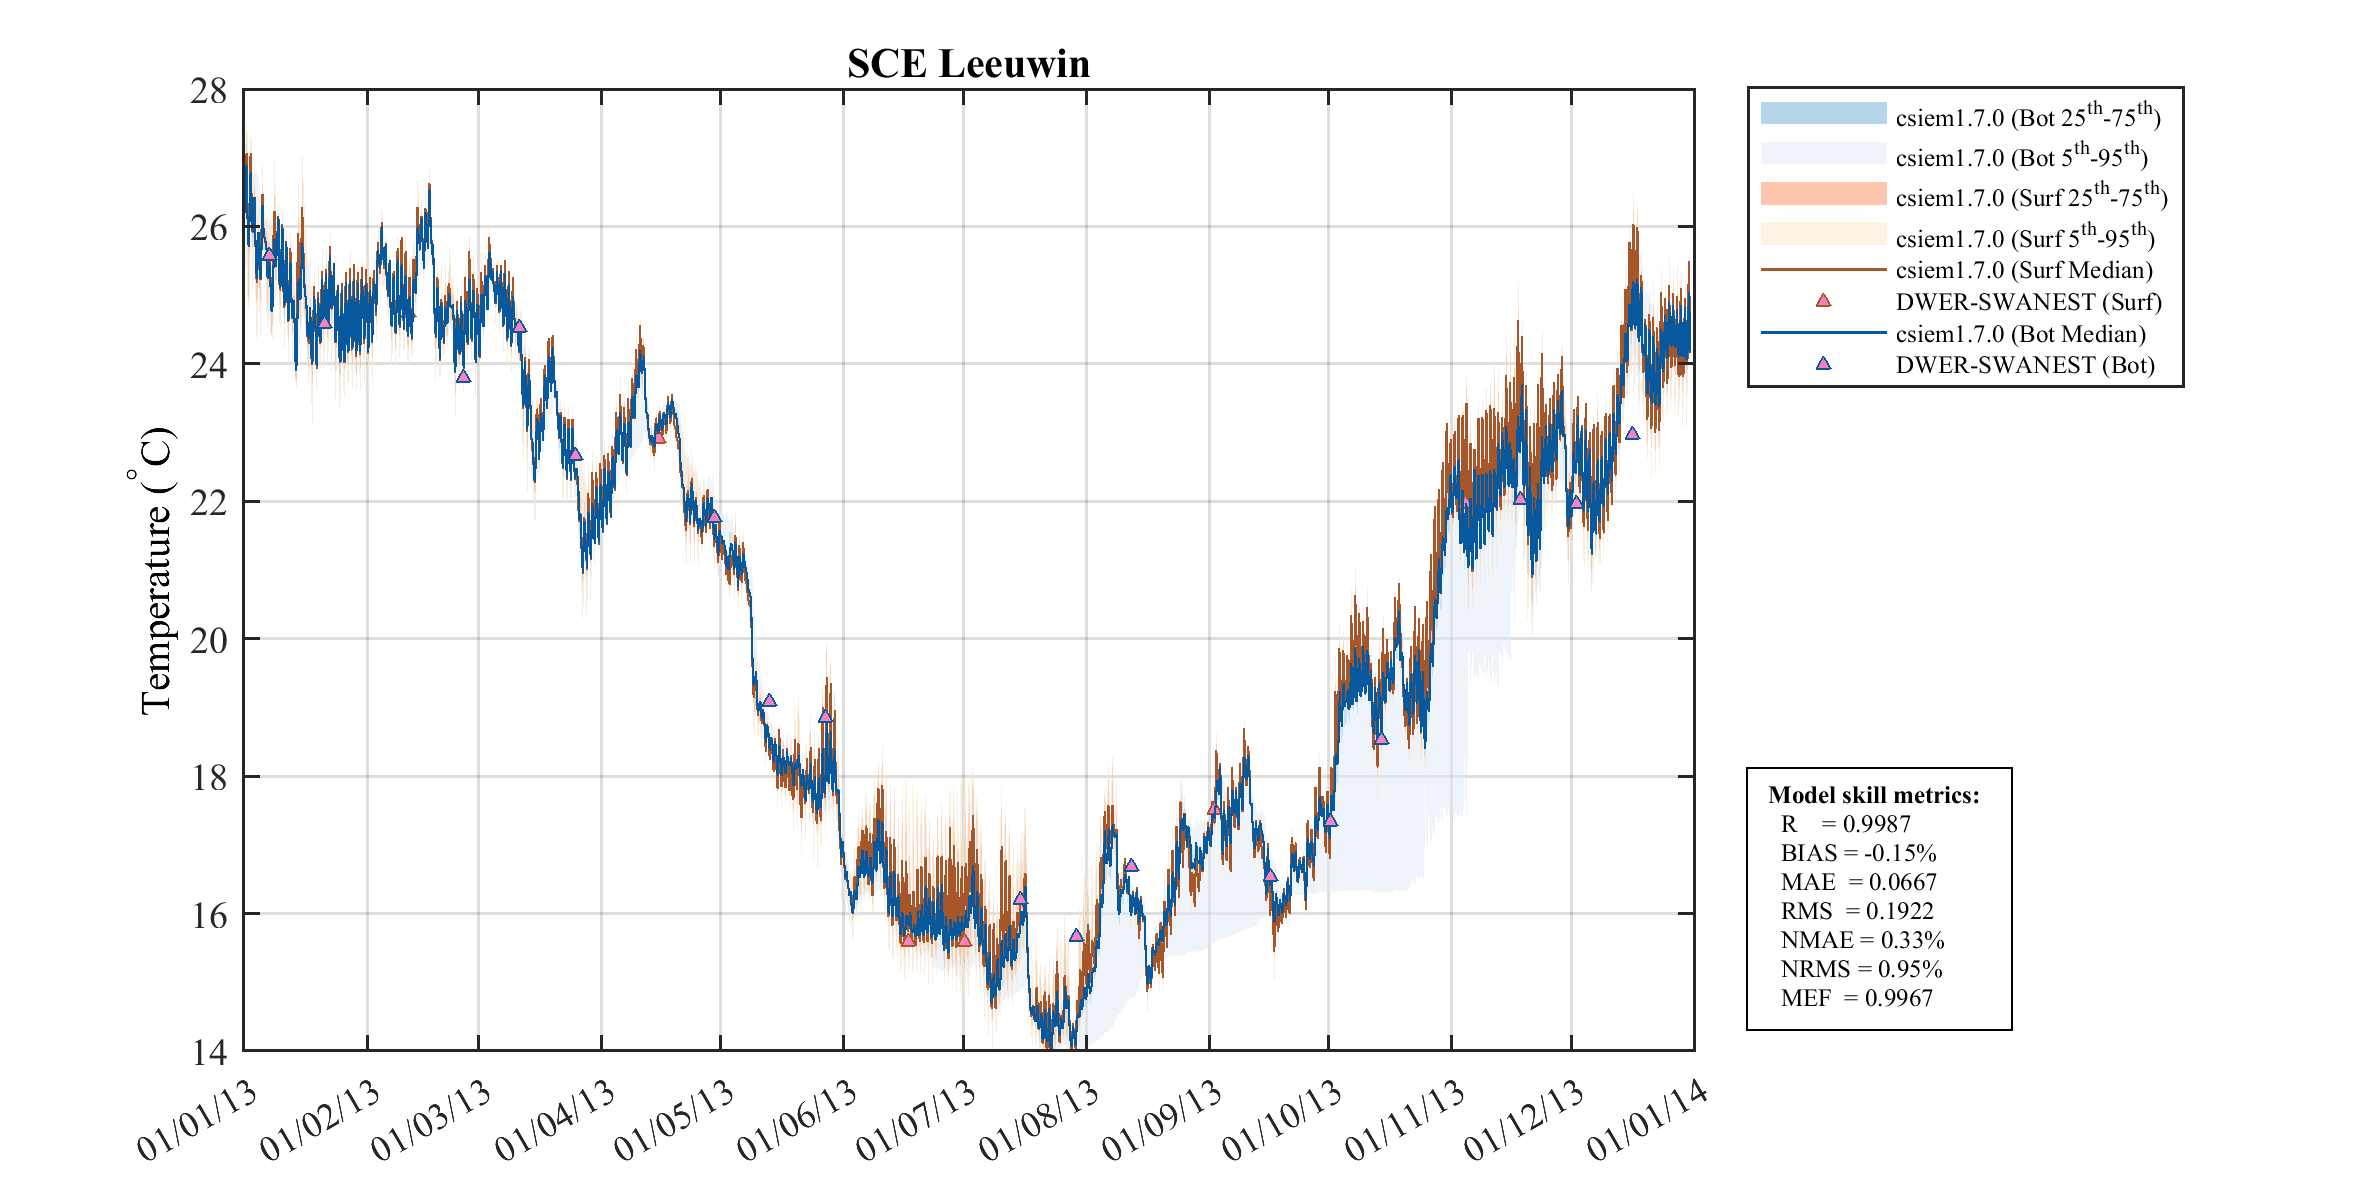
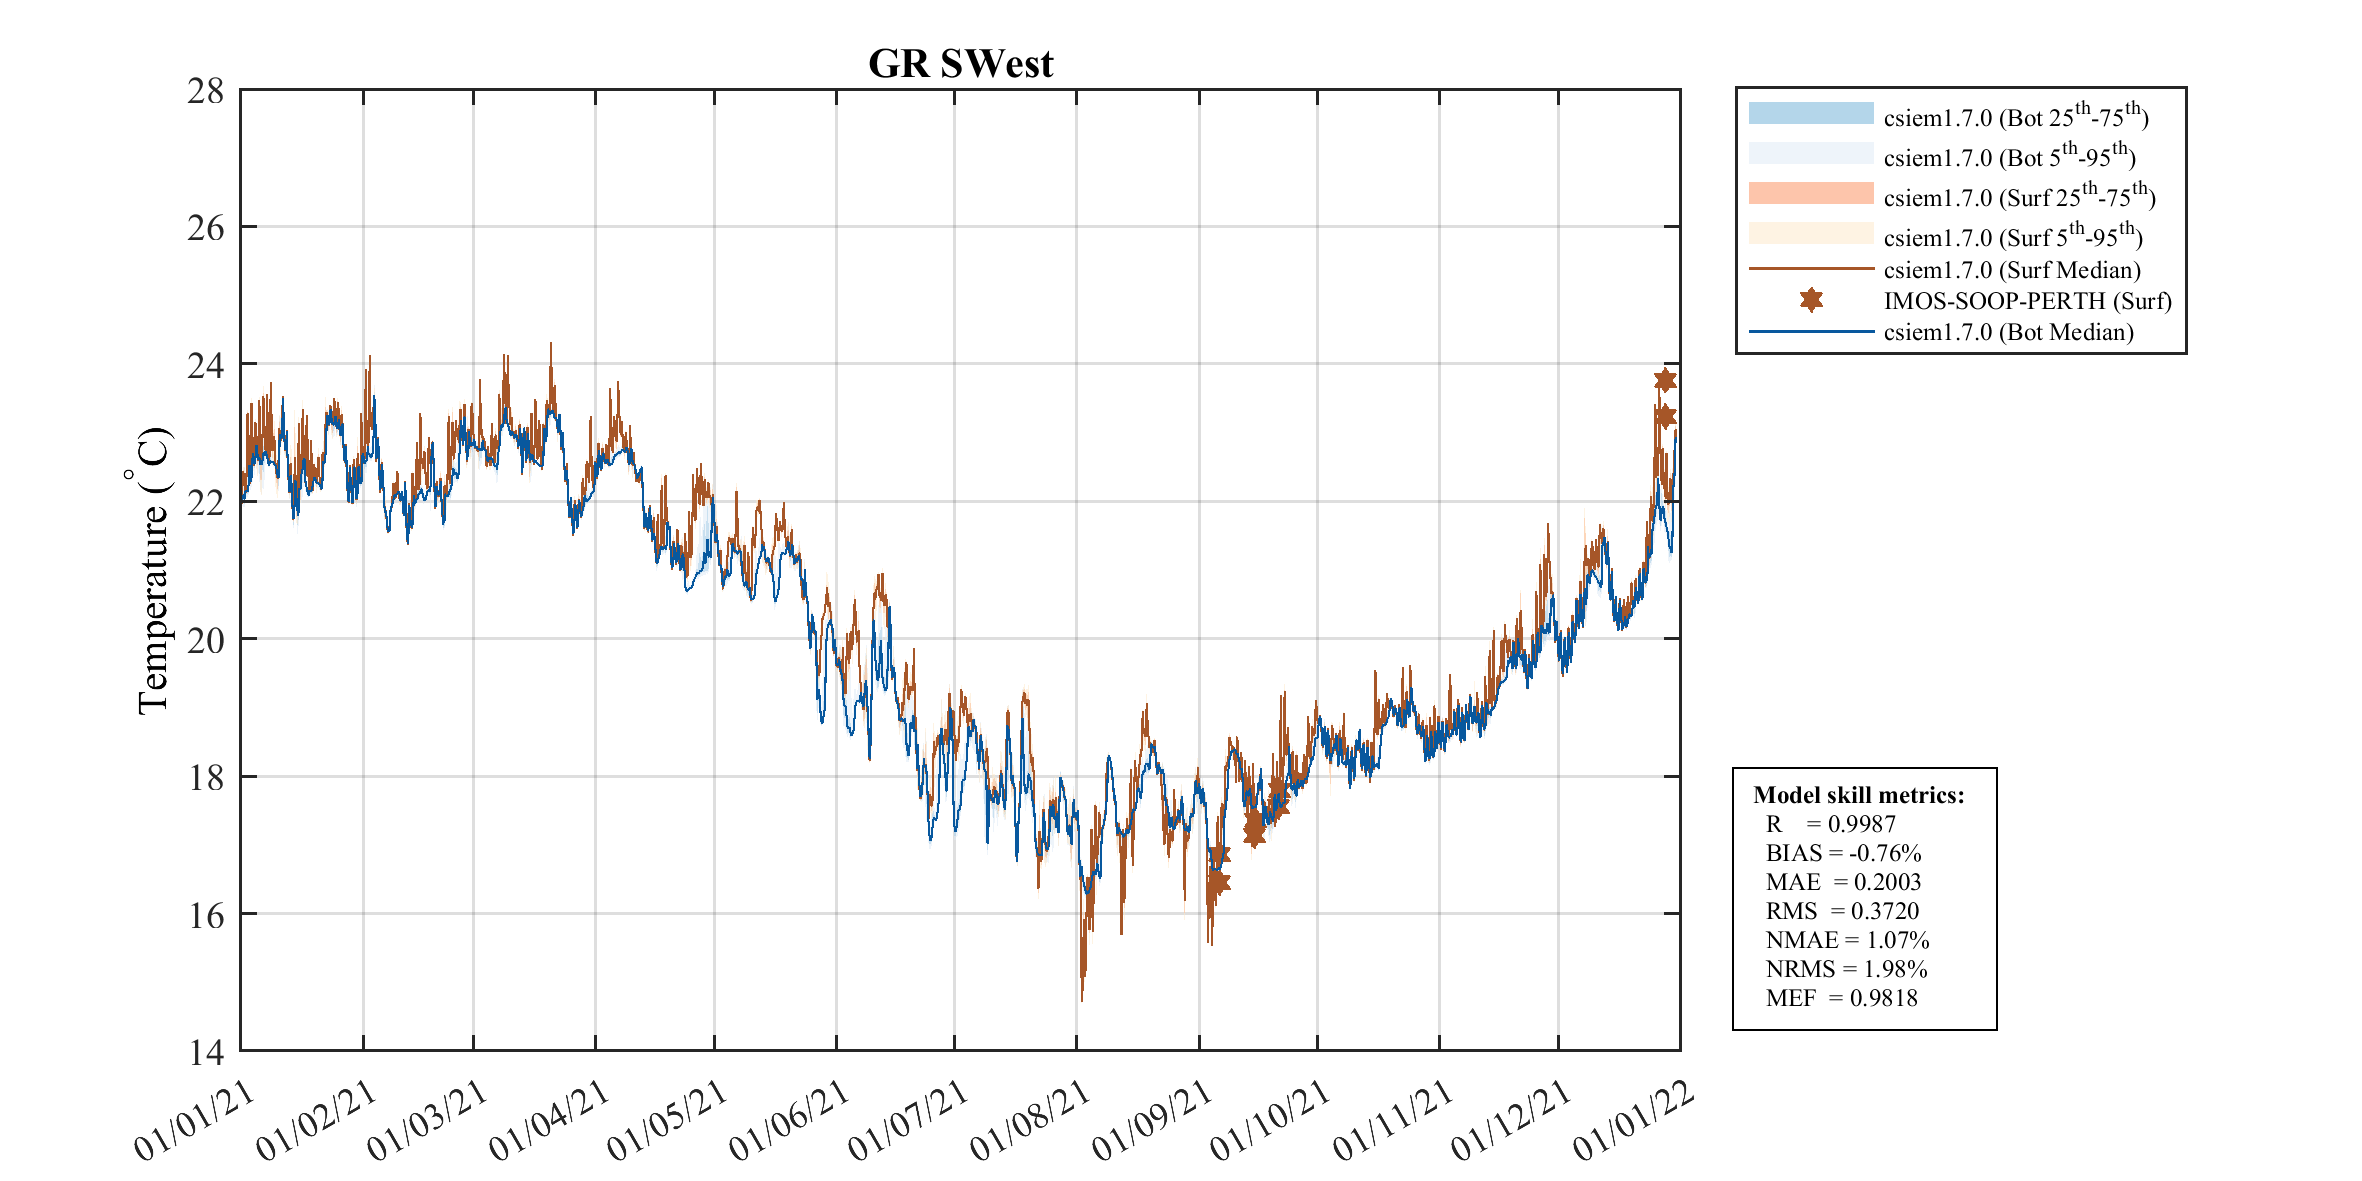
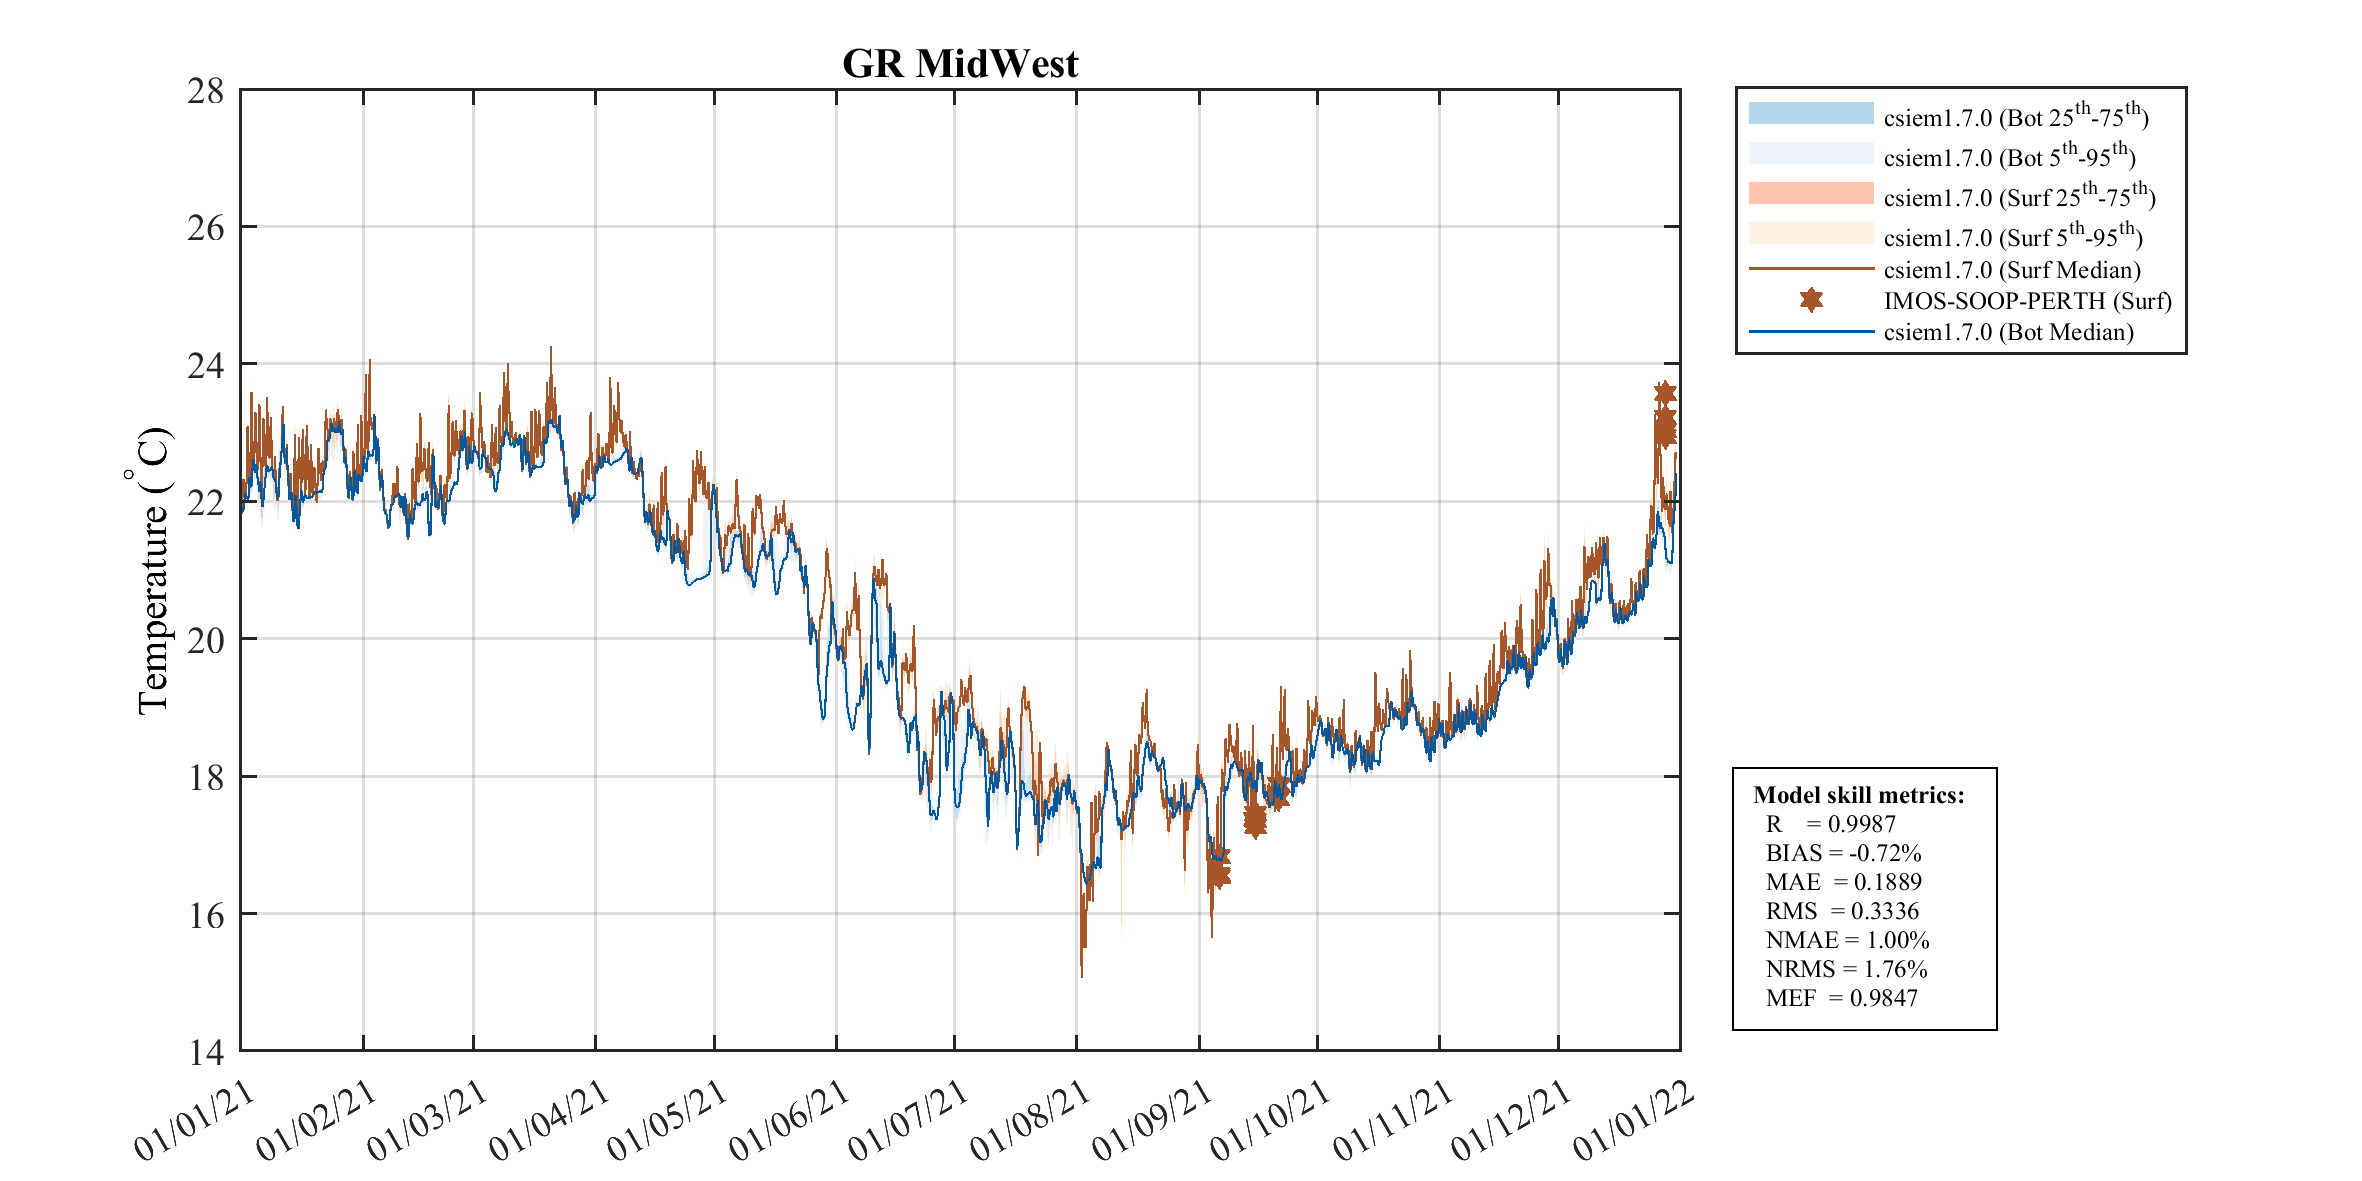
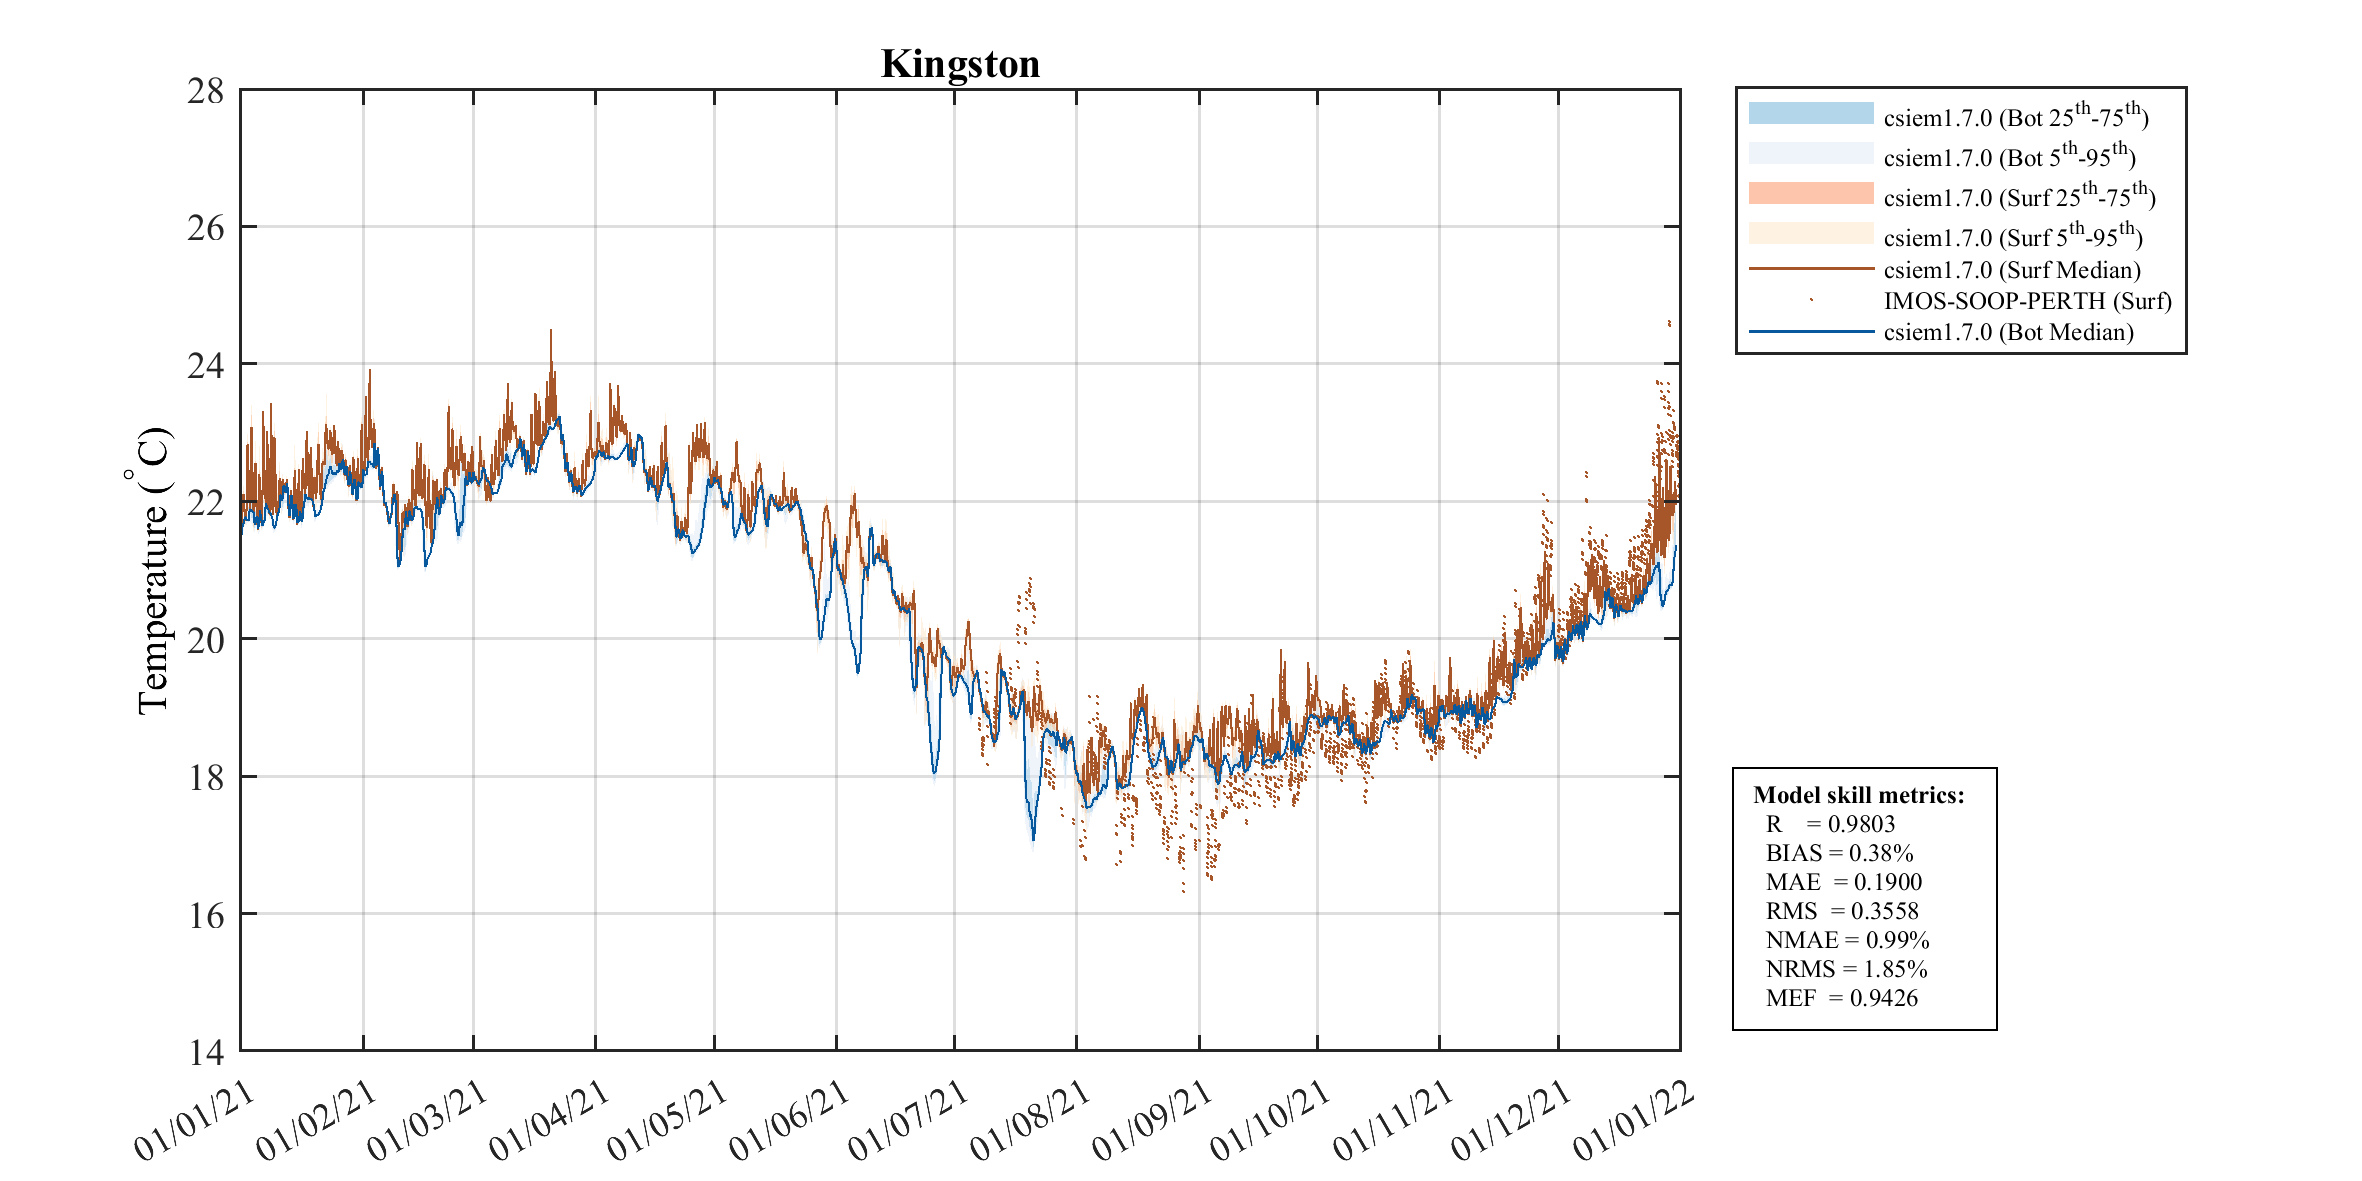
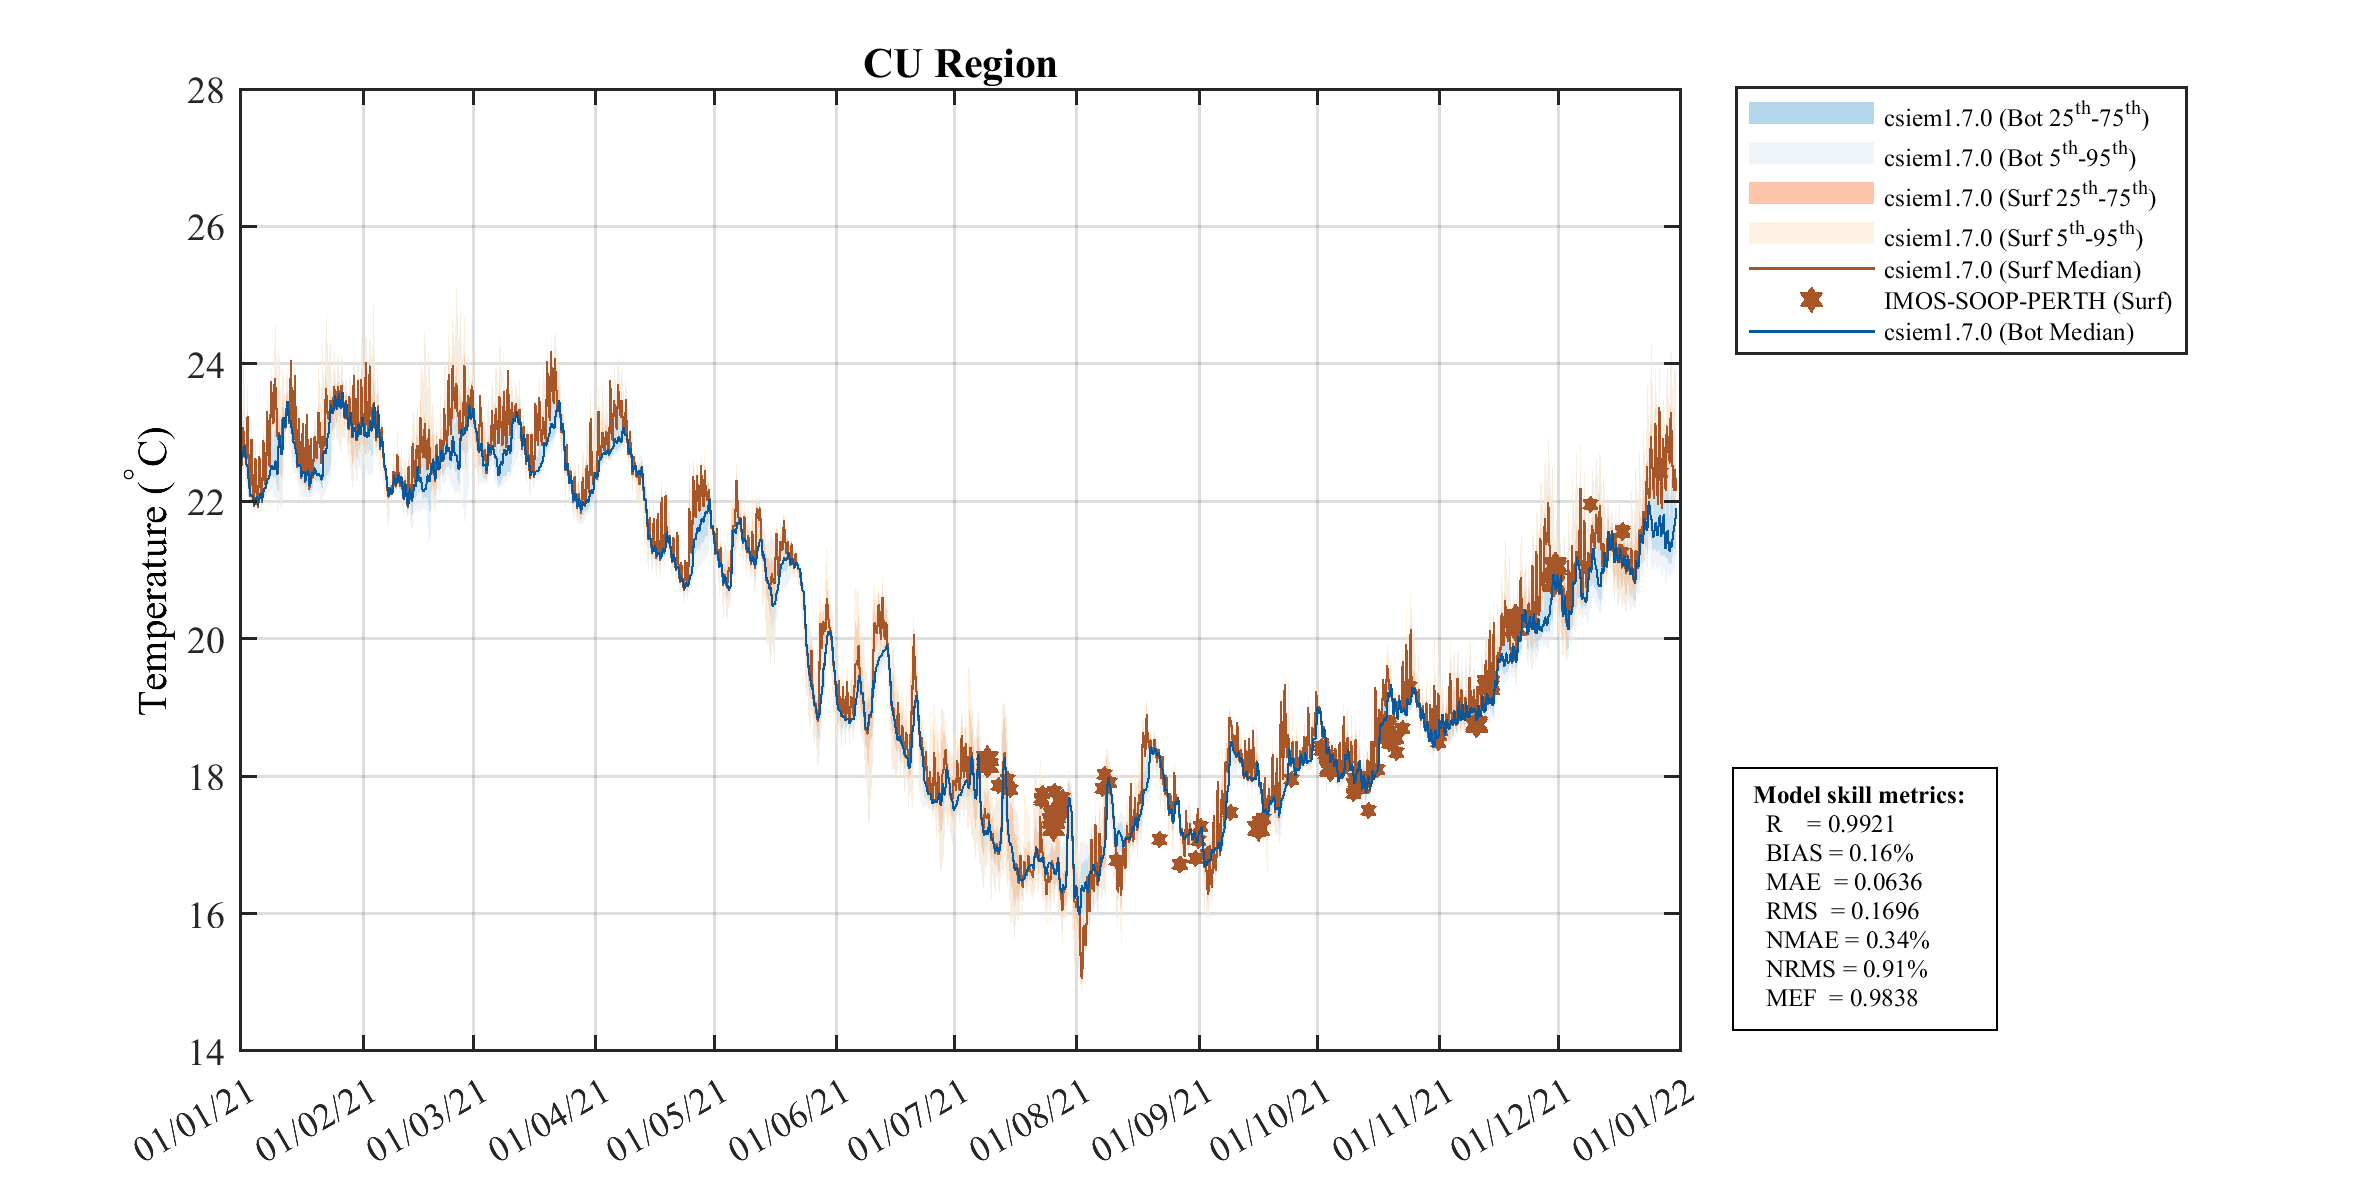
MARVL Sub-Region Aggregate Polygon Metrics
Metrics read directly from the MARVL sub-region polygon images based on all raw data. Each row corresponds to a *_Region.png validation and aggregated region data-set. Note that these metrics are for diagnostic purposes only and may be impacted by poor or erroneous data; refer to the table at the top for curated error metrics.
Mean Absolute Error (°C)
| Region | 2013 | 2015 | 2020 | 2021 | 2022 | 2023 |
|---|---|---|---|---|---|---|
| 0055 — OL_Region | 0.200 | 0.116 | 0.080 | 0.299 | 0.149 | 0.160 |
| 0053 — DWC_Region | 0.114 | 0.082 | 0.073 | 0.109 | 0.122 | 0.071 |
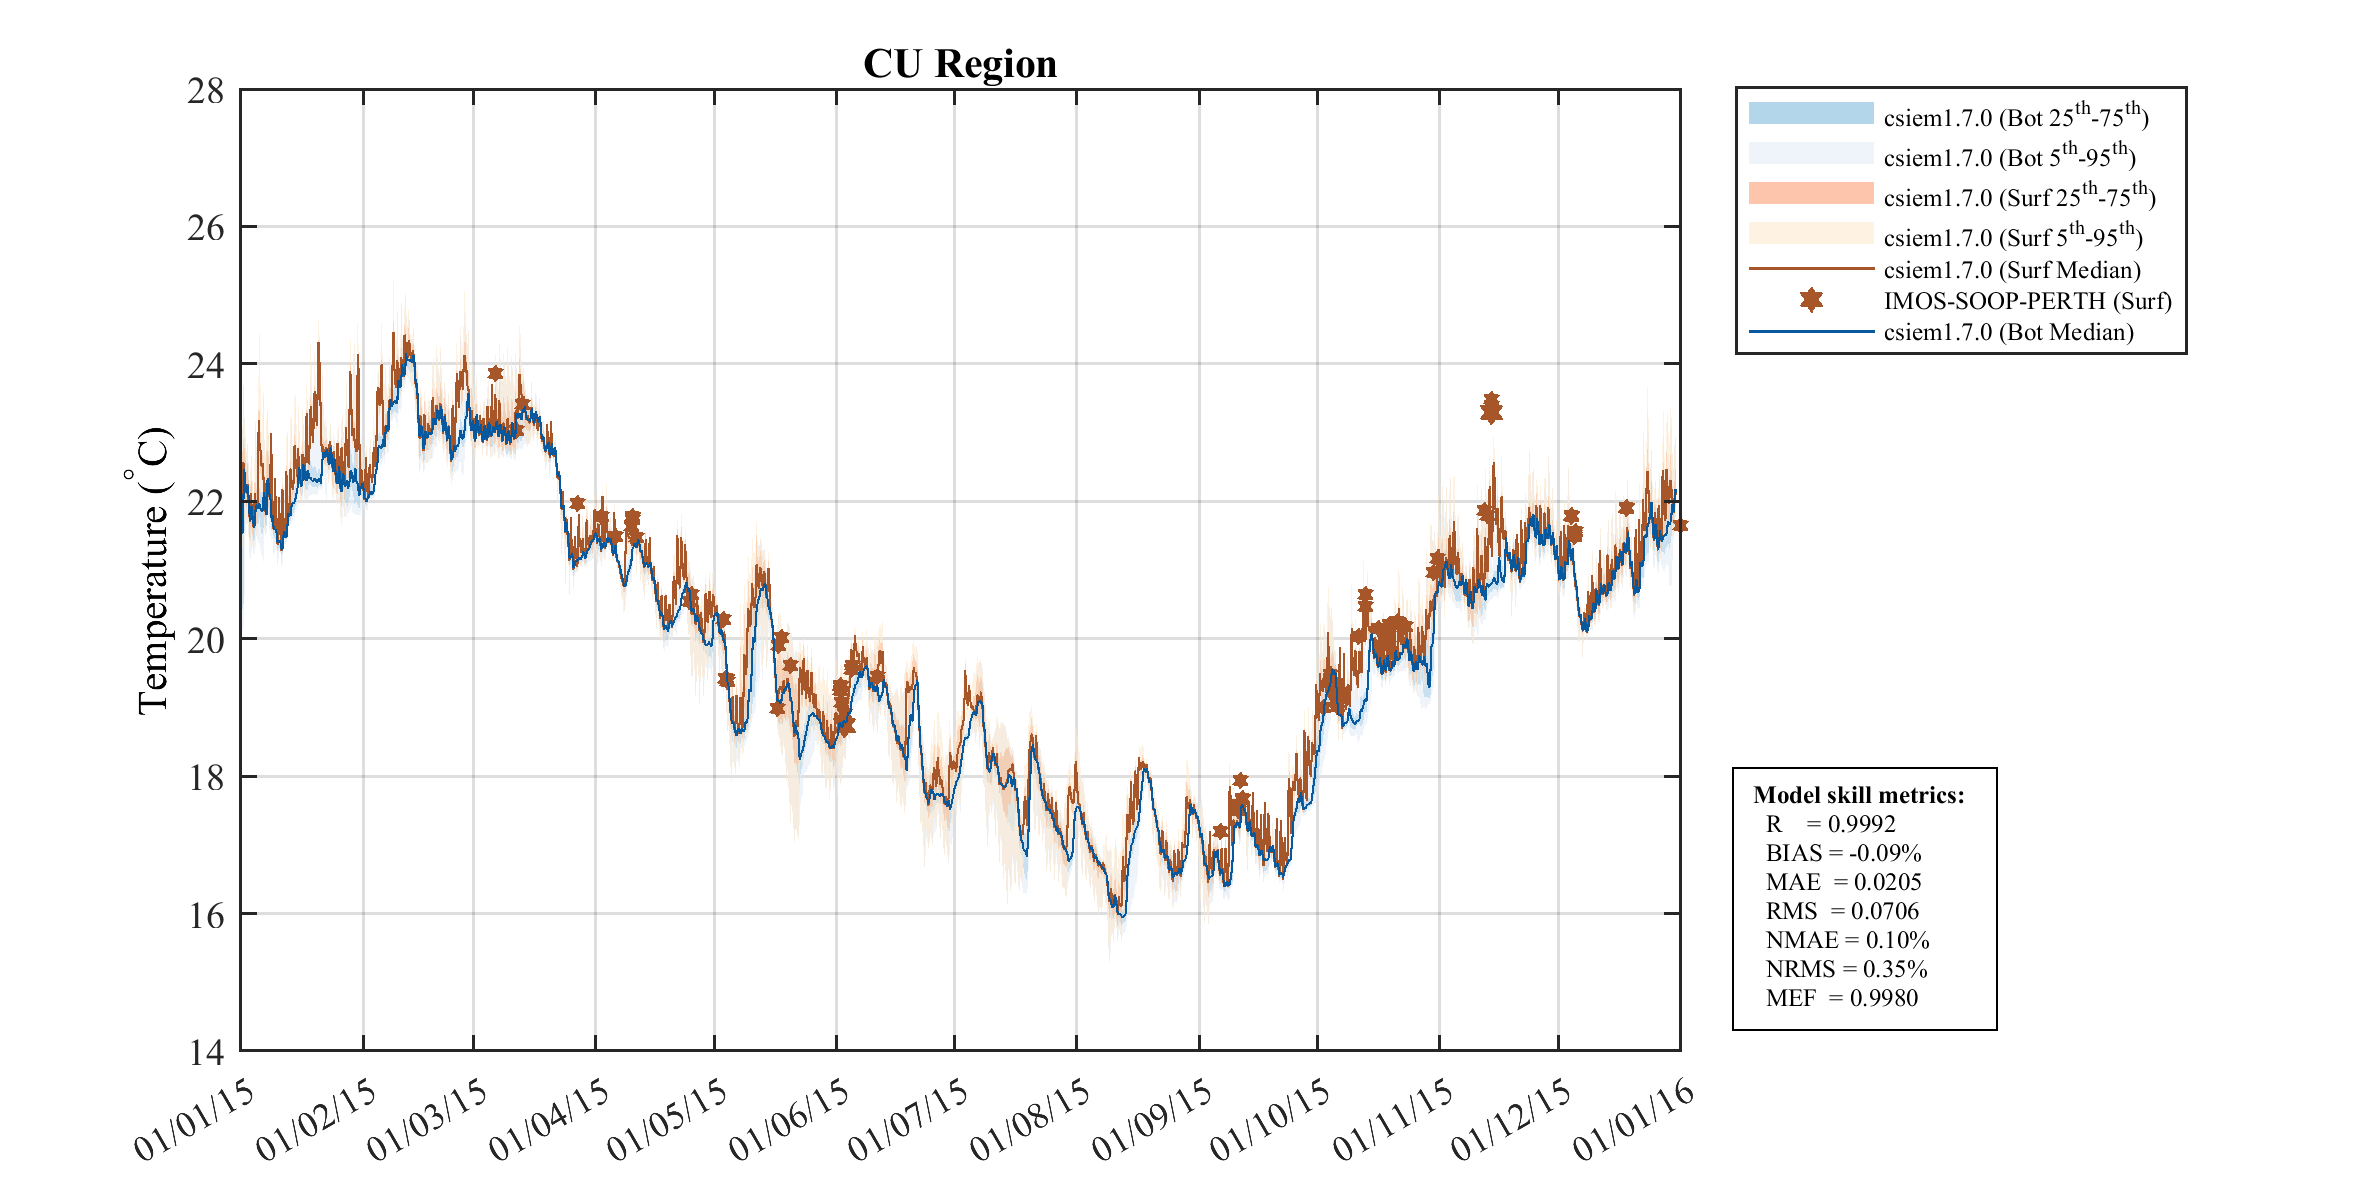
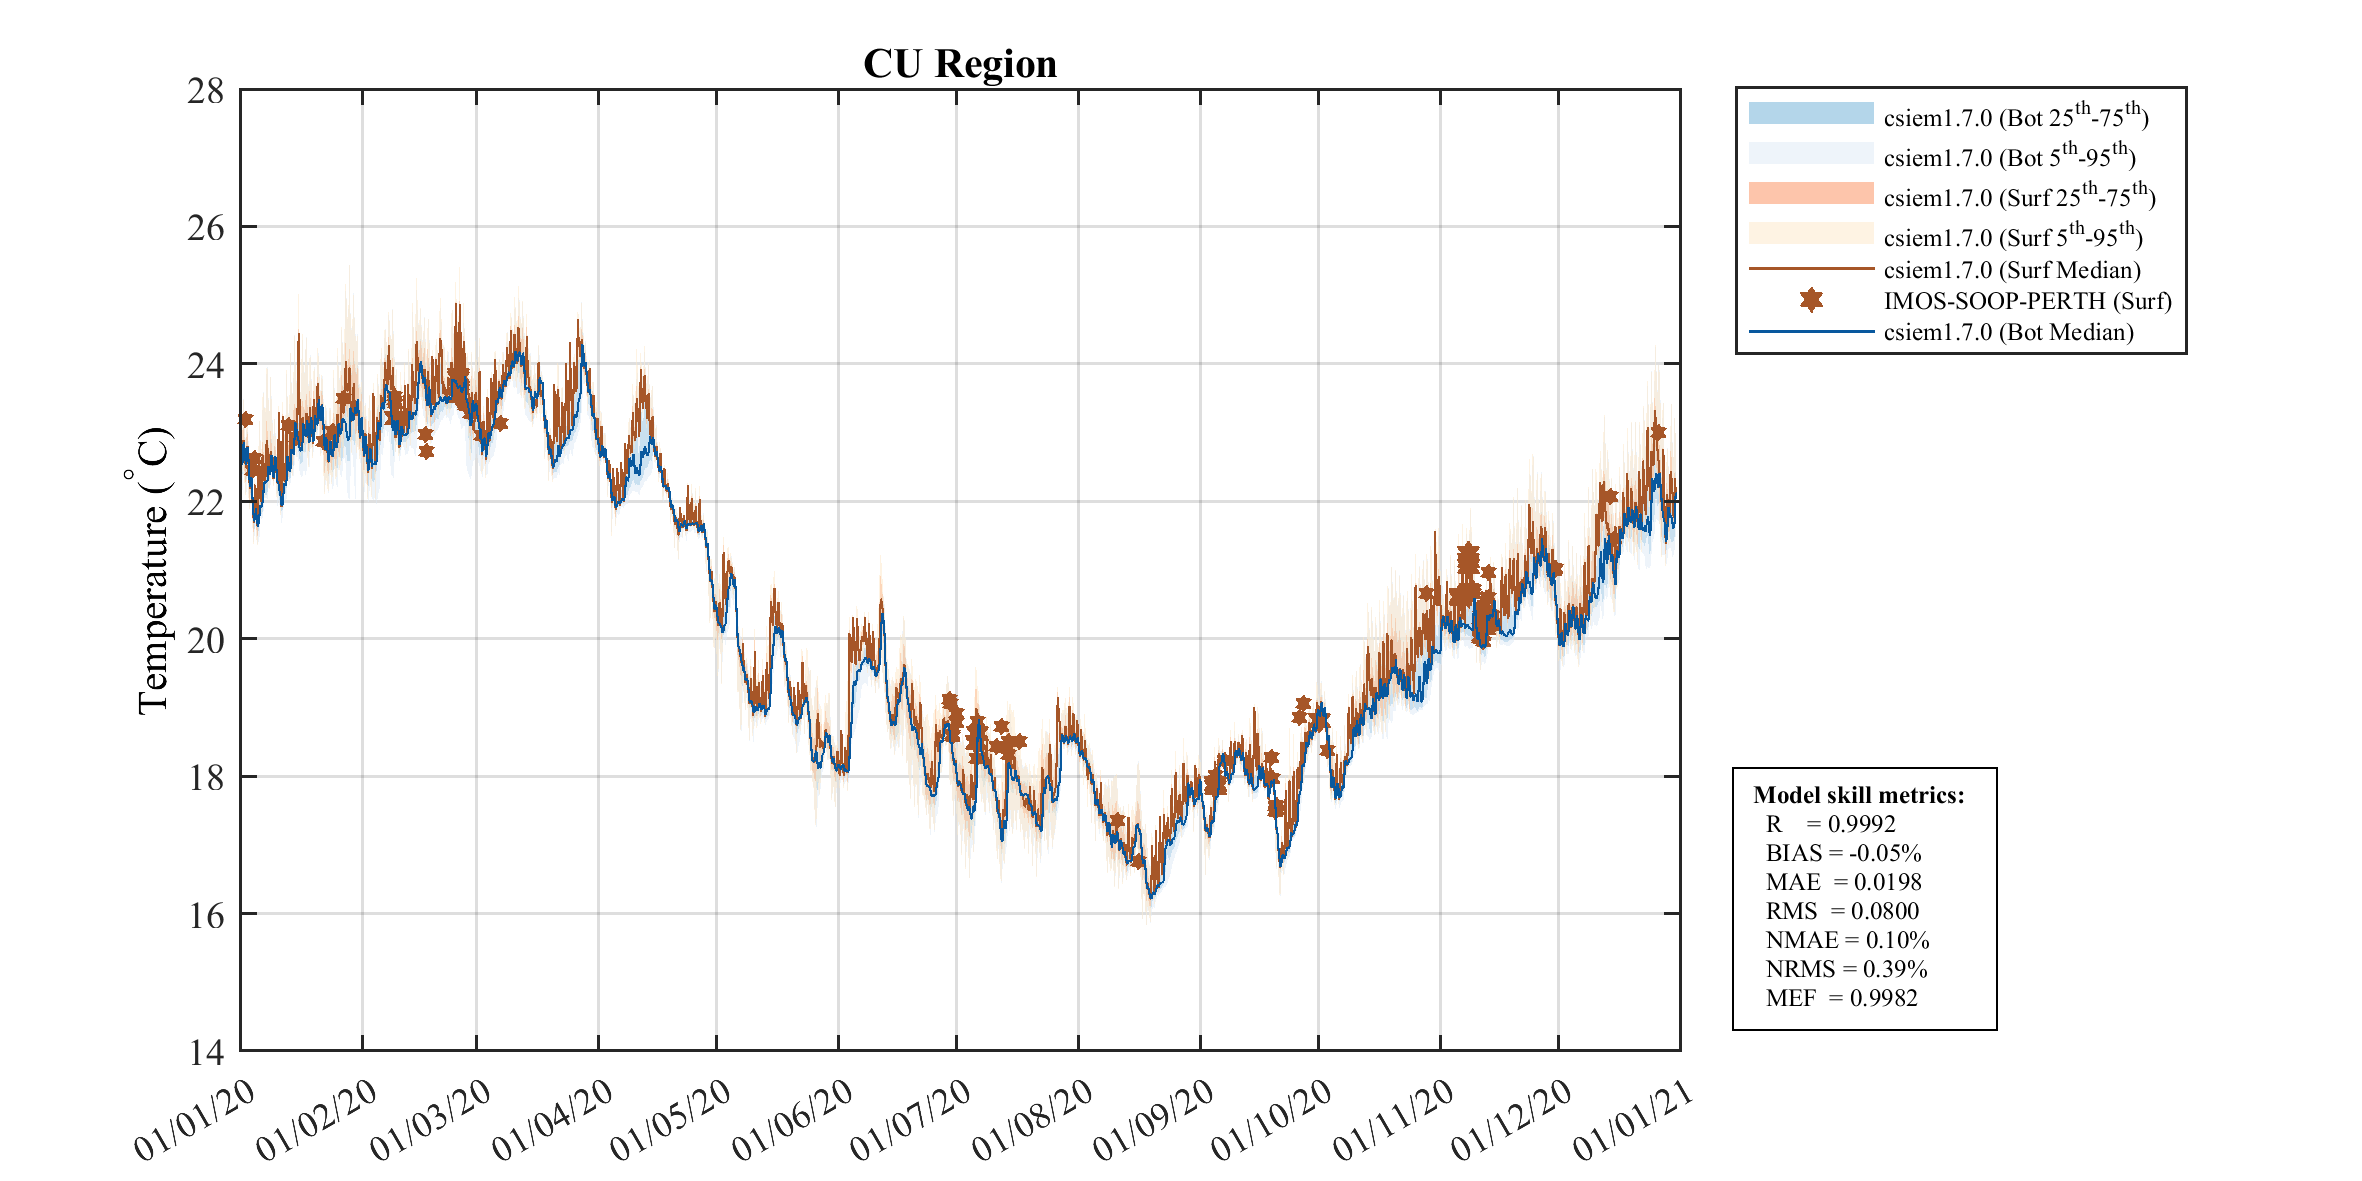
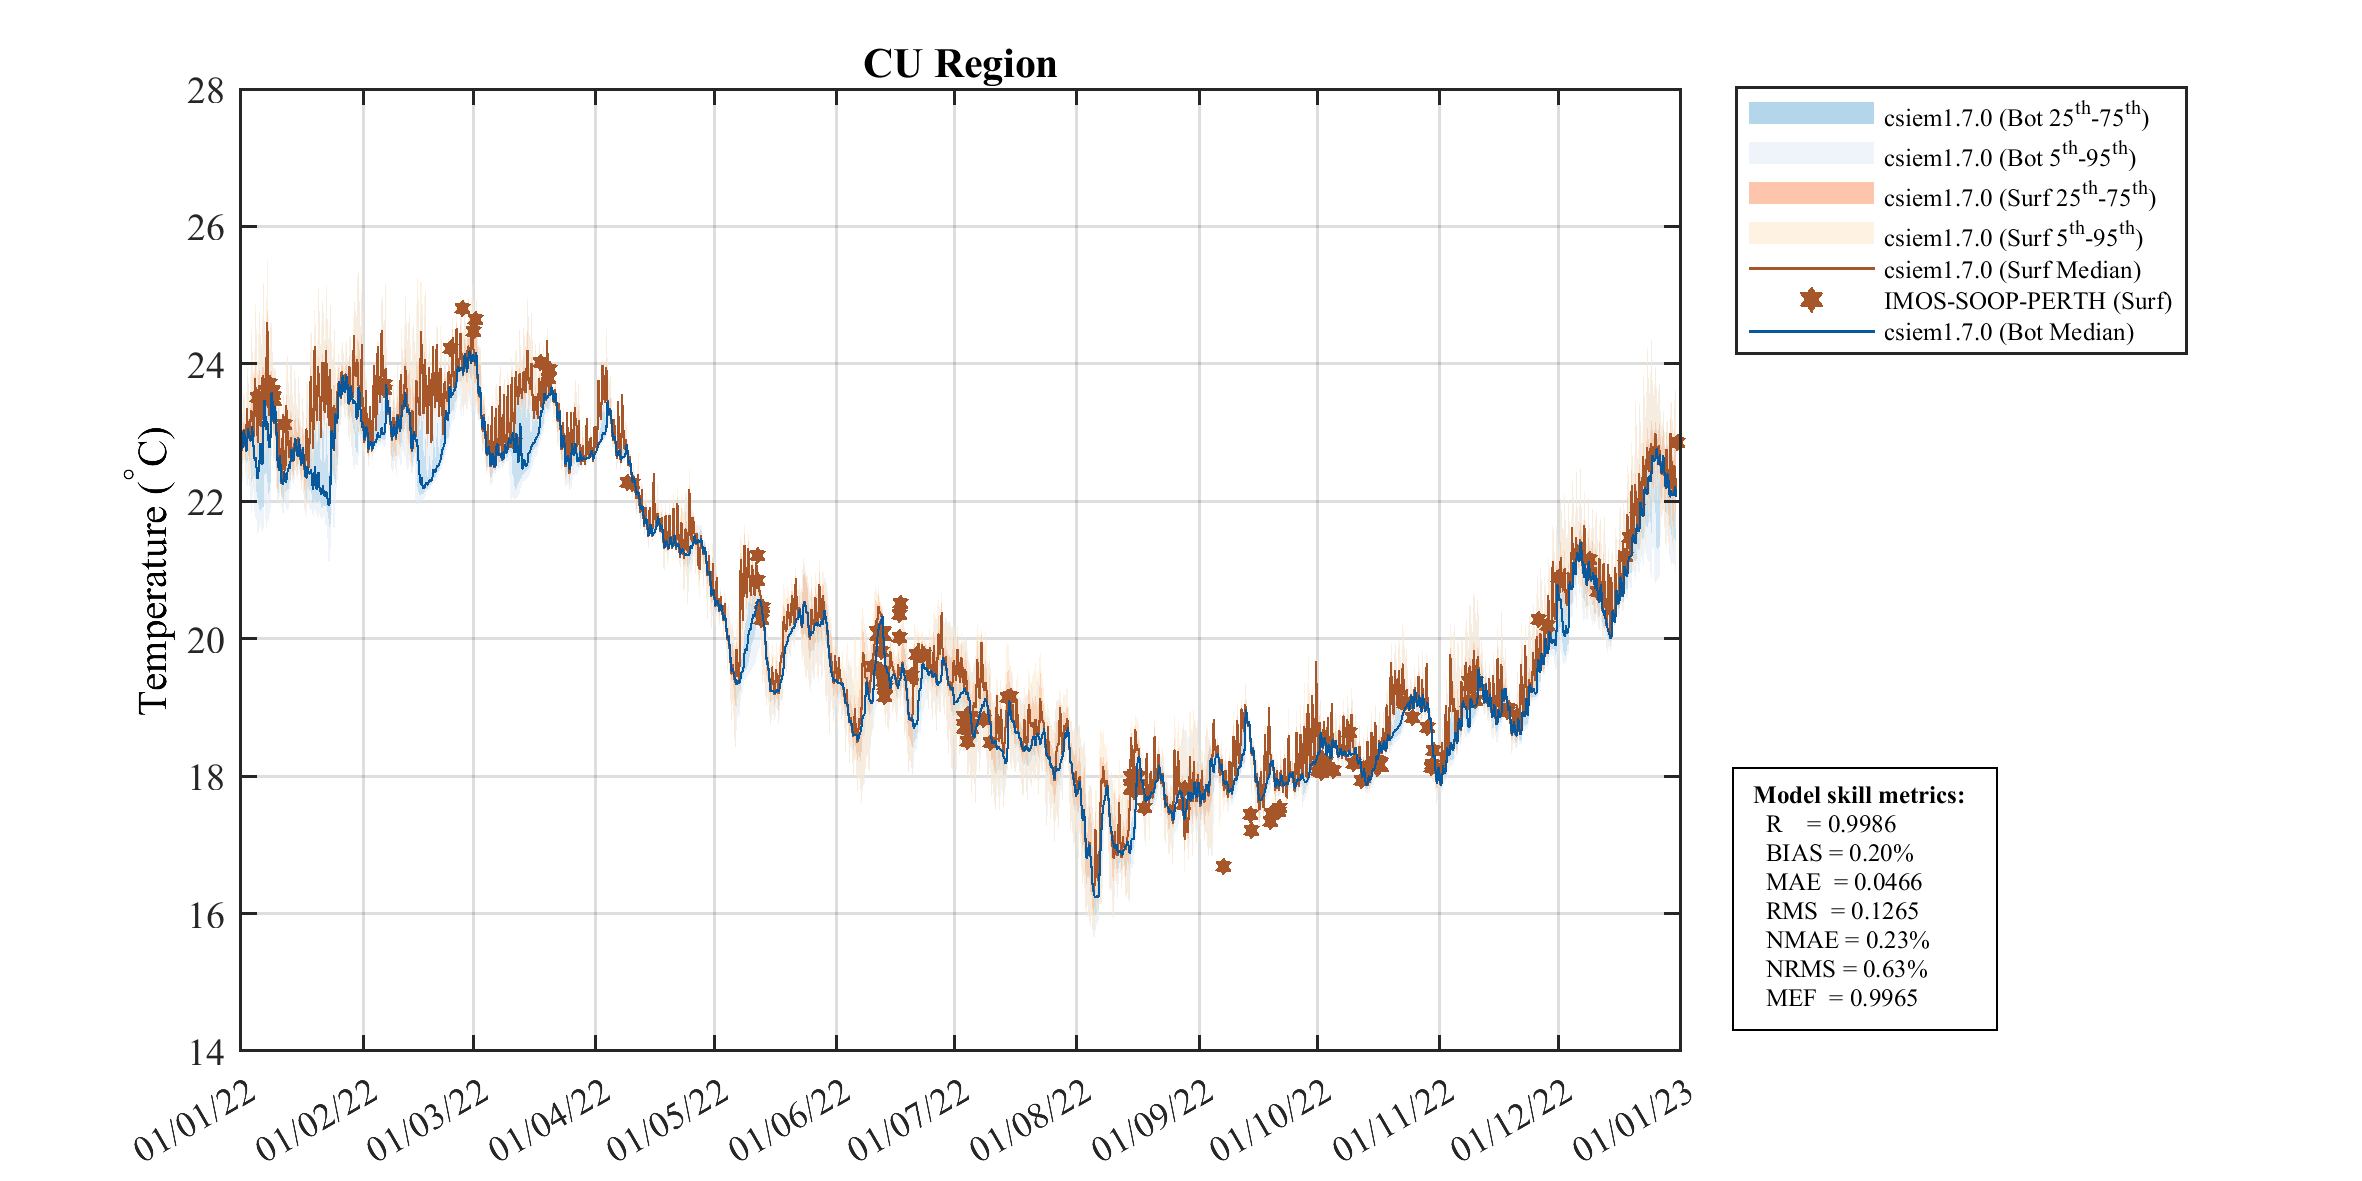
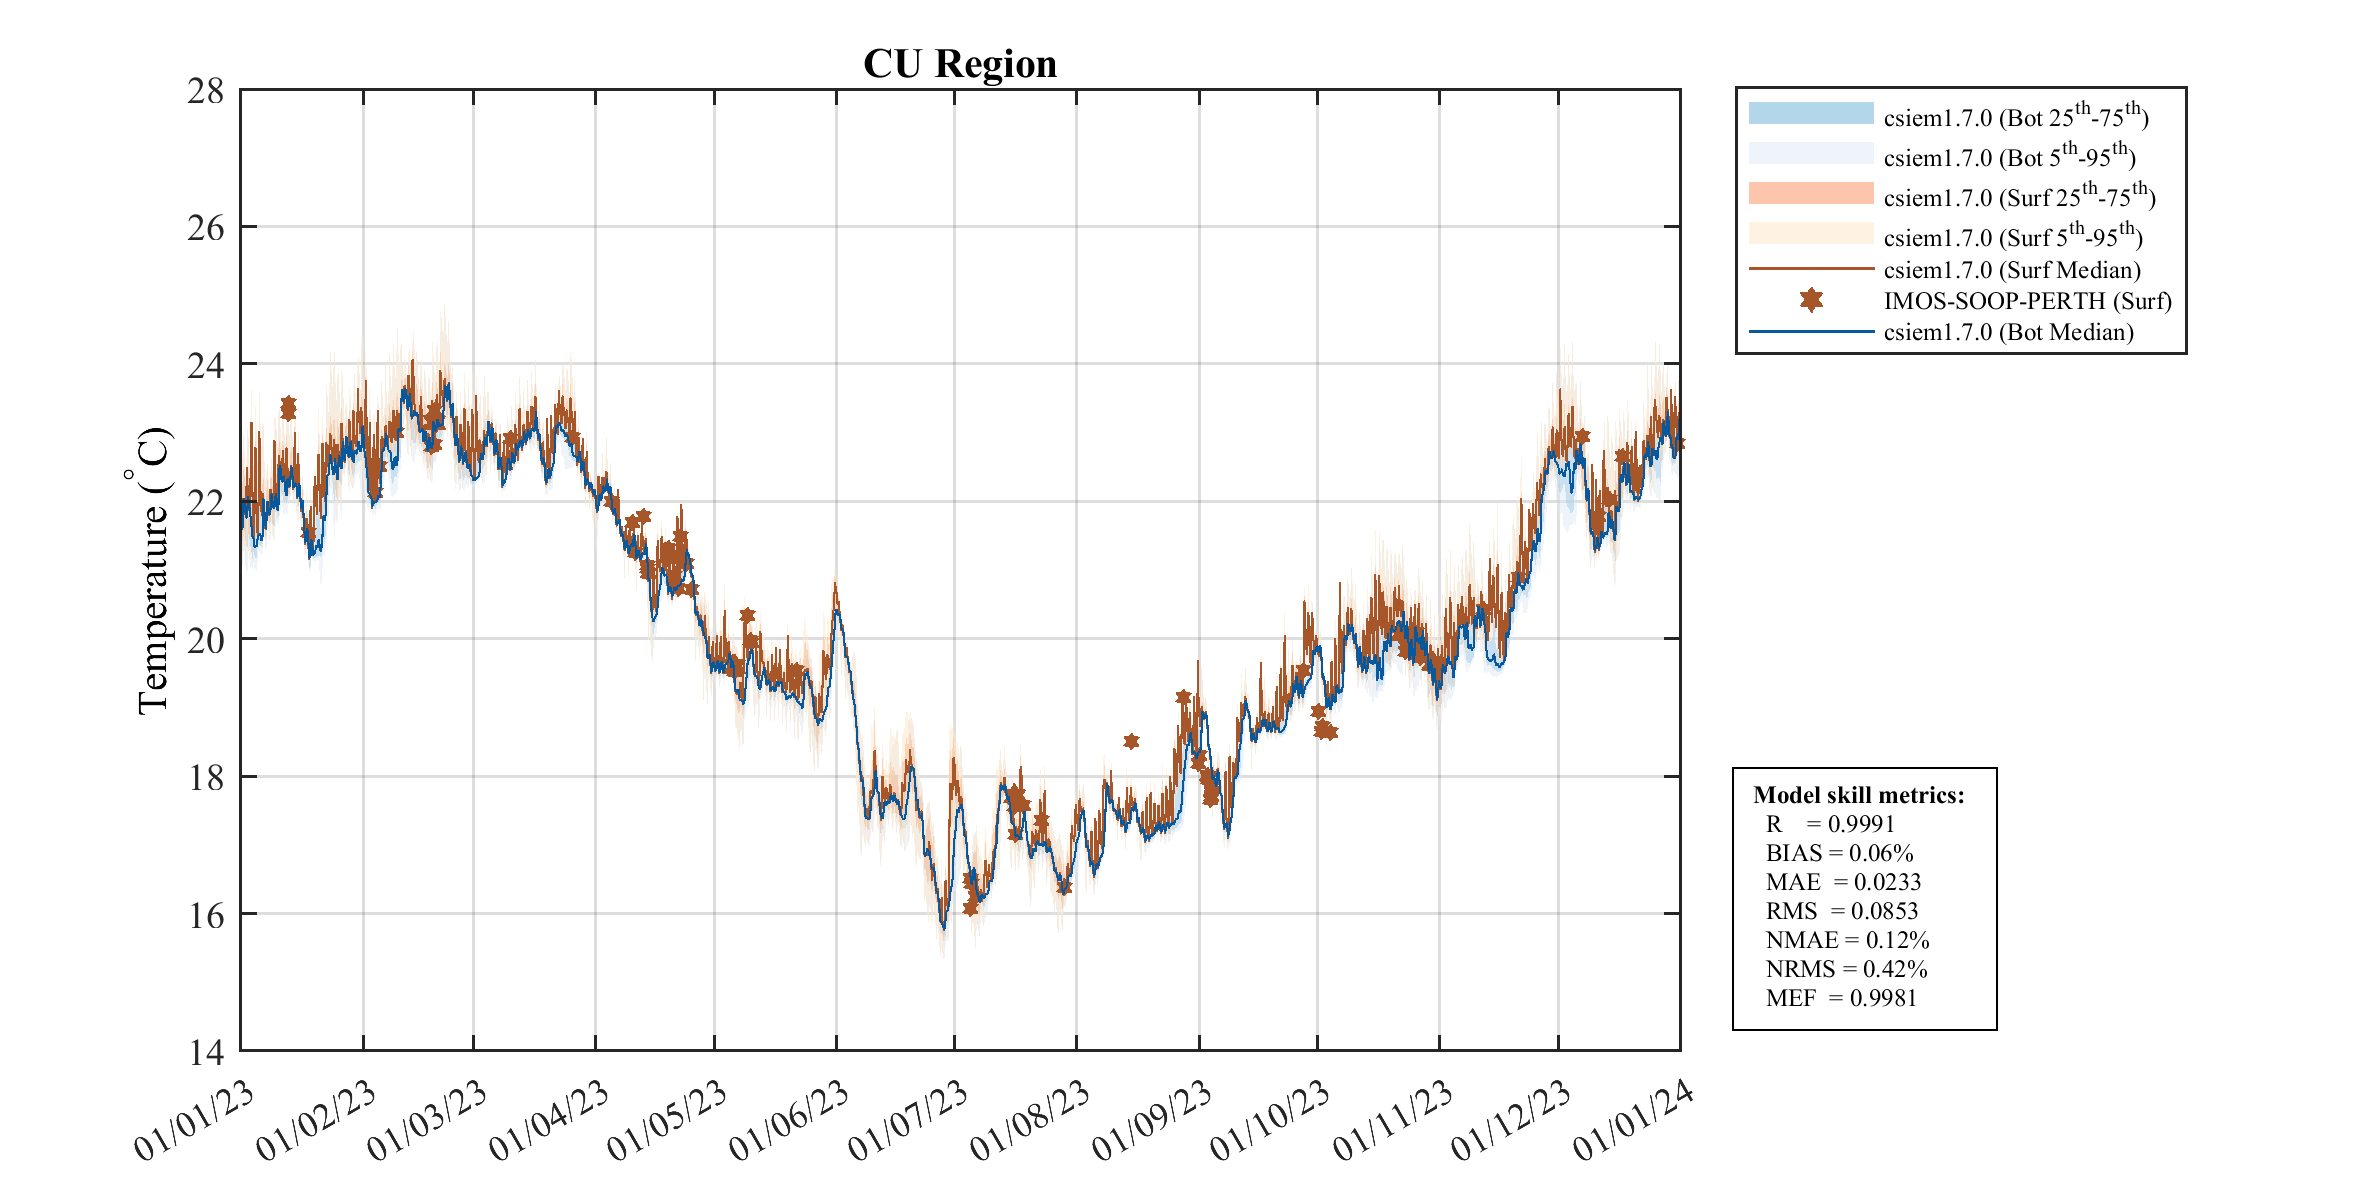
| 0054 — CU_Region | 0.083 | 0.021 | 0.020 | 0.061 | 0.058 | 0.025 |
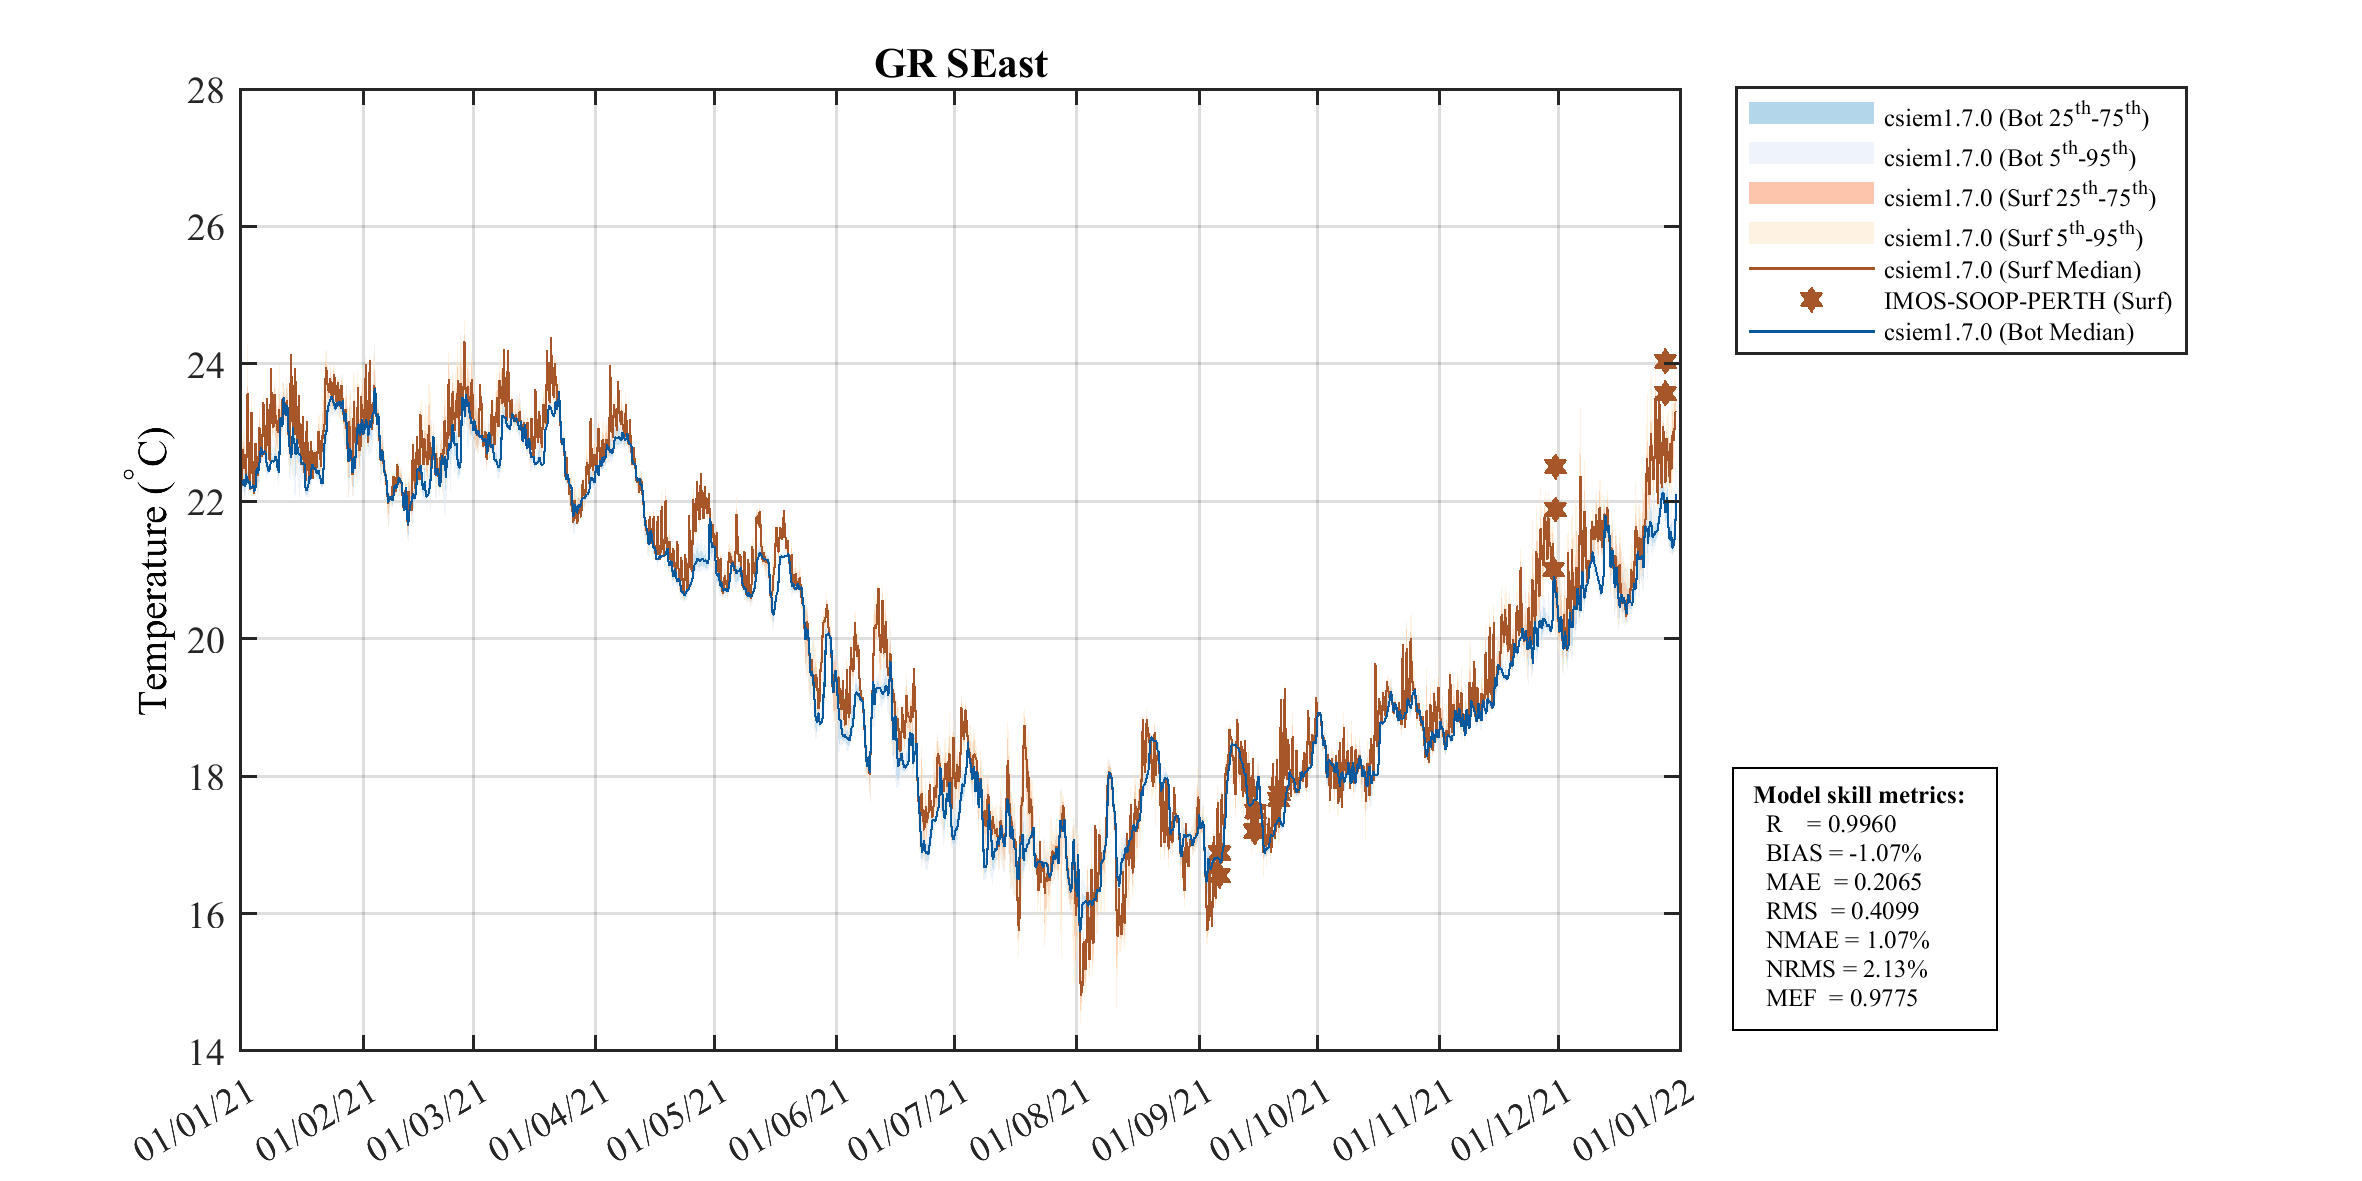
| 0036 — GR_Region | 0.064 | — | 0.010 | 0.005 | 0.087 | 0.024 |
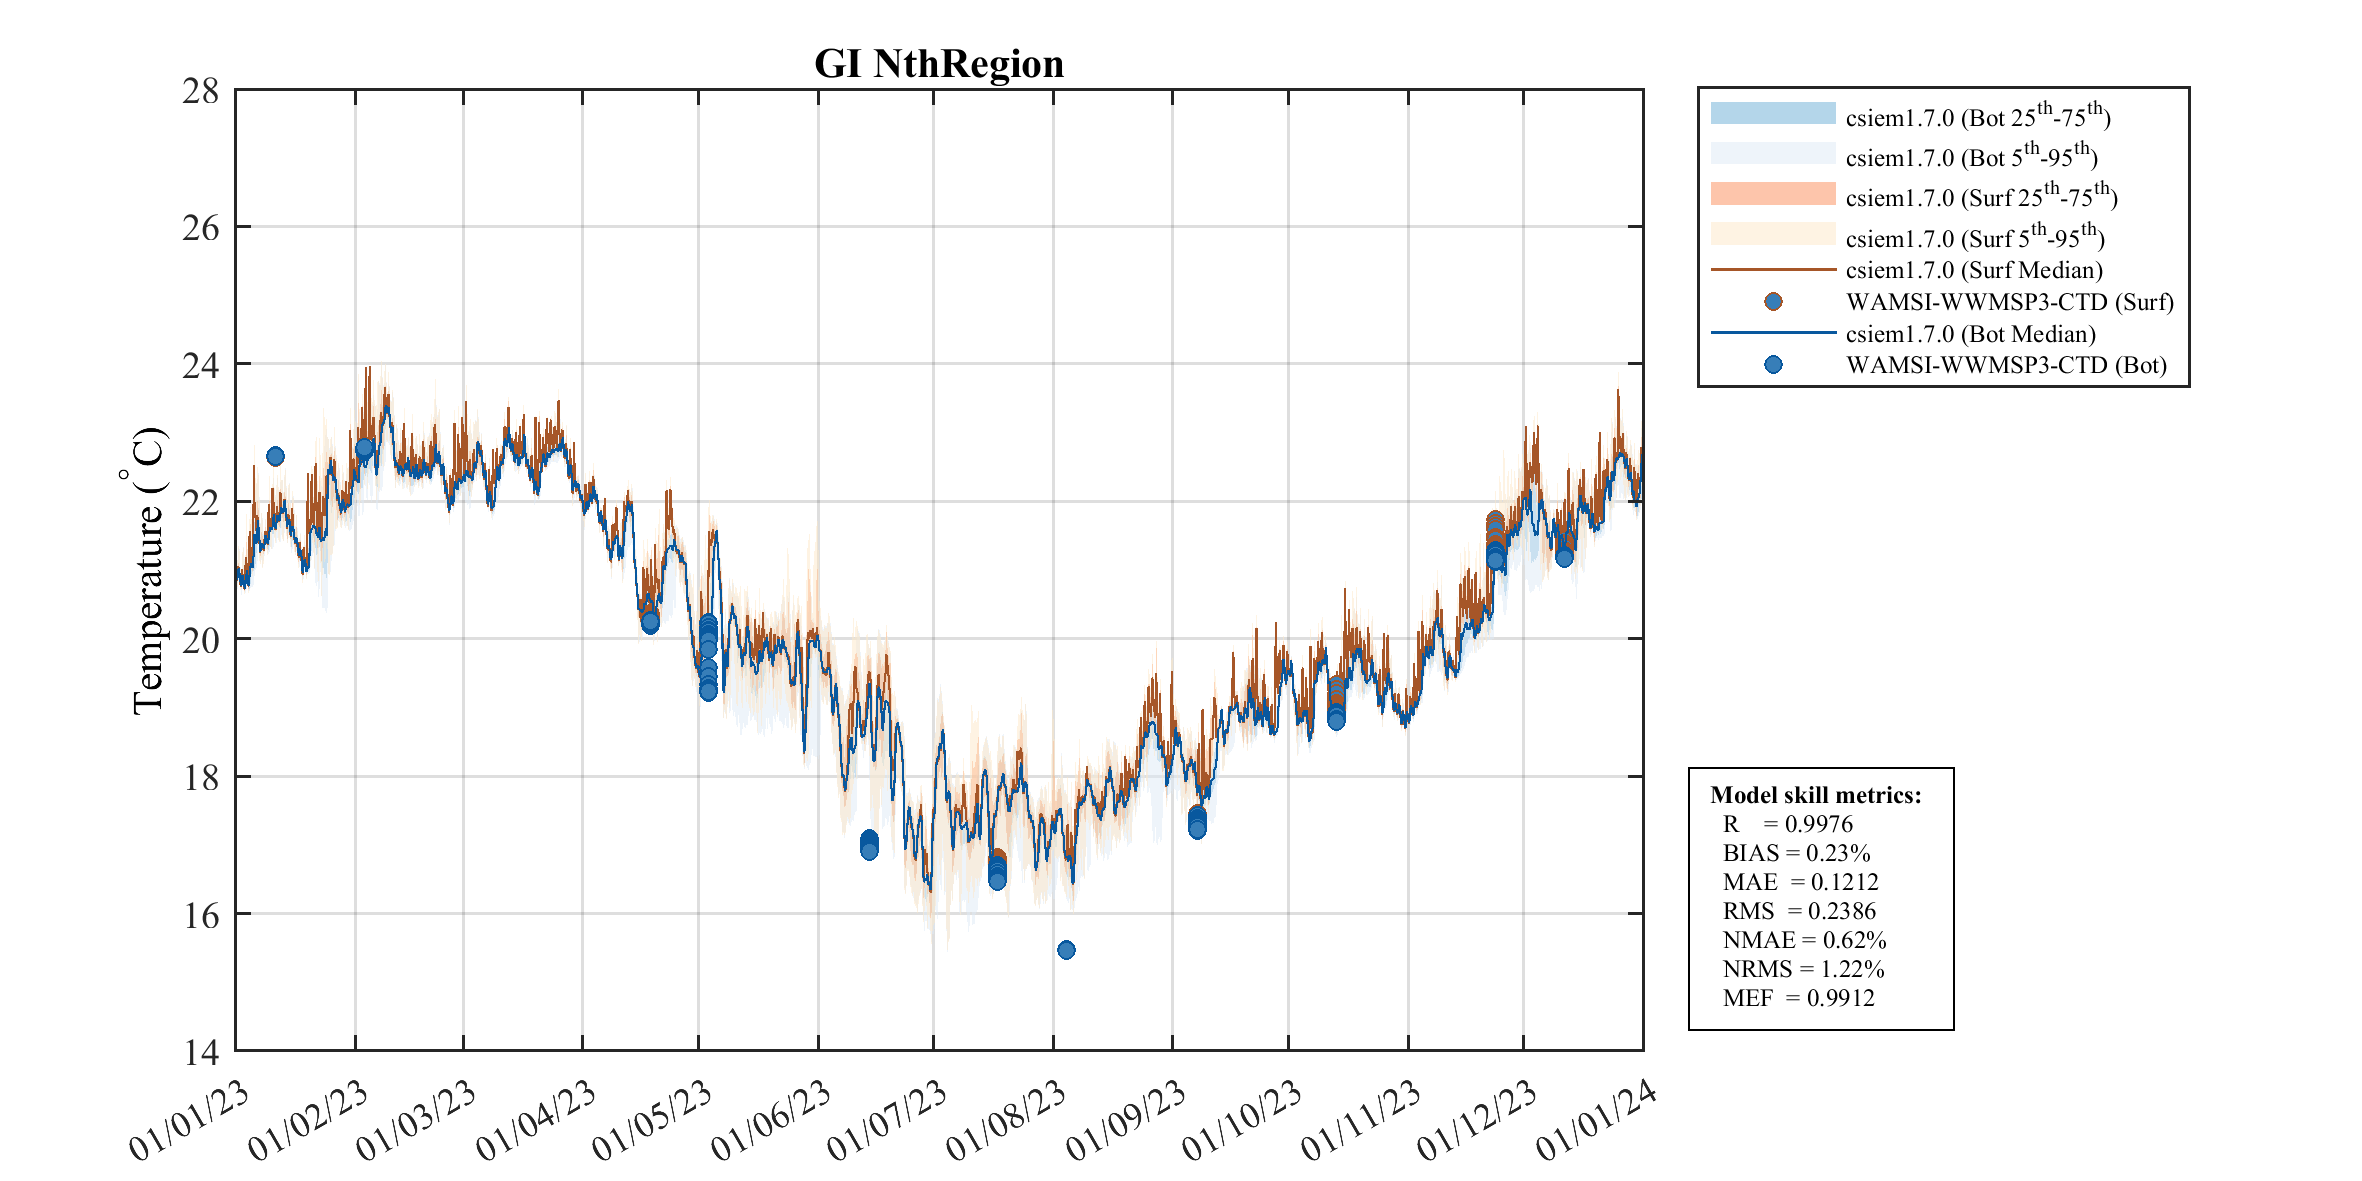
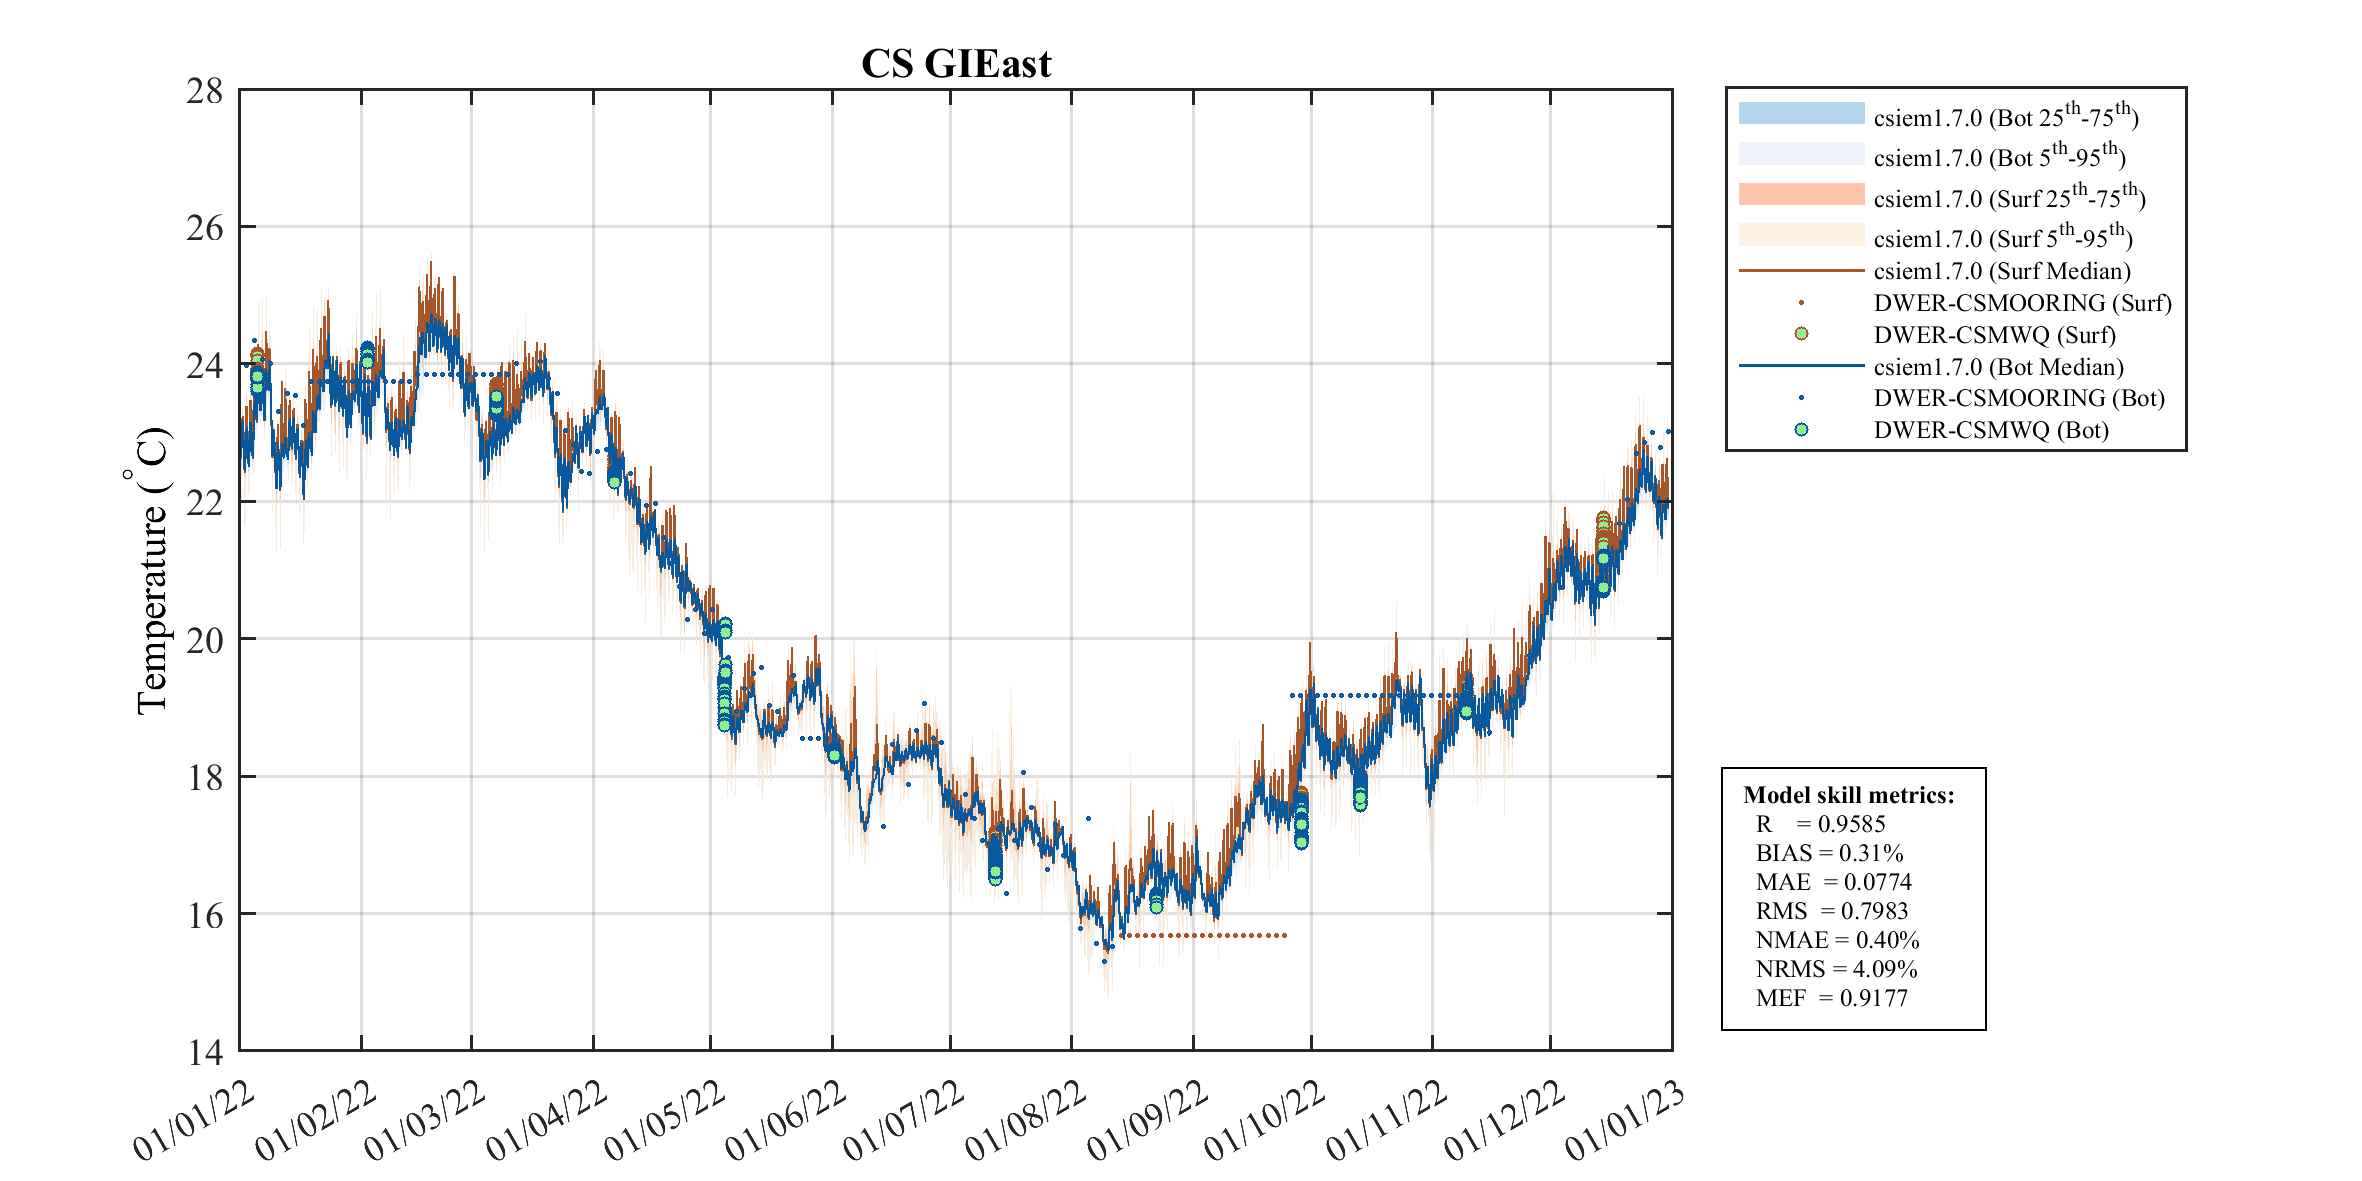
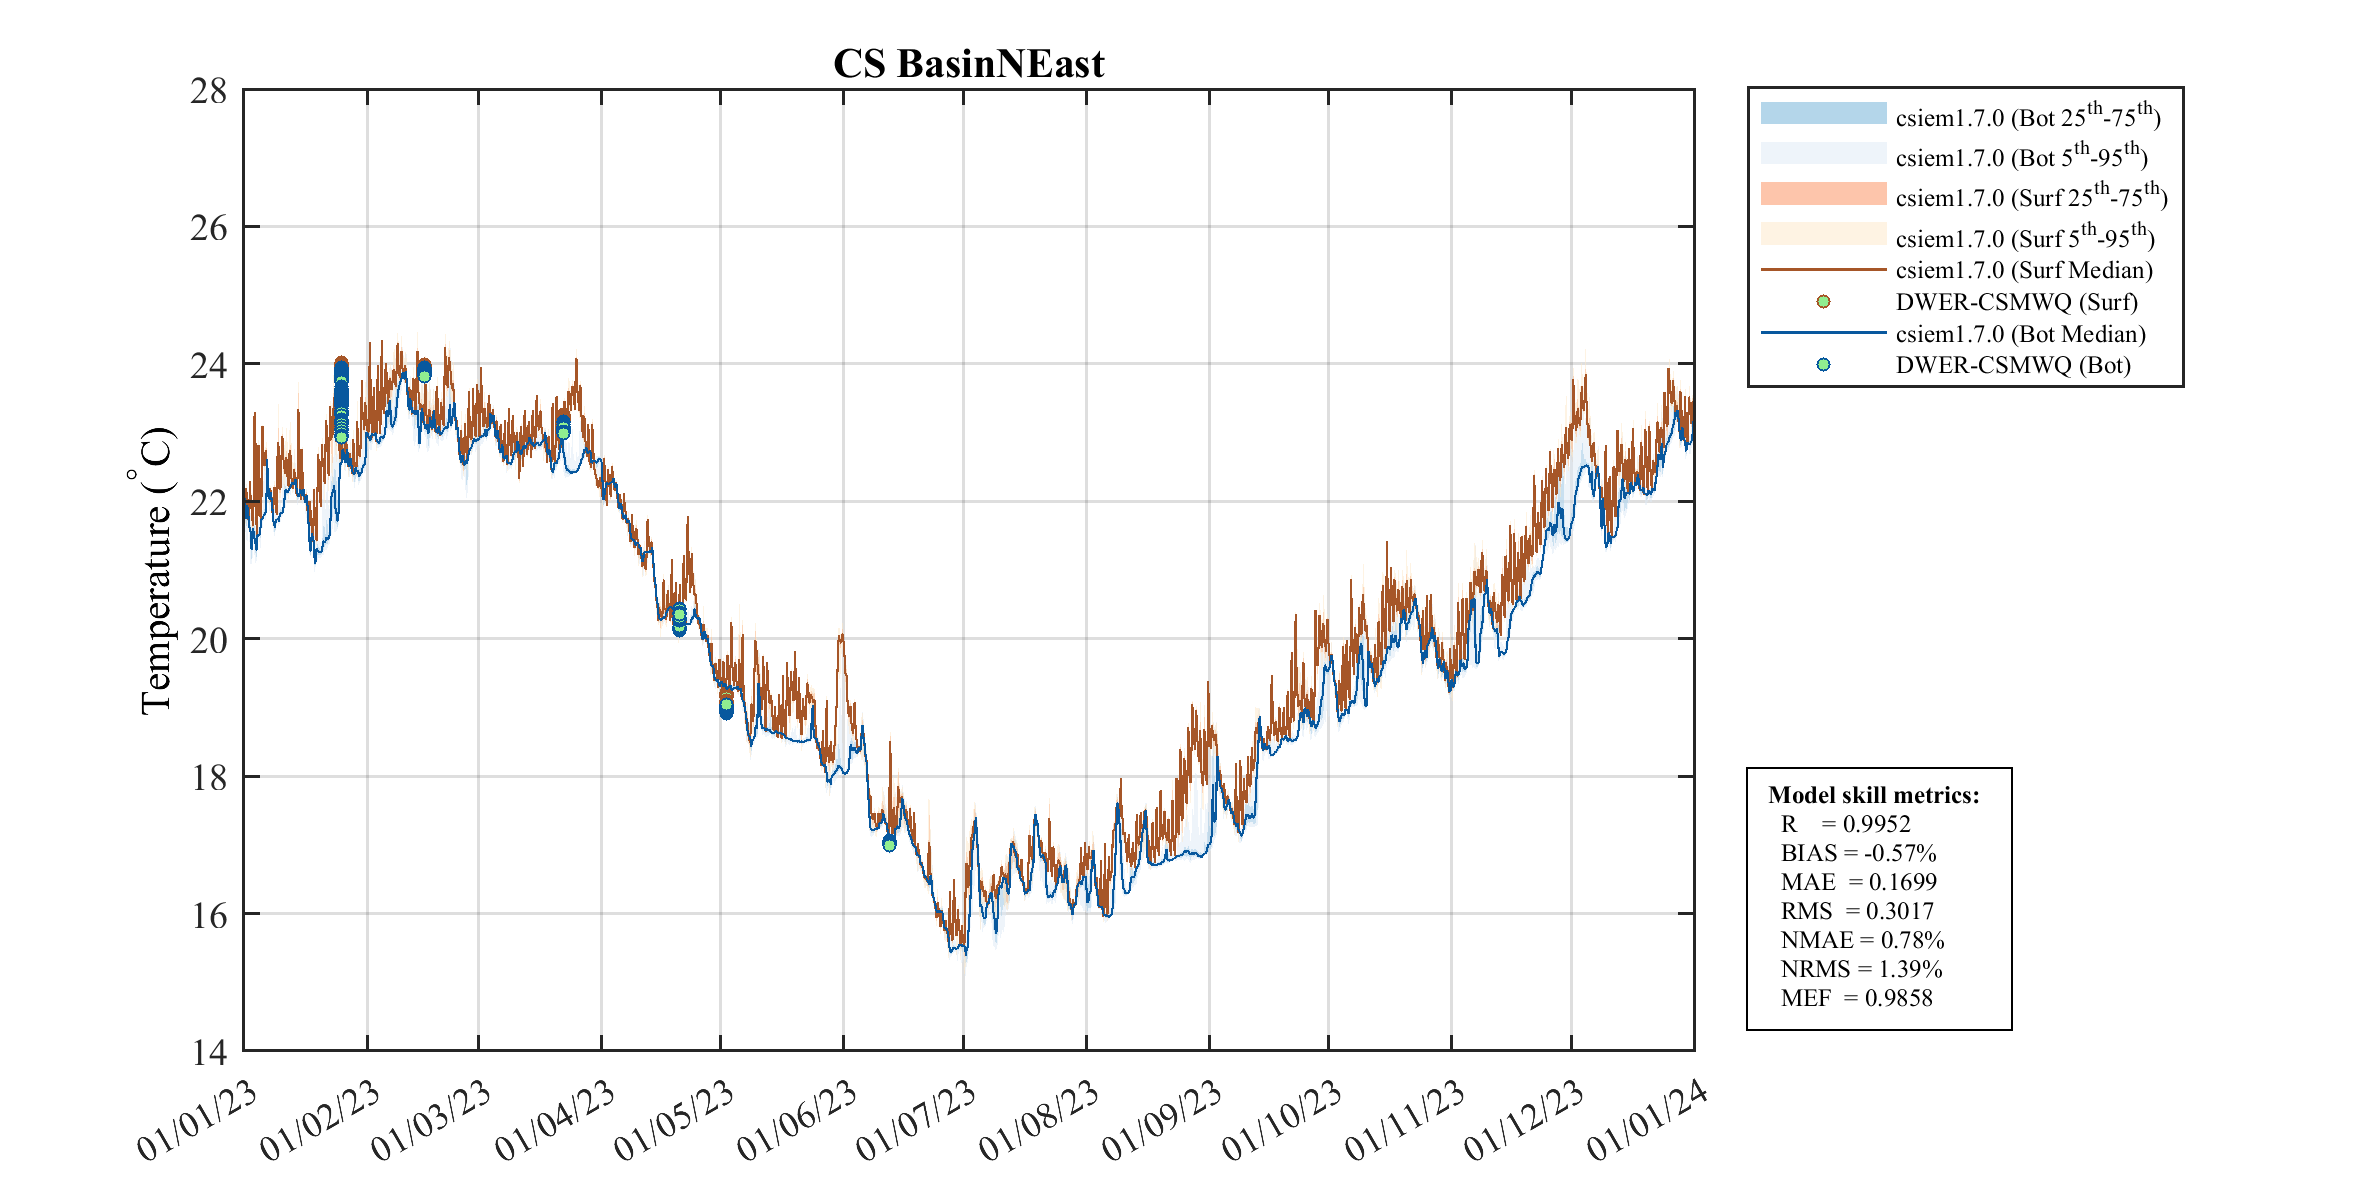
| 0044 — GI_NthRegion | — | — | — | — | 0.191 | 0.121 |
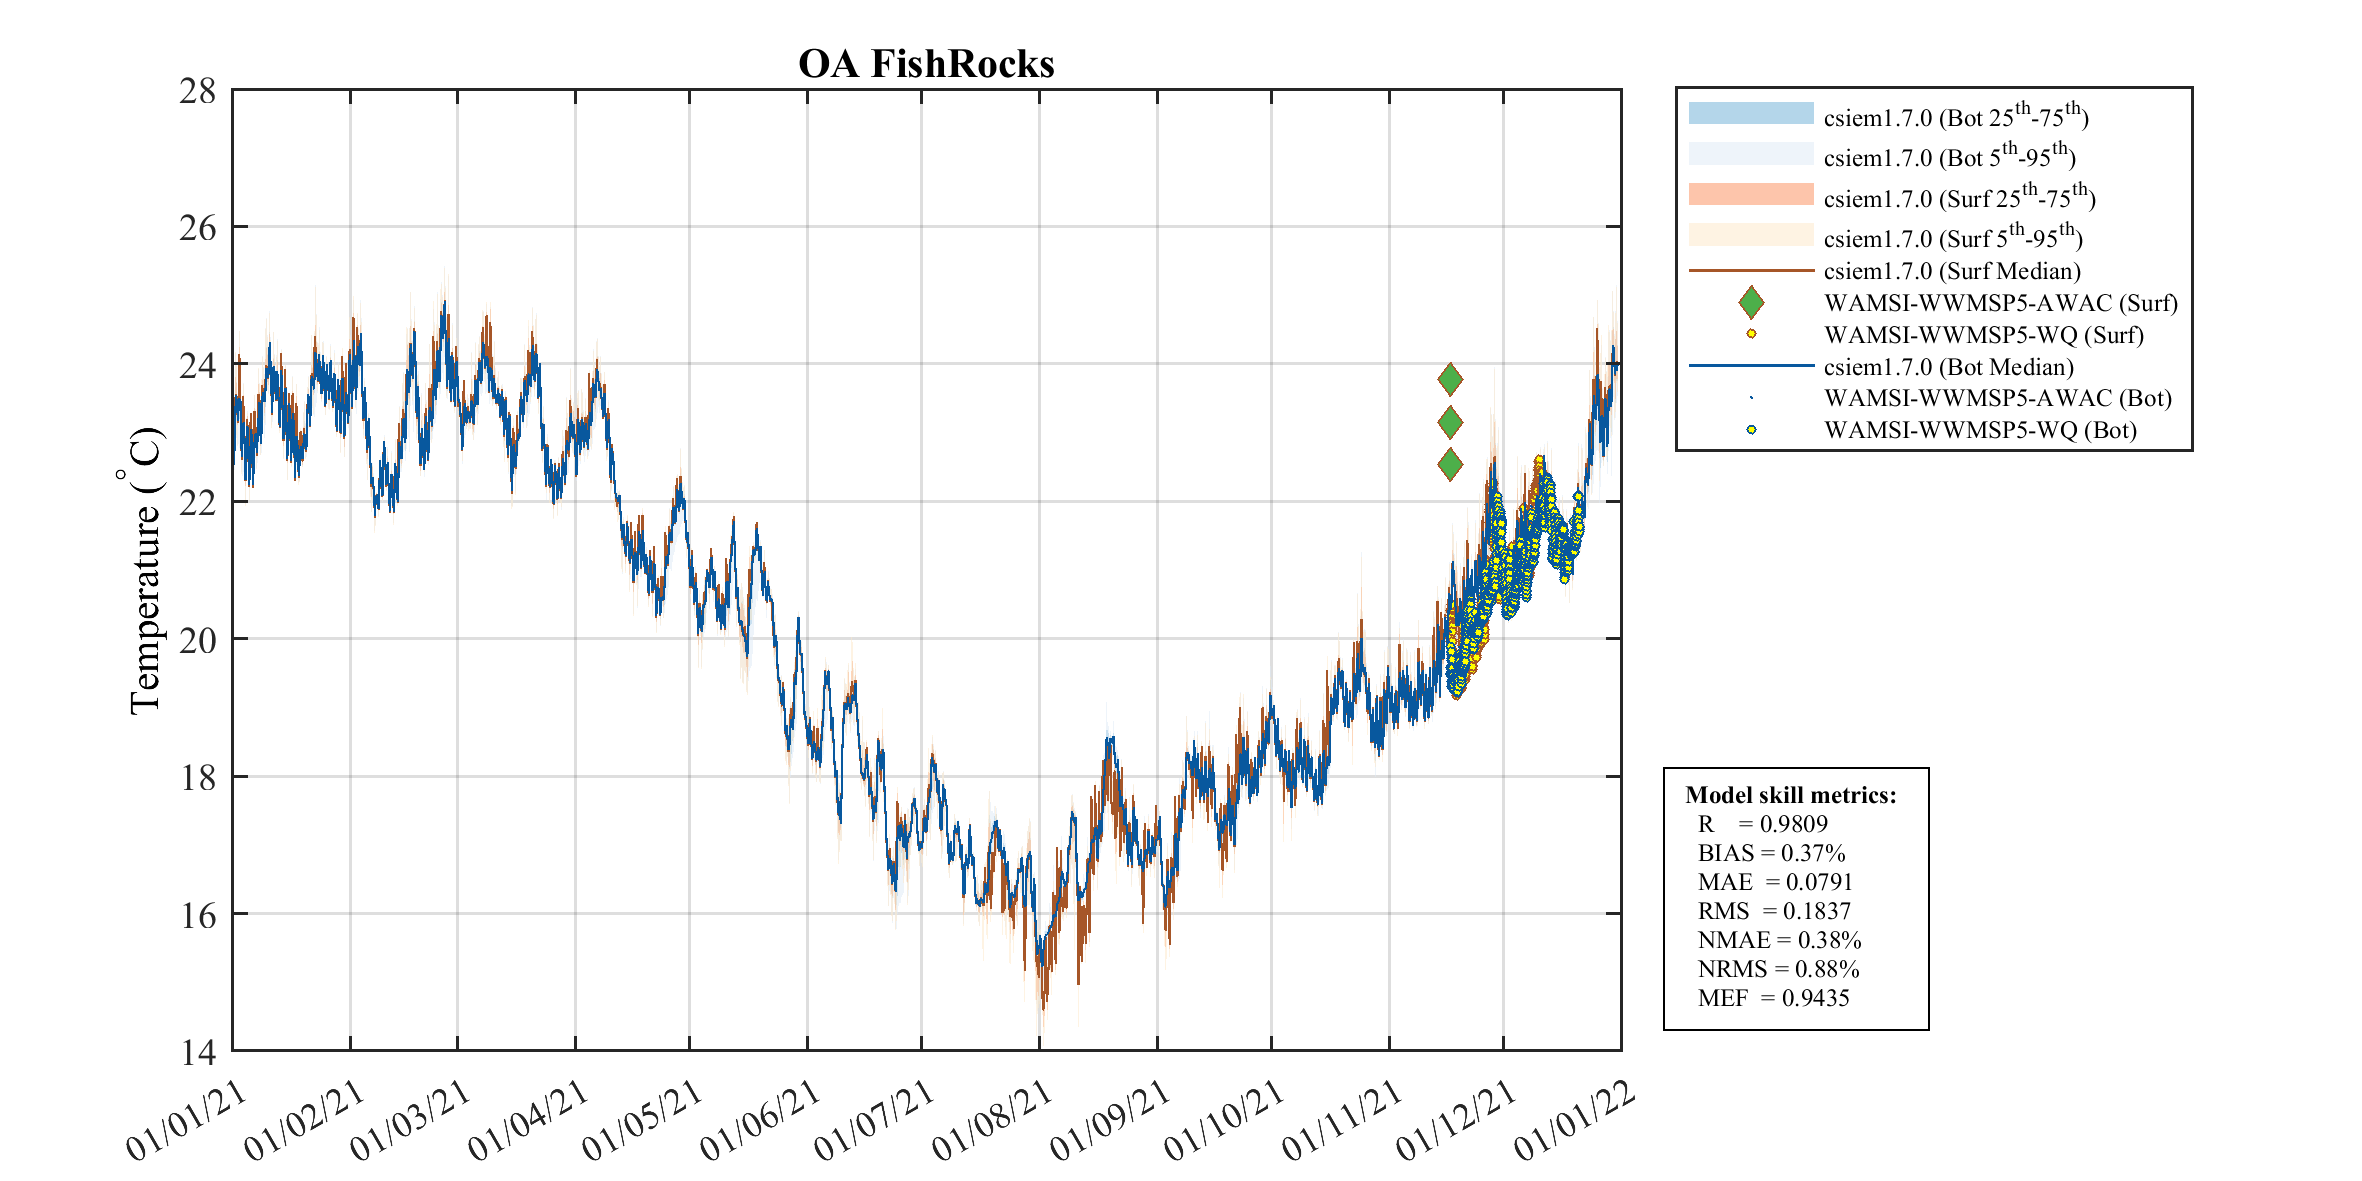
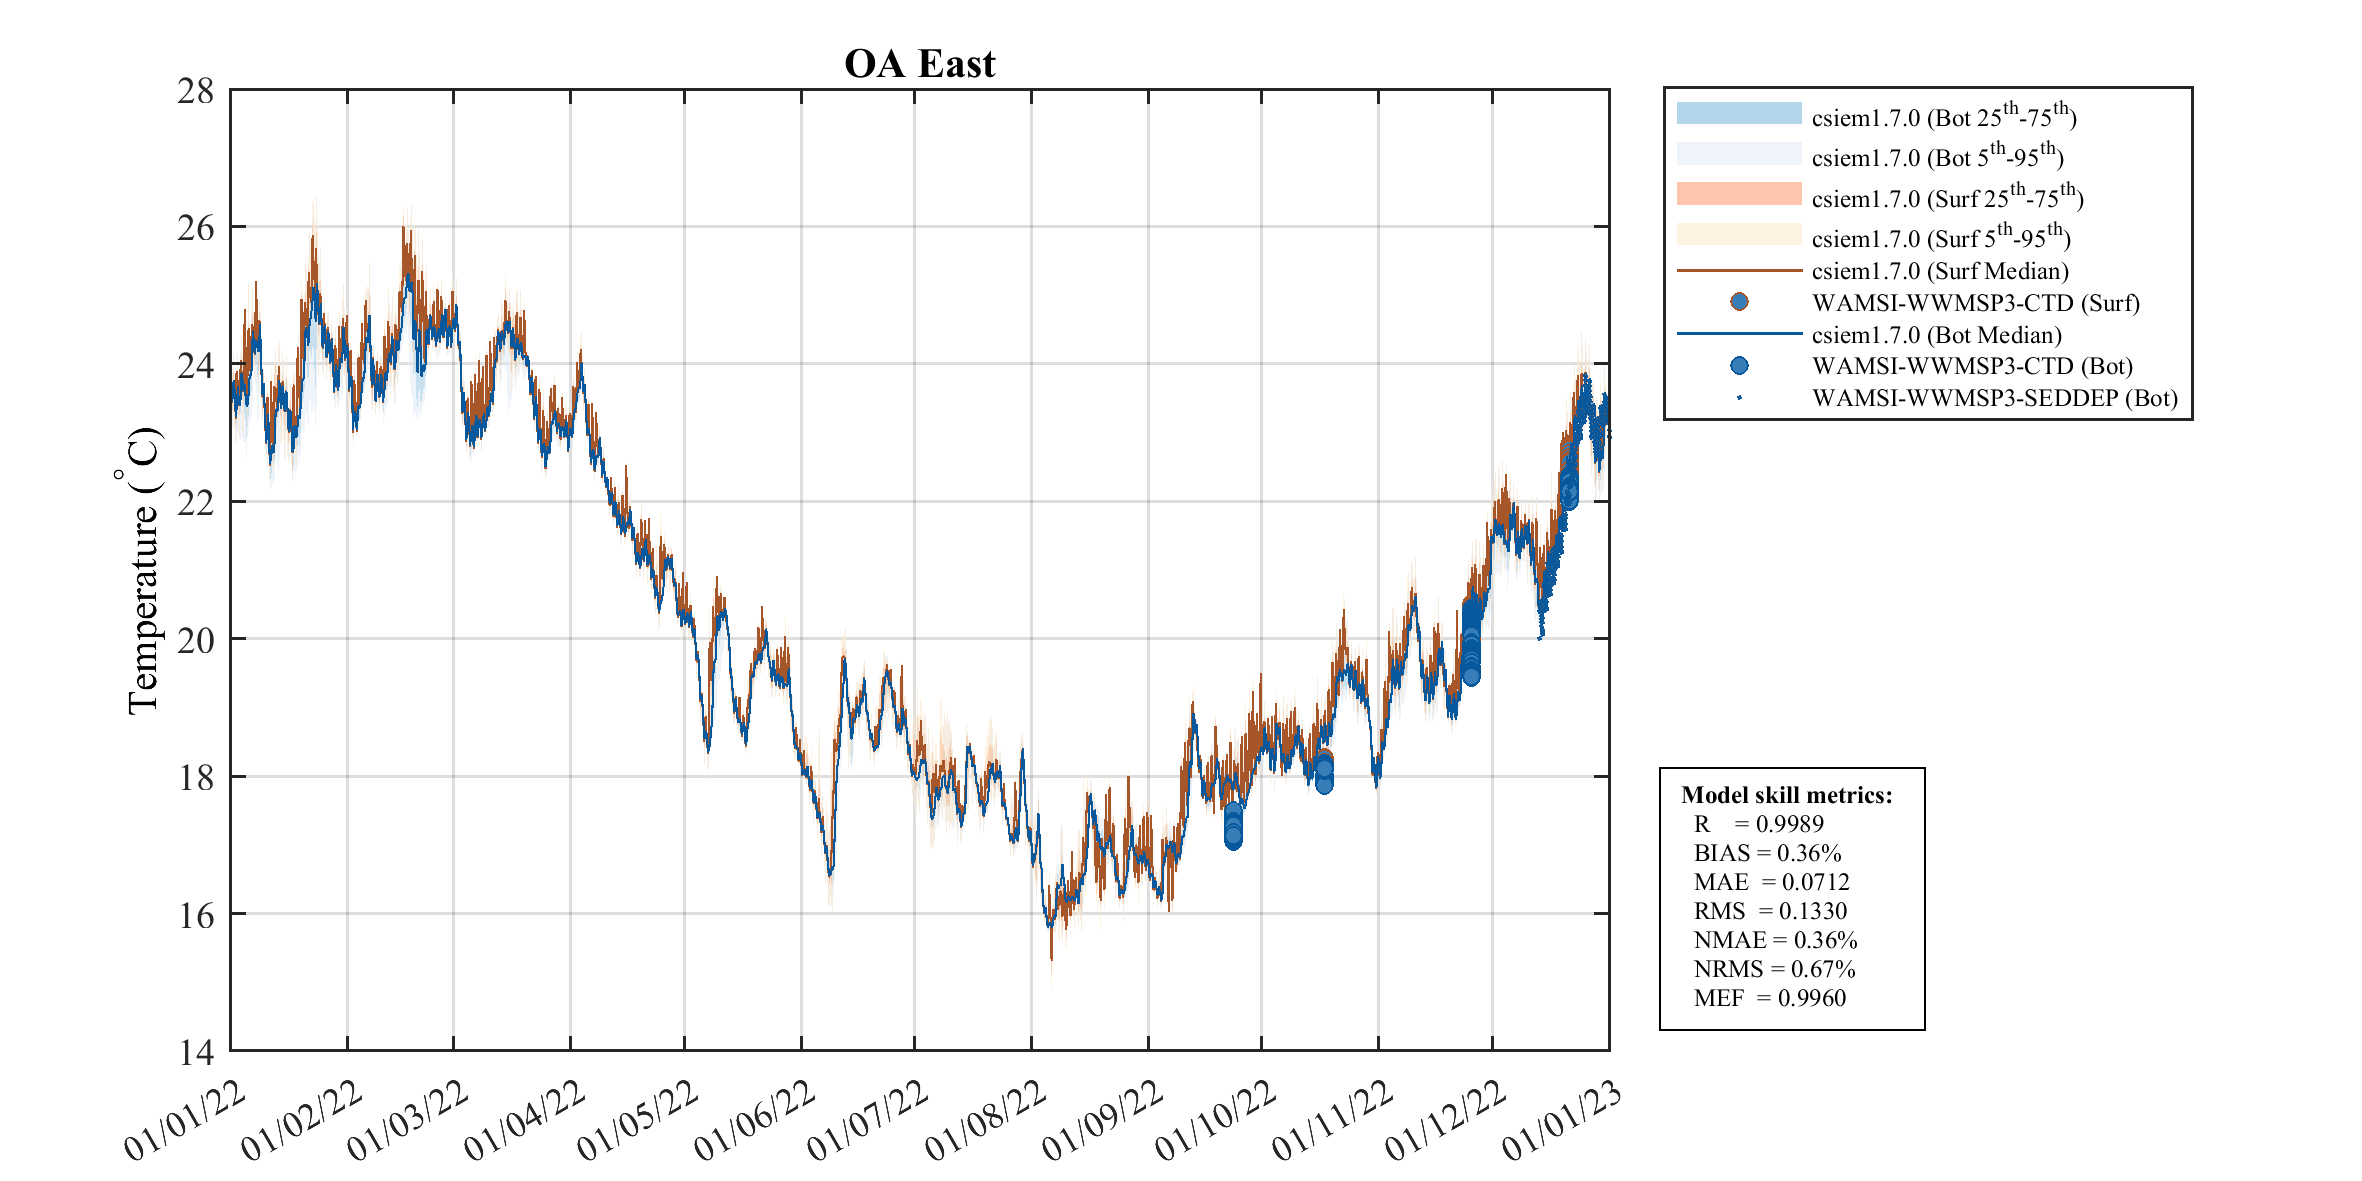
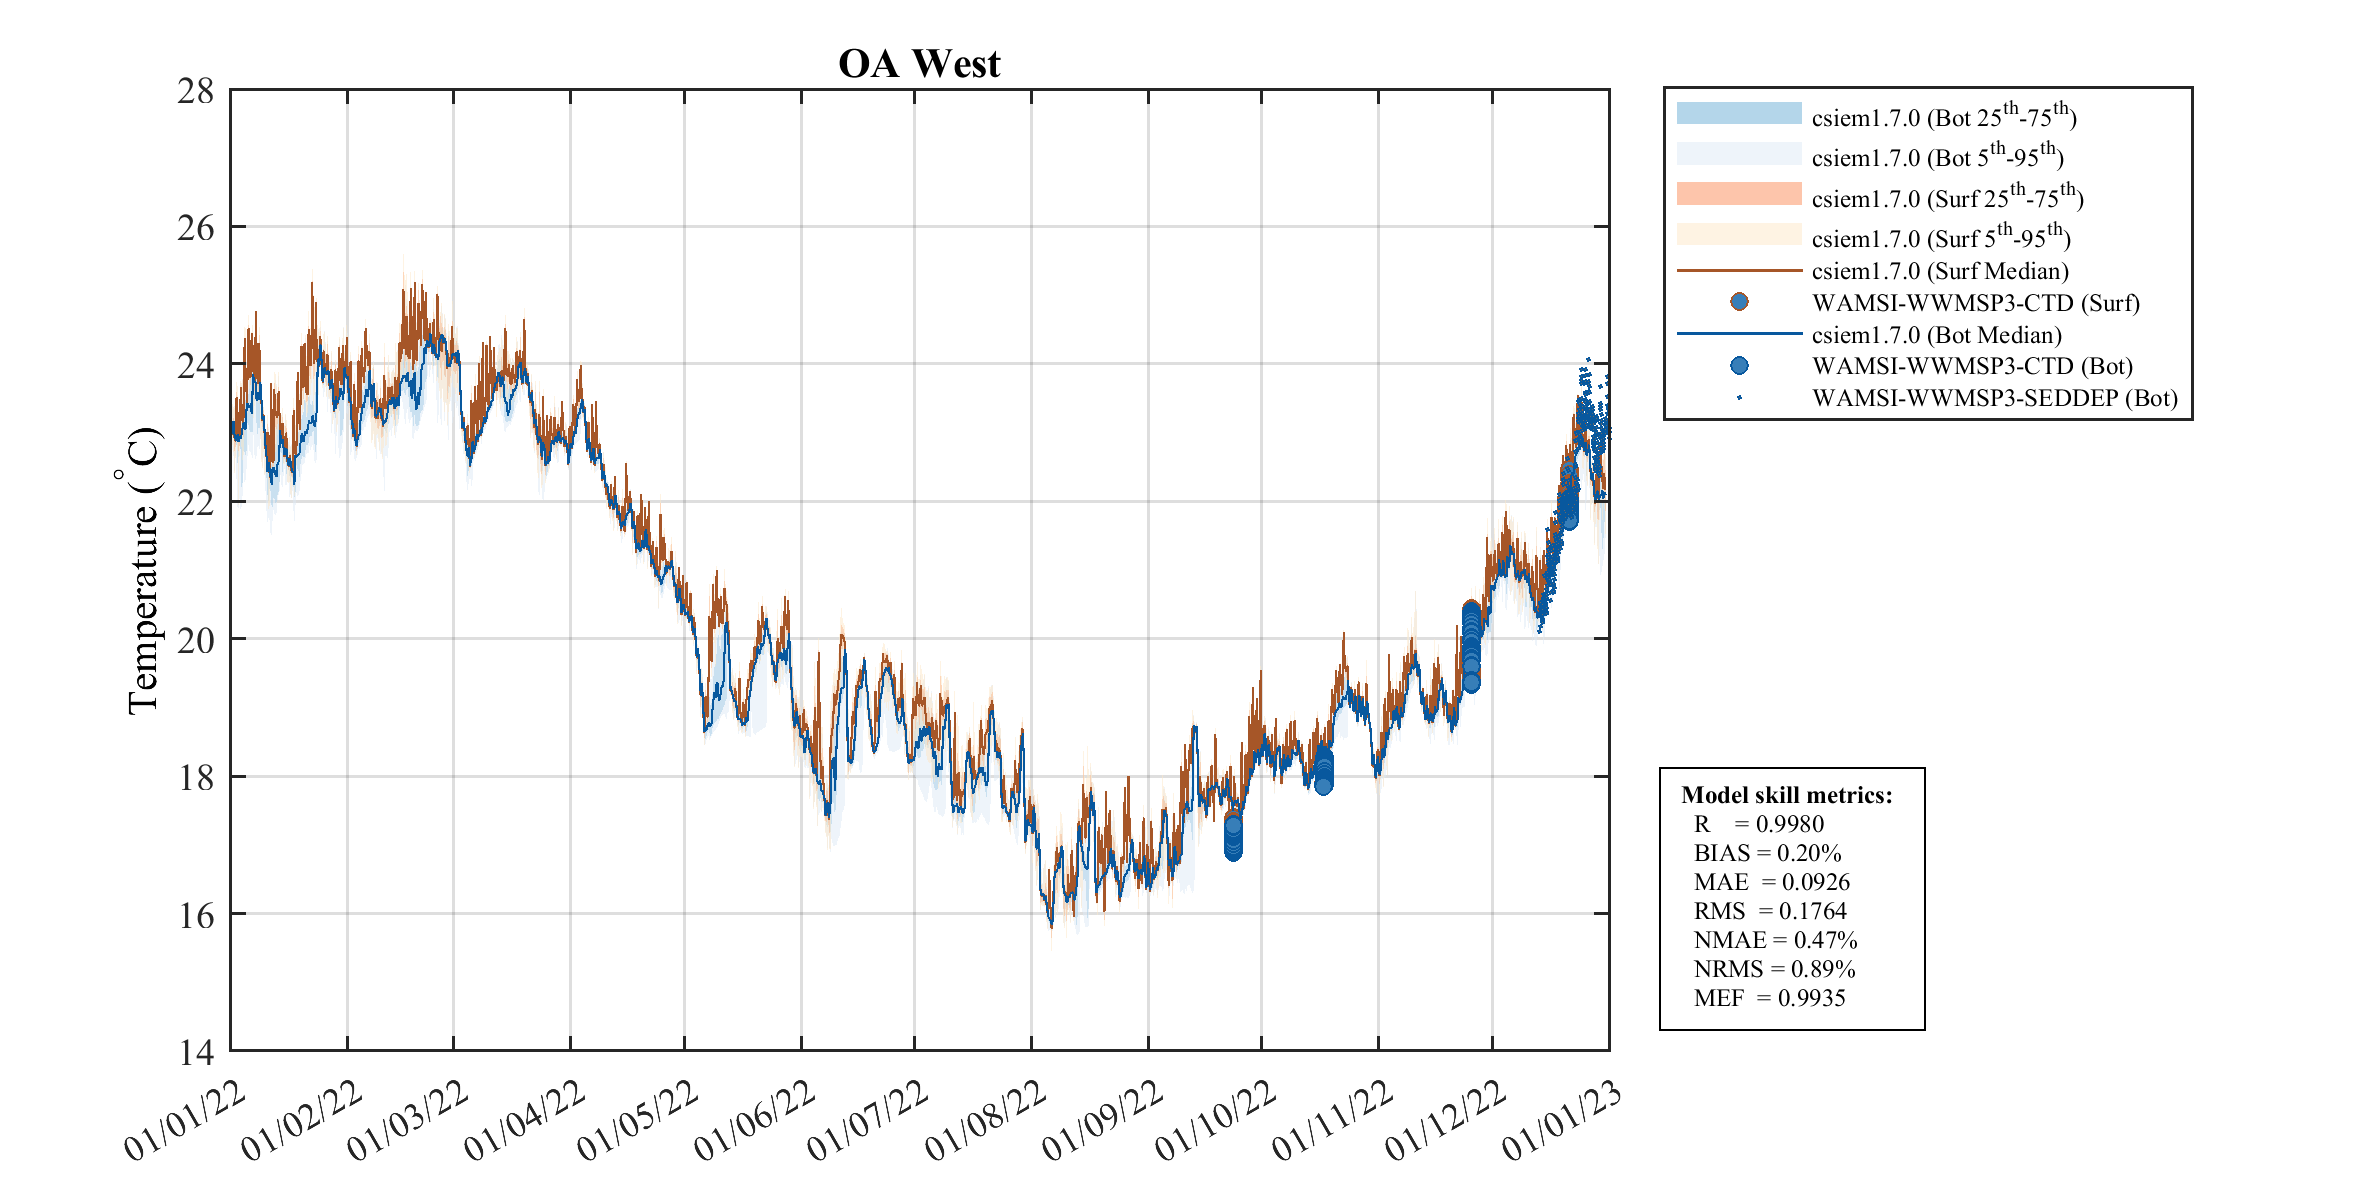
| 0023 — OA_Region | 0.106 | — | — | 0.041 | 0.111 | 0.165 |
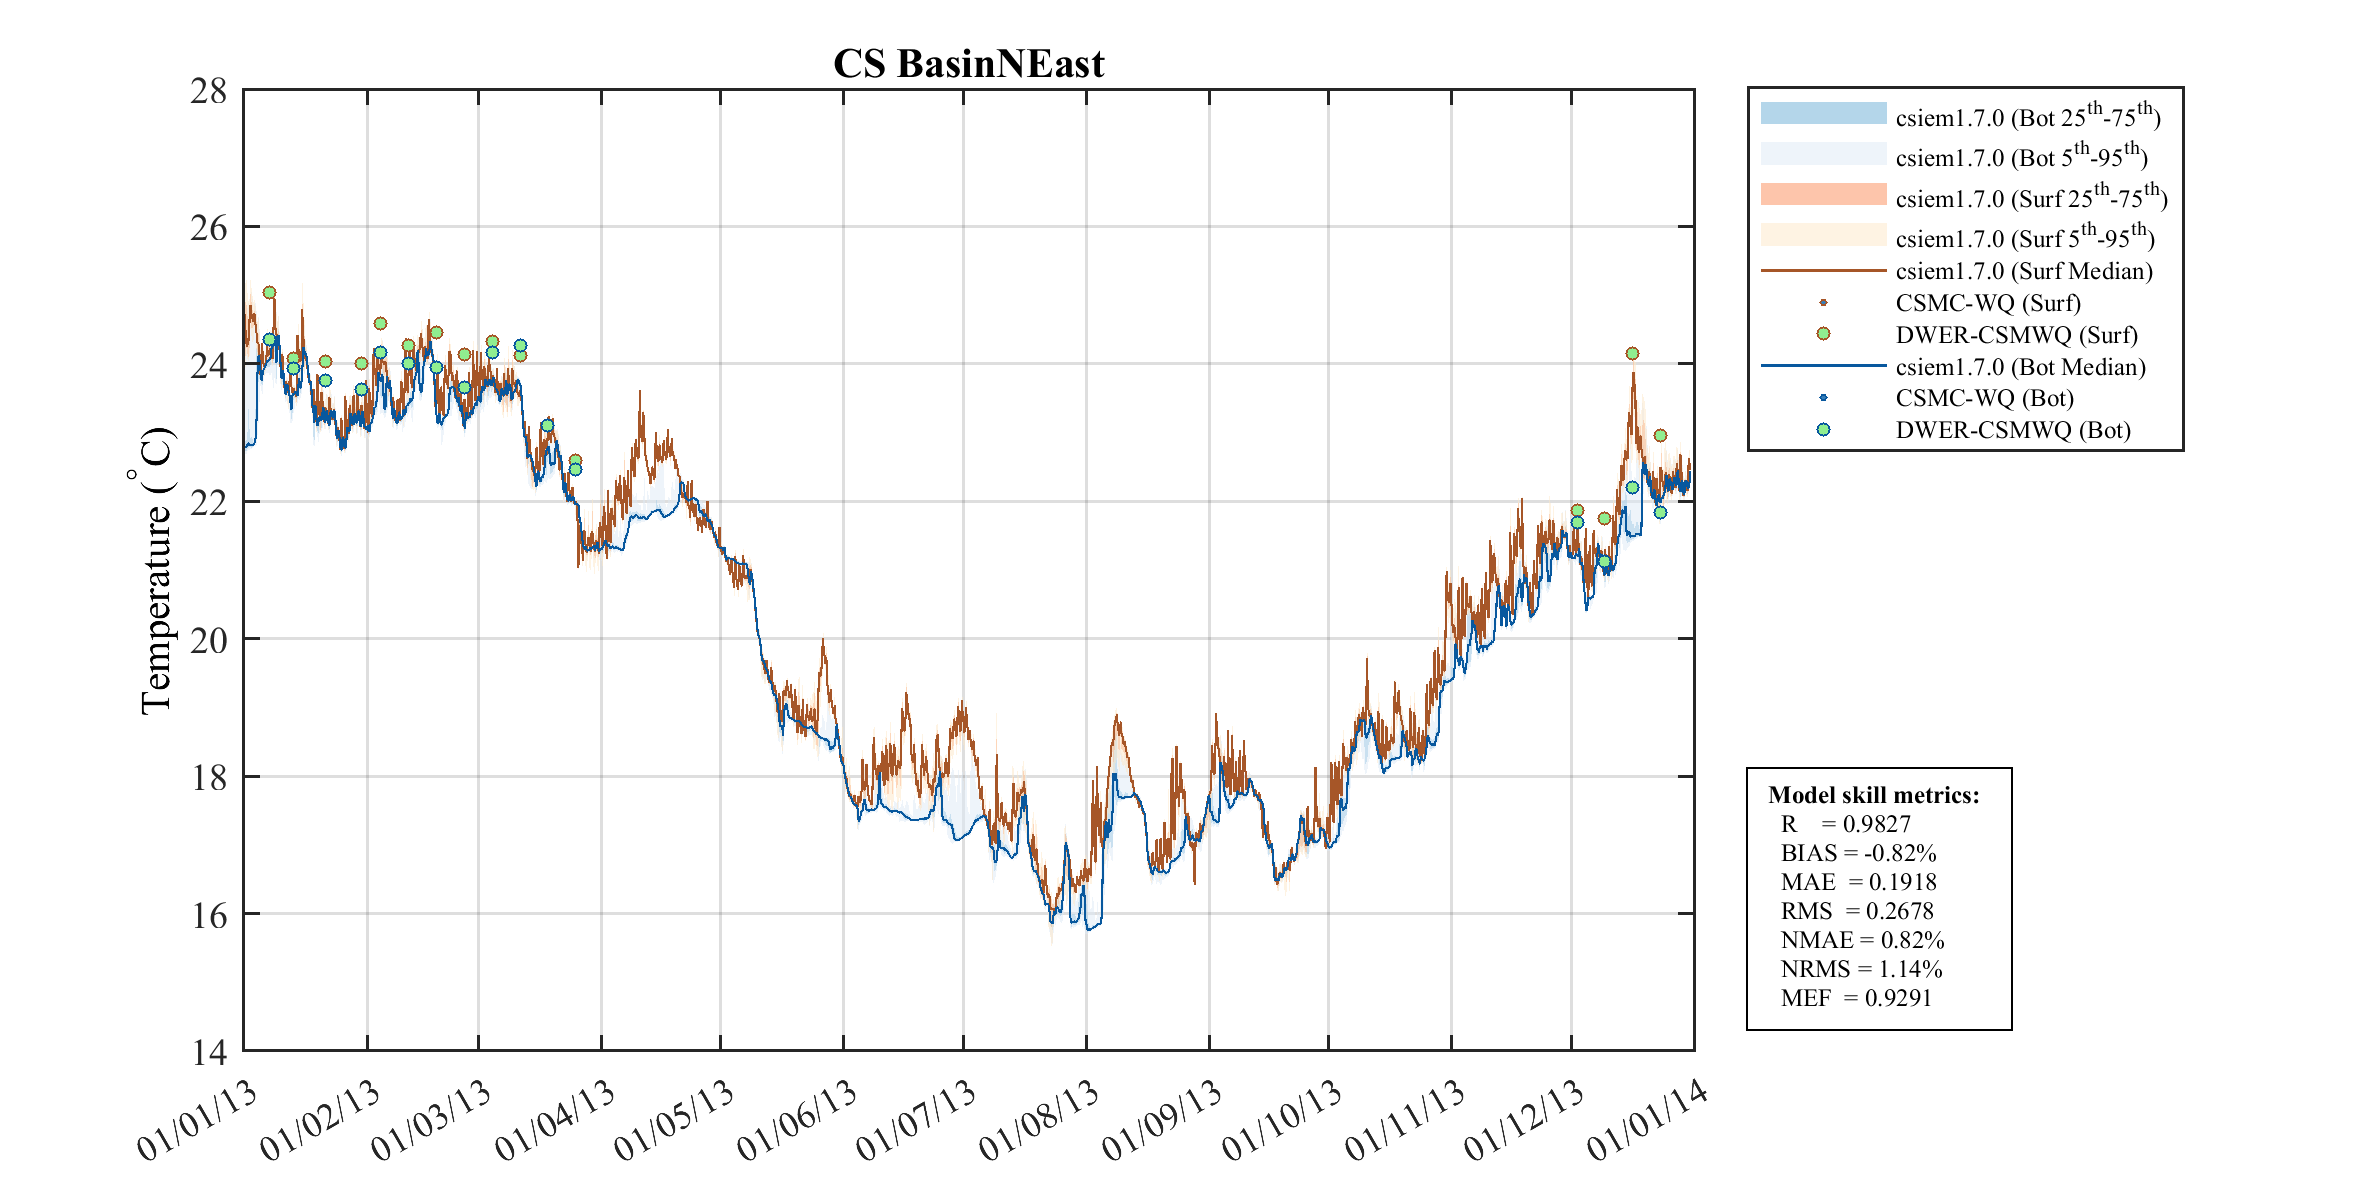
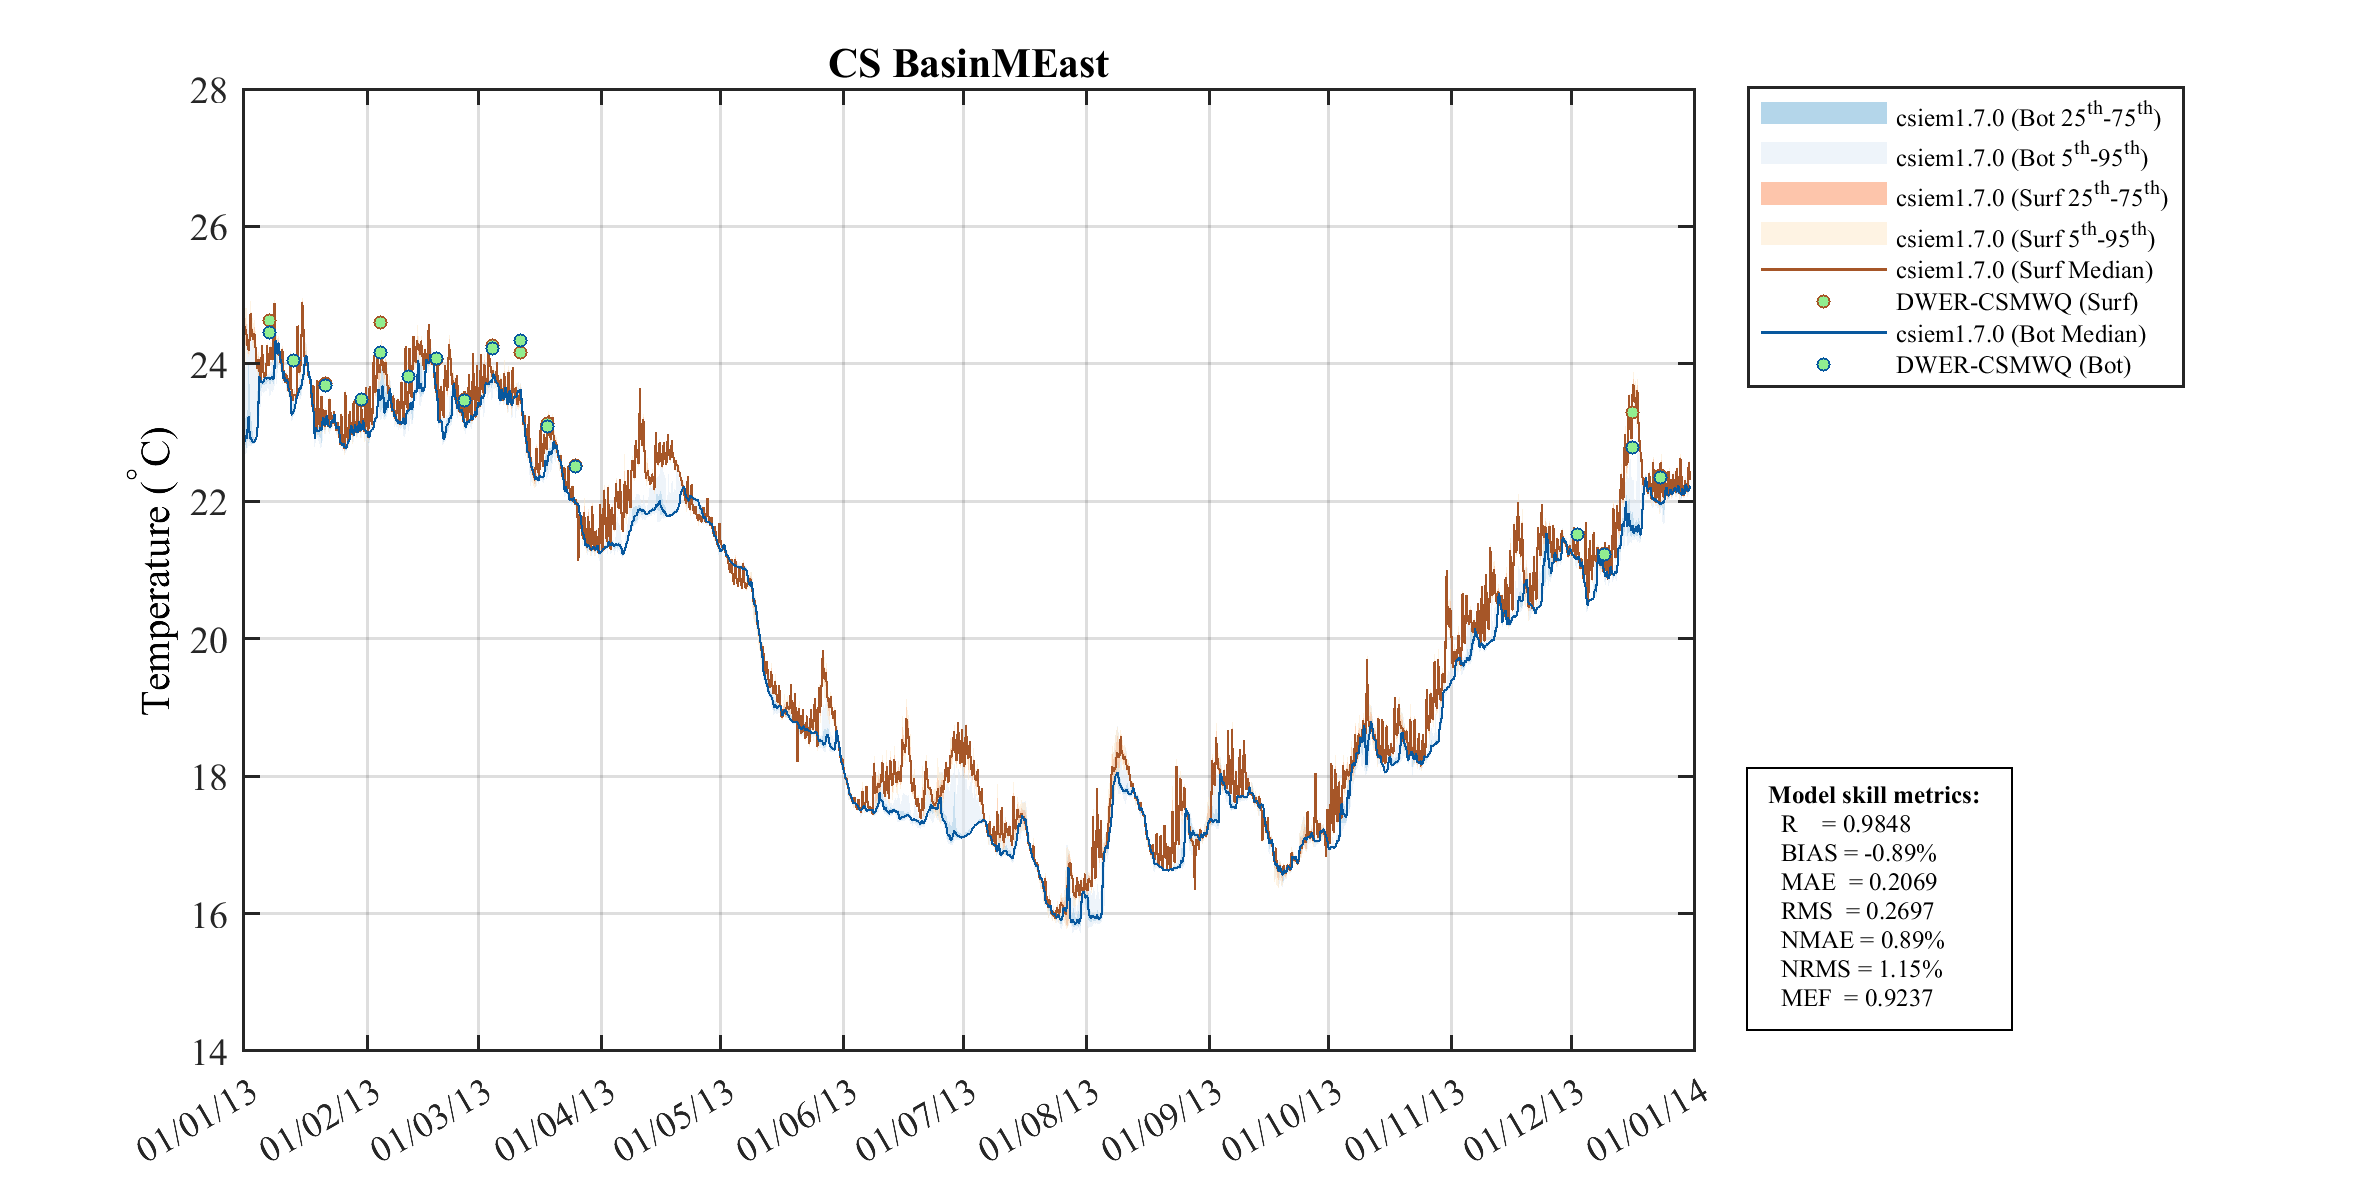
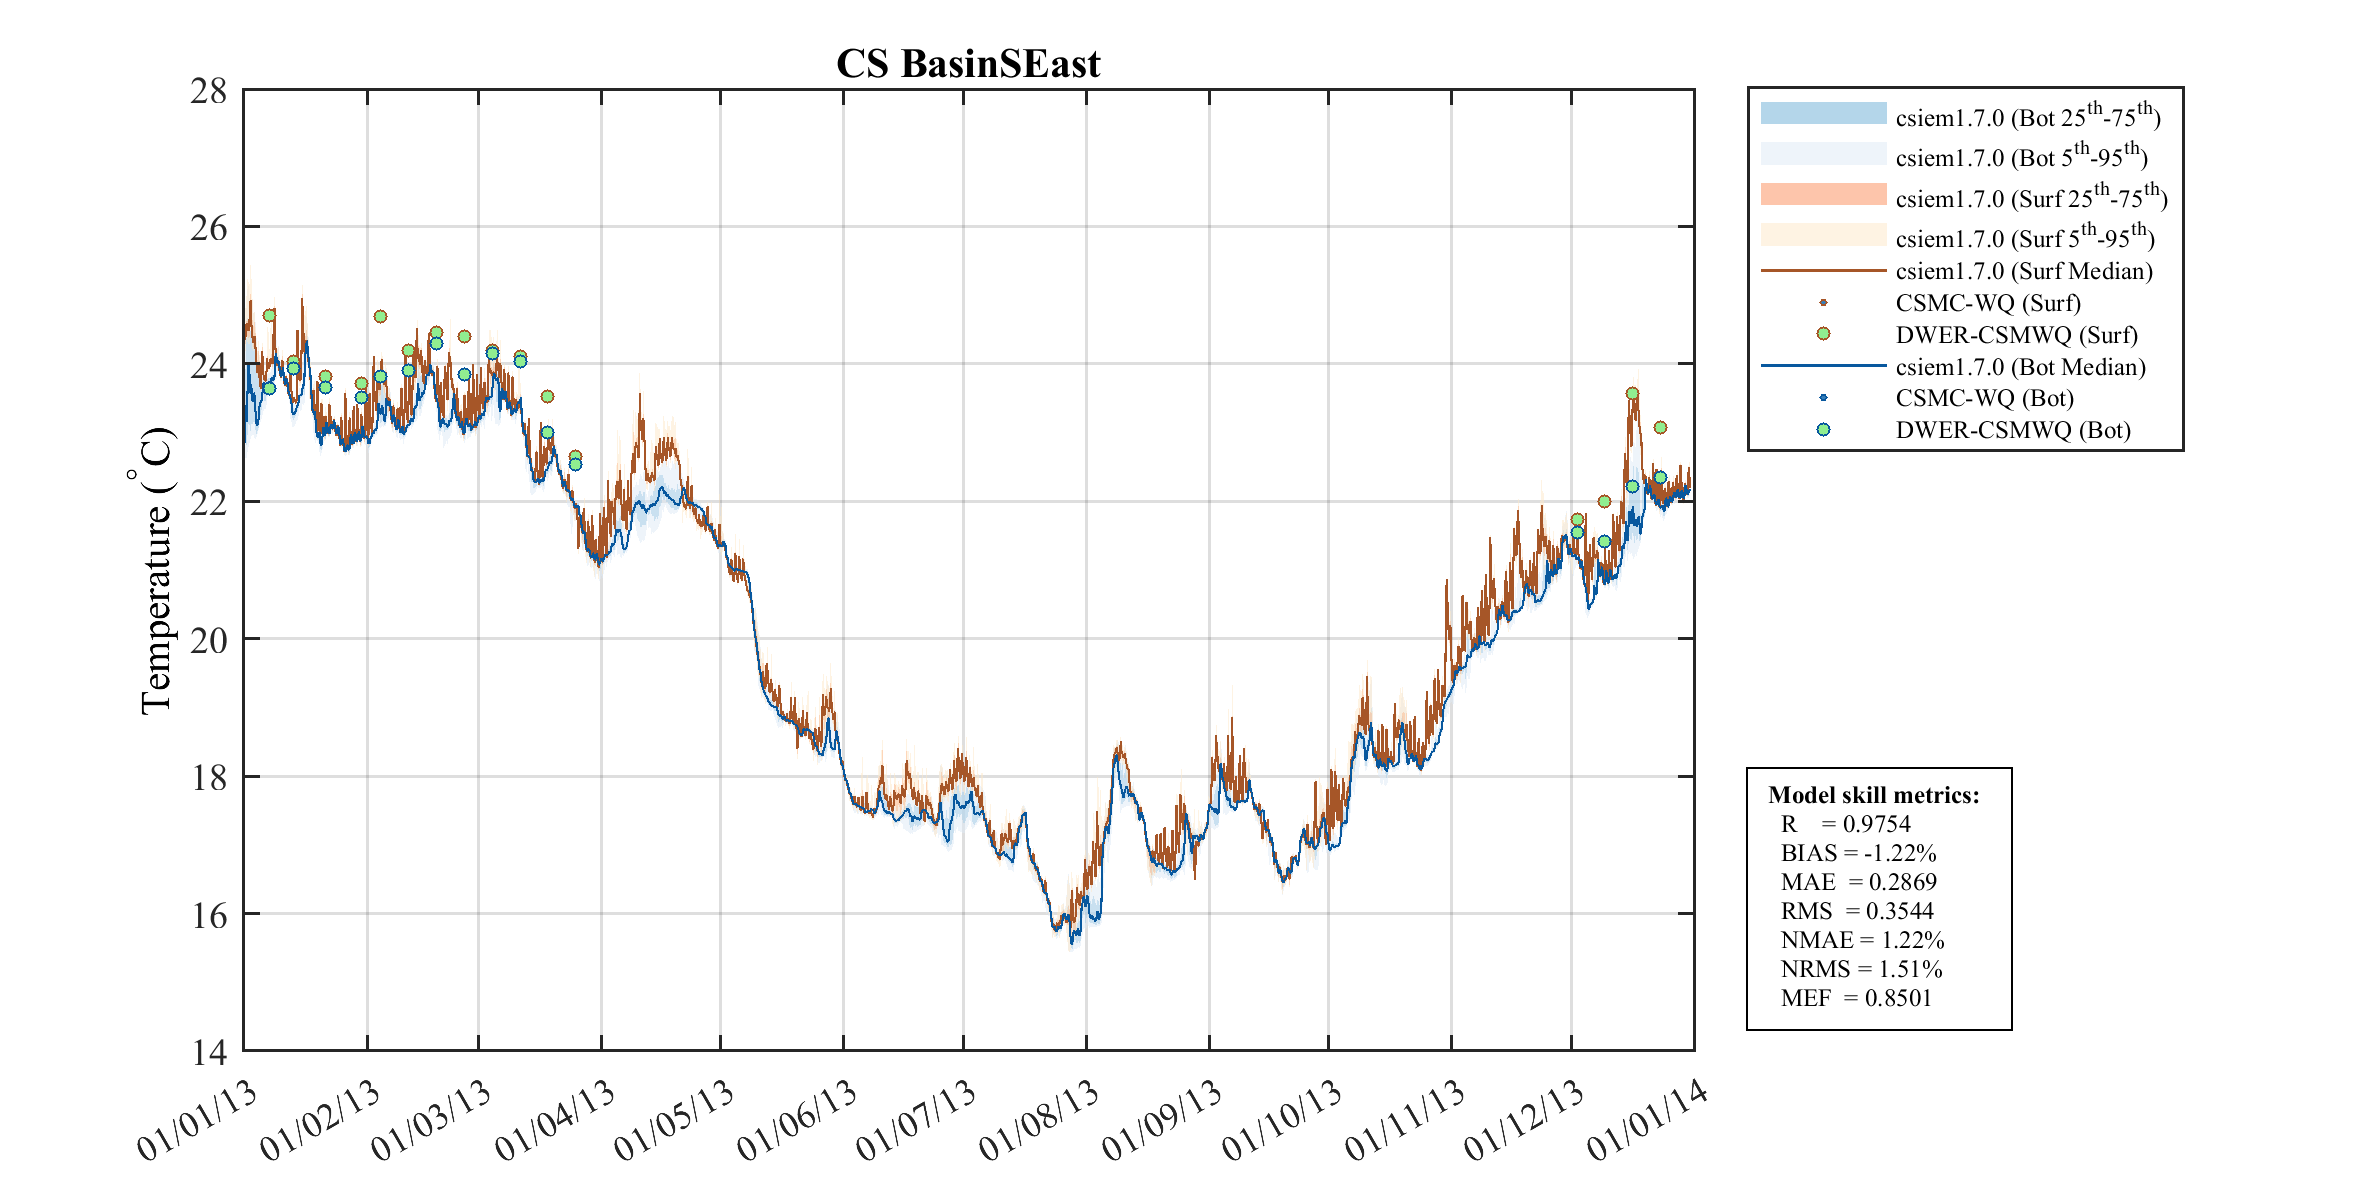
| 0014 — CS_Region | 0.255 | 1.597 | 0.009 | 0.311 | 0.155 | 0.112 |
| 0059 — SW_Region | 0.112 | 0.190 | 0.027 | 0.100 | 0.134 | 0.099 |
| 0058 — Comet_Region | — | 0.247 | — | — | 0.149 | — |
| 0075 — IO_NRSROTT | 0.210 | 0.306 | 2.583 | 3.334 | 2.879 | — |
Correlation Coefficient (R)
| Region | 2013 | 2015 | 2020 | 2021 | 2022 | 2023 |
|---|---|---|---|---|---|---|
| 0055 — OL_Region | 0.998 | 0.980 | 0.994 | 0.964 | 0.976 | 0.994 |
| 0053 — DWC_Region | 1.000 | 0.992 | 0.995 | 0.992 | 0.993 | 0.996 |
| 0054 — CU_Region | 0.999 | 0.999 | 0.999 | 0.992 | 0.999 | 0.999 |
| 0036 — GR_Region | 0.999 | — | 1.000 | 1.000 | 0.991 | 1.000 |
| 0044 — GI_NthRegion | — | — | — | — | 0.994 | 0.998 |
| 0023 — OA_Region | 0.998 | — | — | 0.994 | 0.997 | 0.992 |
| 0014 — CS_Region | 0.974 | 0.651 | 0.998 | 0.875 | 0.981 | 0.995 |
| 0059 — SW_Region | 0.995 | 0.994 | 0.998 | 0.997 | 0.996 | 0.997 |
| 0058 — Comet_Region | — | 0.994 | — | — | 0.983 | — |
| 0075 — IO_NRSROTT | 0.962 | 0.925 | 0.196 | 0.190 | 0.268 | — |
Bias (%)
| Region | 2013 | 2015 | 2020 | 2021 | 2022 | 2023 |
|---|---|---|---|---|---|---|
| 0055 — OL_Region | +0.76 | -0.42 | -0.22 | -0.50 | -0.16 | -0.05 |
| 0053 — DWC_Region | -0.15 | -0.31 | -0.22 | -0.15 | -0.04 | +0.01 |
| 0054 — CU_Region | -0.15 | -0.09 | -0.05 | -0.10 | -0.17 | +0.06 |
| 0036 — GR_Region | -0.06 | — | -0.04 | +0.02 | -0.43 | +0.12 |
| 0044 — GI_NthRegion | — | — | — | — | -0.60 | +0.25 |
| 0023 — OA_Region | -0.47 | — | — | -0.20 | -0.45 | -0.74 |
| 0014 — CS_Region | -0.27 | -5.64 | -0.00 | -0.53 | -0.26 | -0.29 |
| 0059 — SW_Region | -0.21 | -0.08 | -0.01 | -0.47 | -0.38 | -0.15 |
| 0058 — Comet_Region | — | -0.64 | — | — | -0.24 | — |
| 0075 — IO_NRSROTT | -0.45 | -0.32 | -11.73 | -17.13 | -12.77 | — |
MARVL aggregate assessment polygons