Simulation Year
2013
2015
2020
2021
2022
2023
Cockburn Sound assessment polygons.
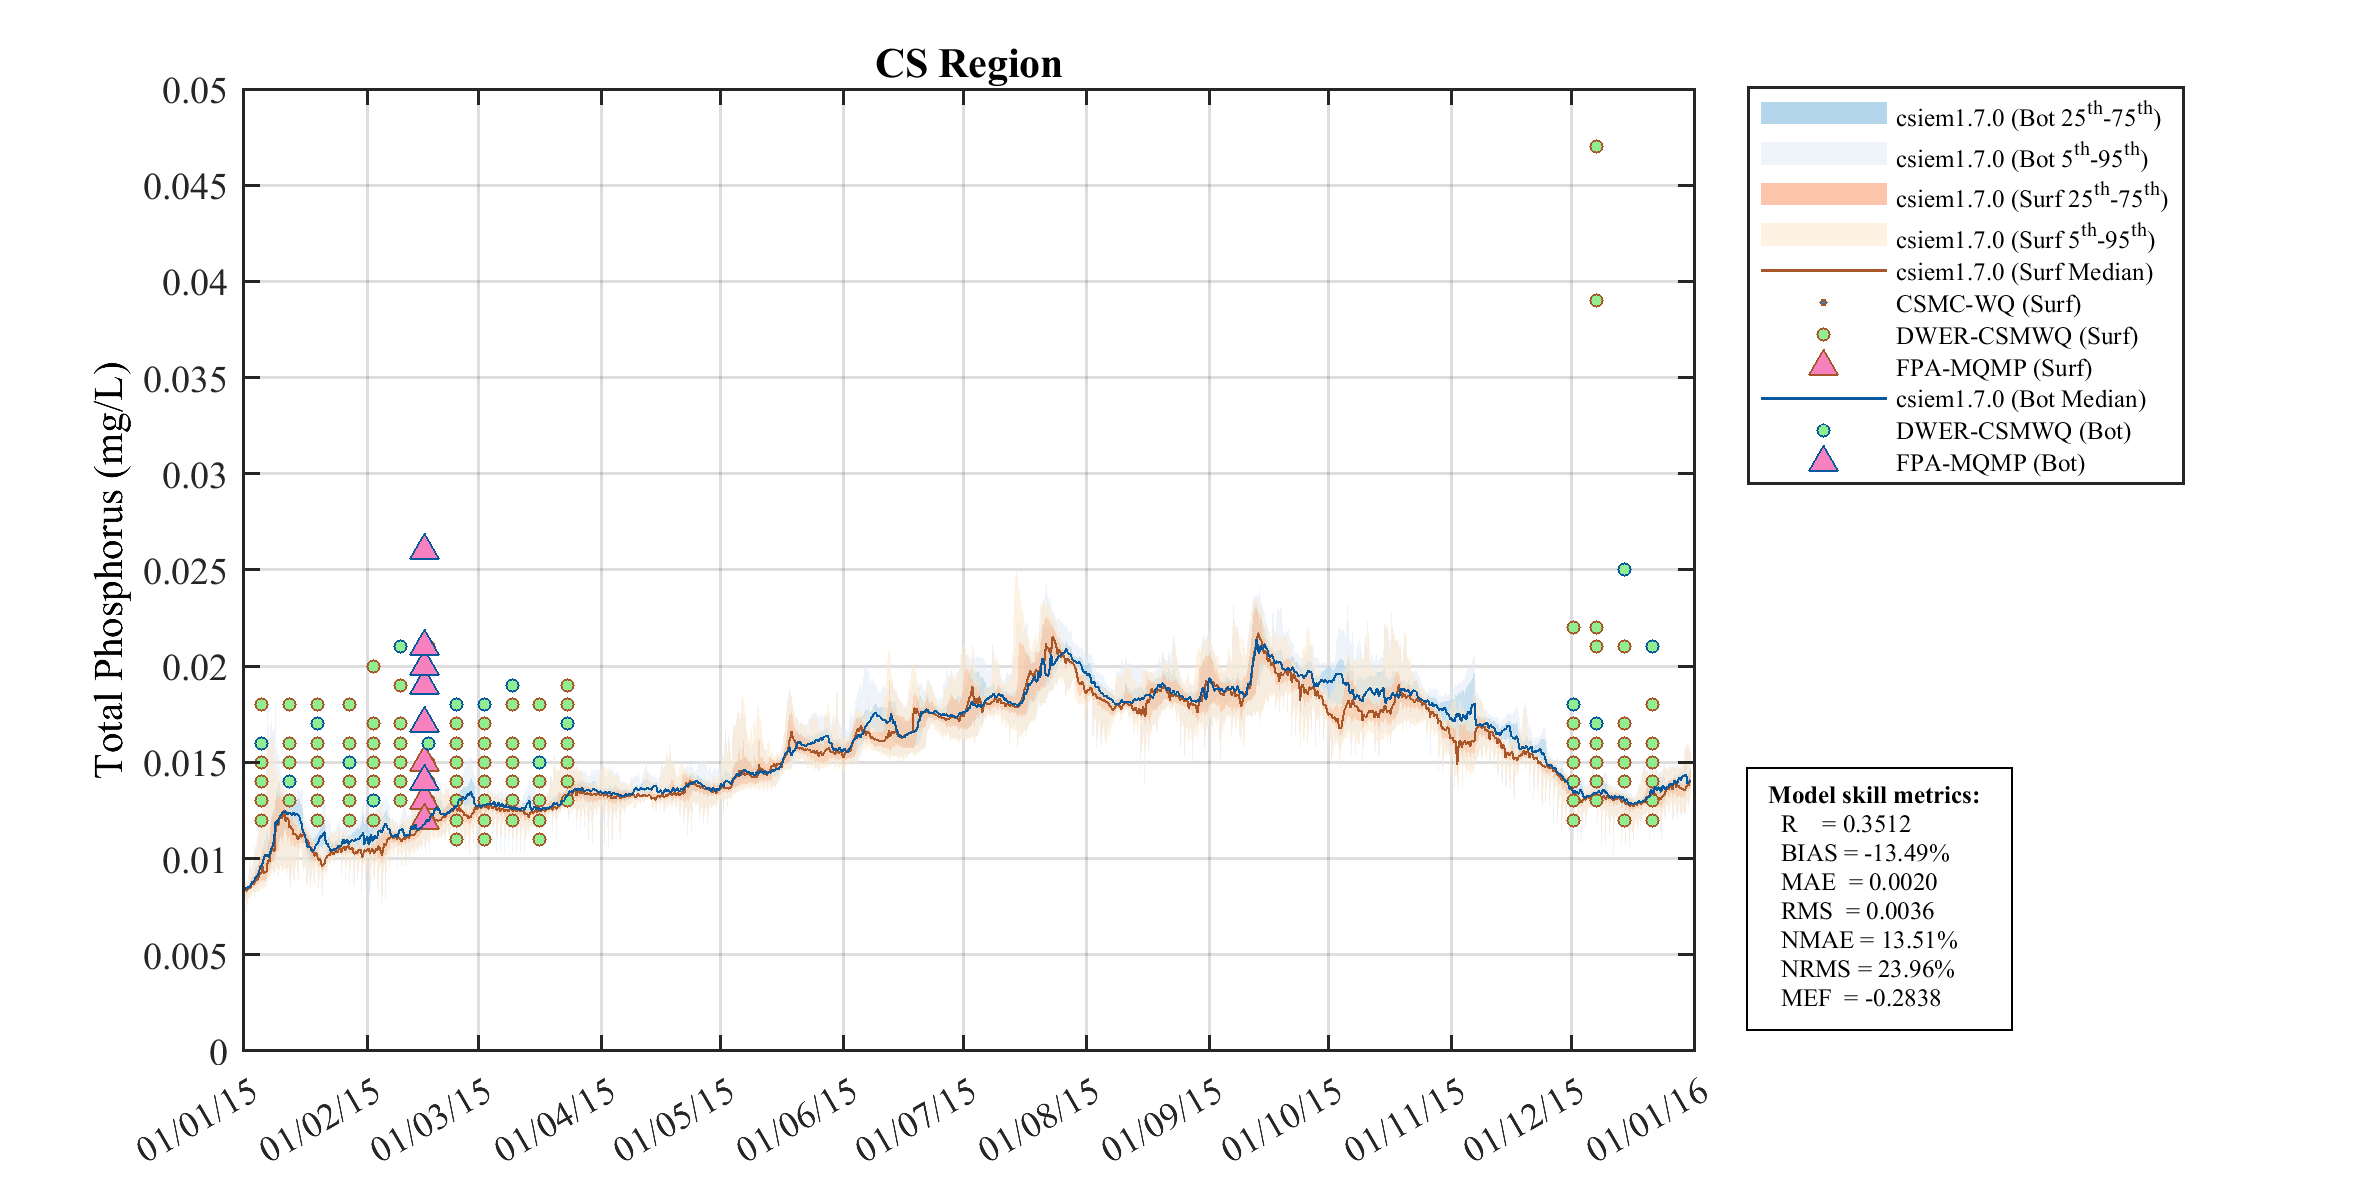
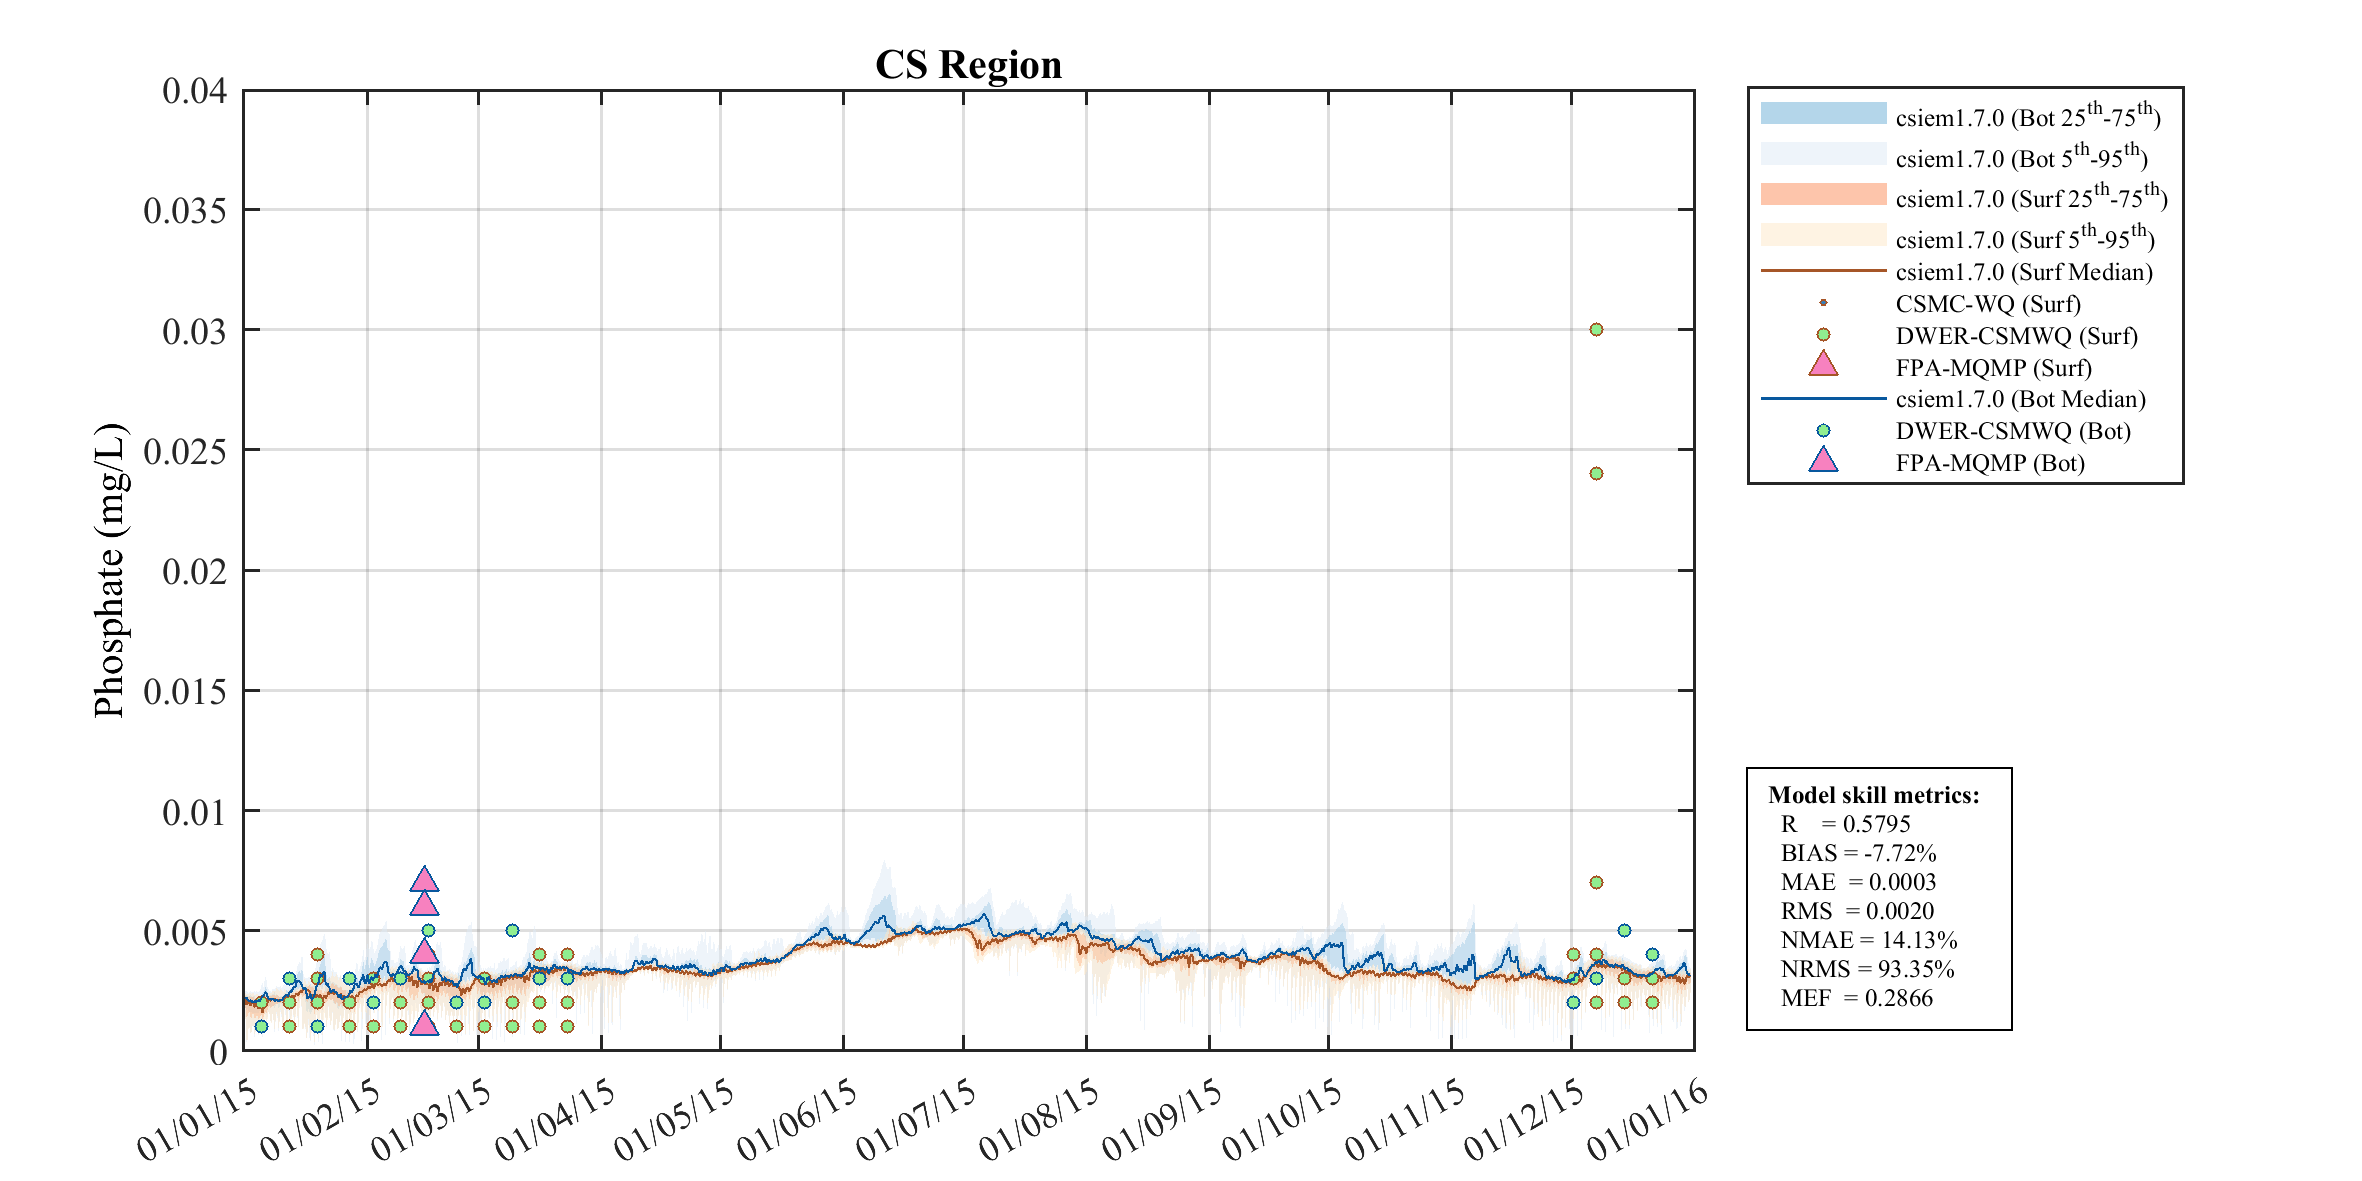
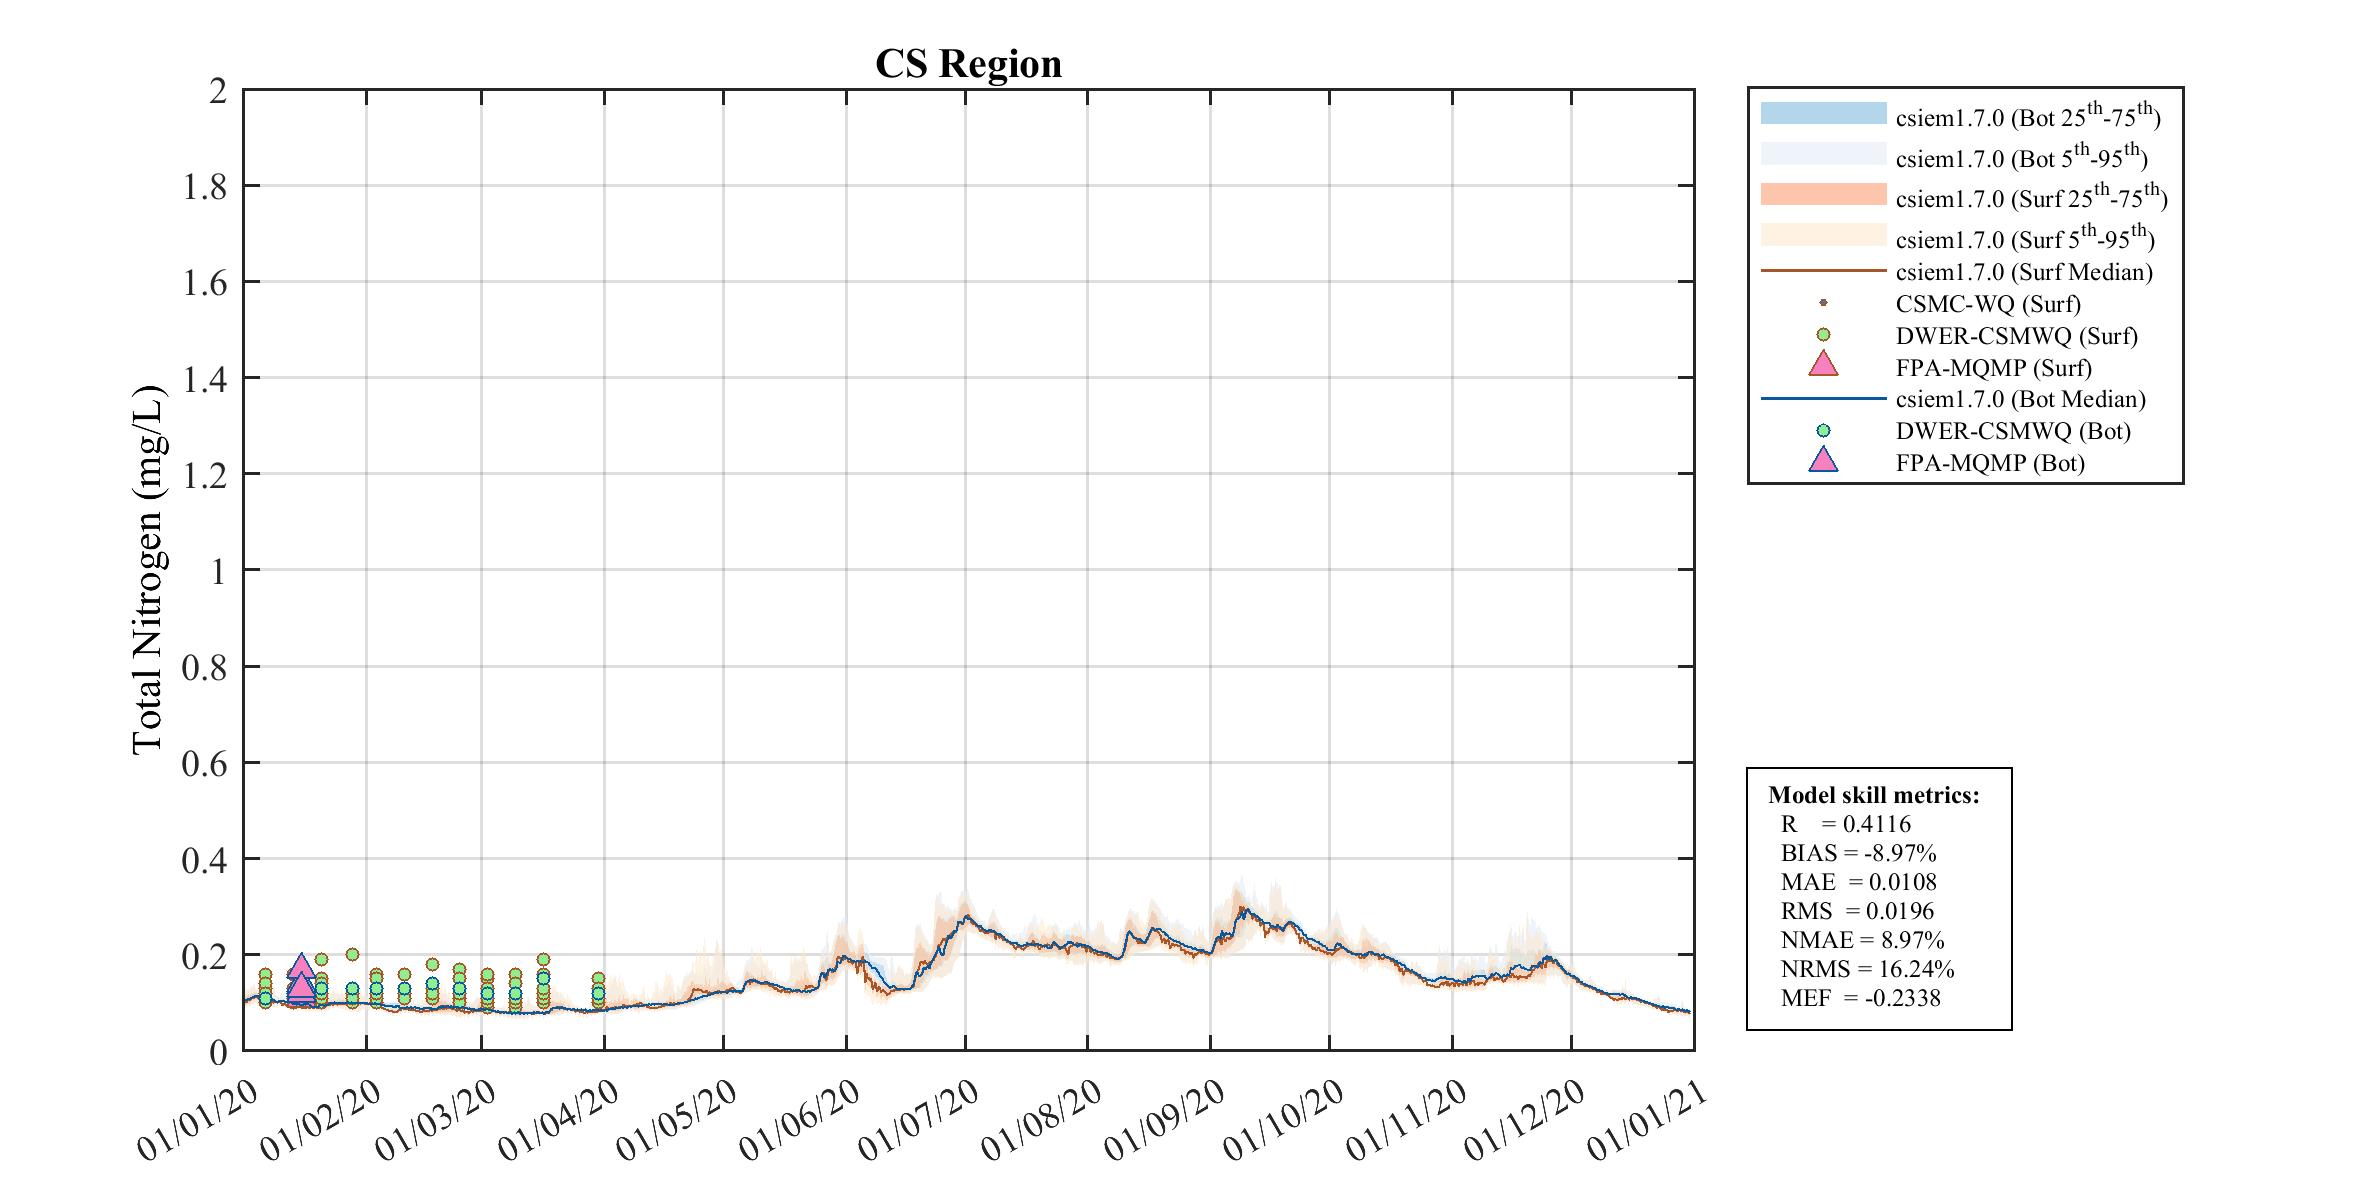
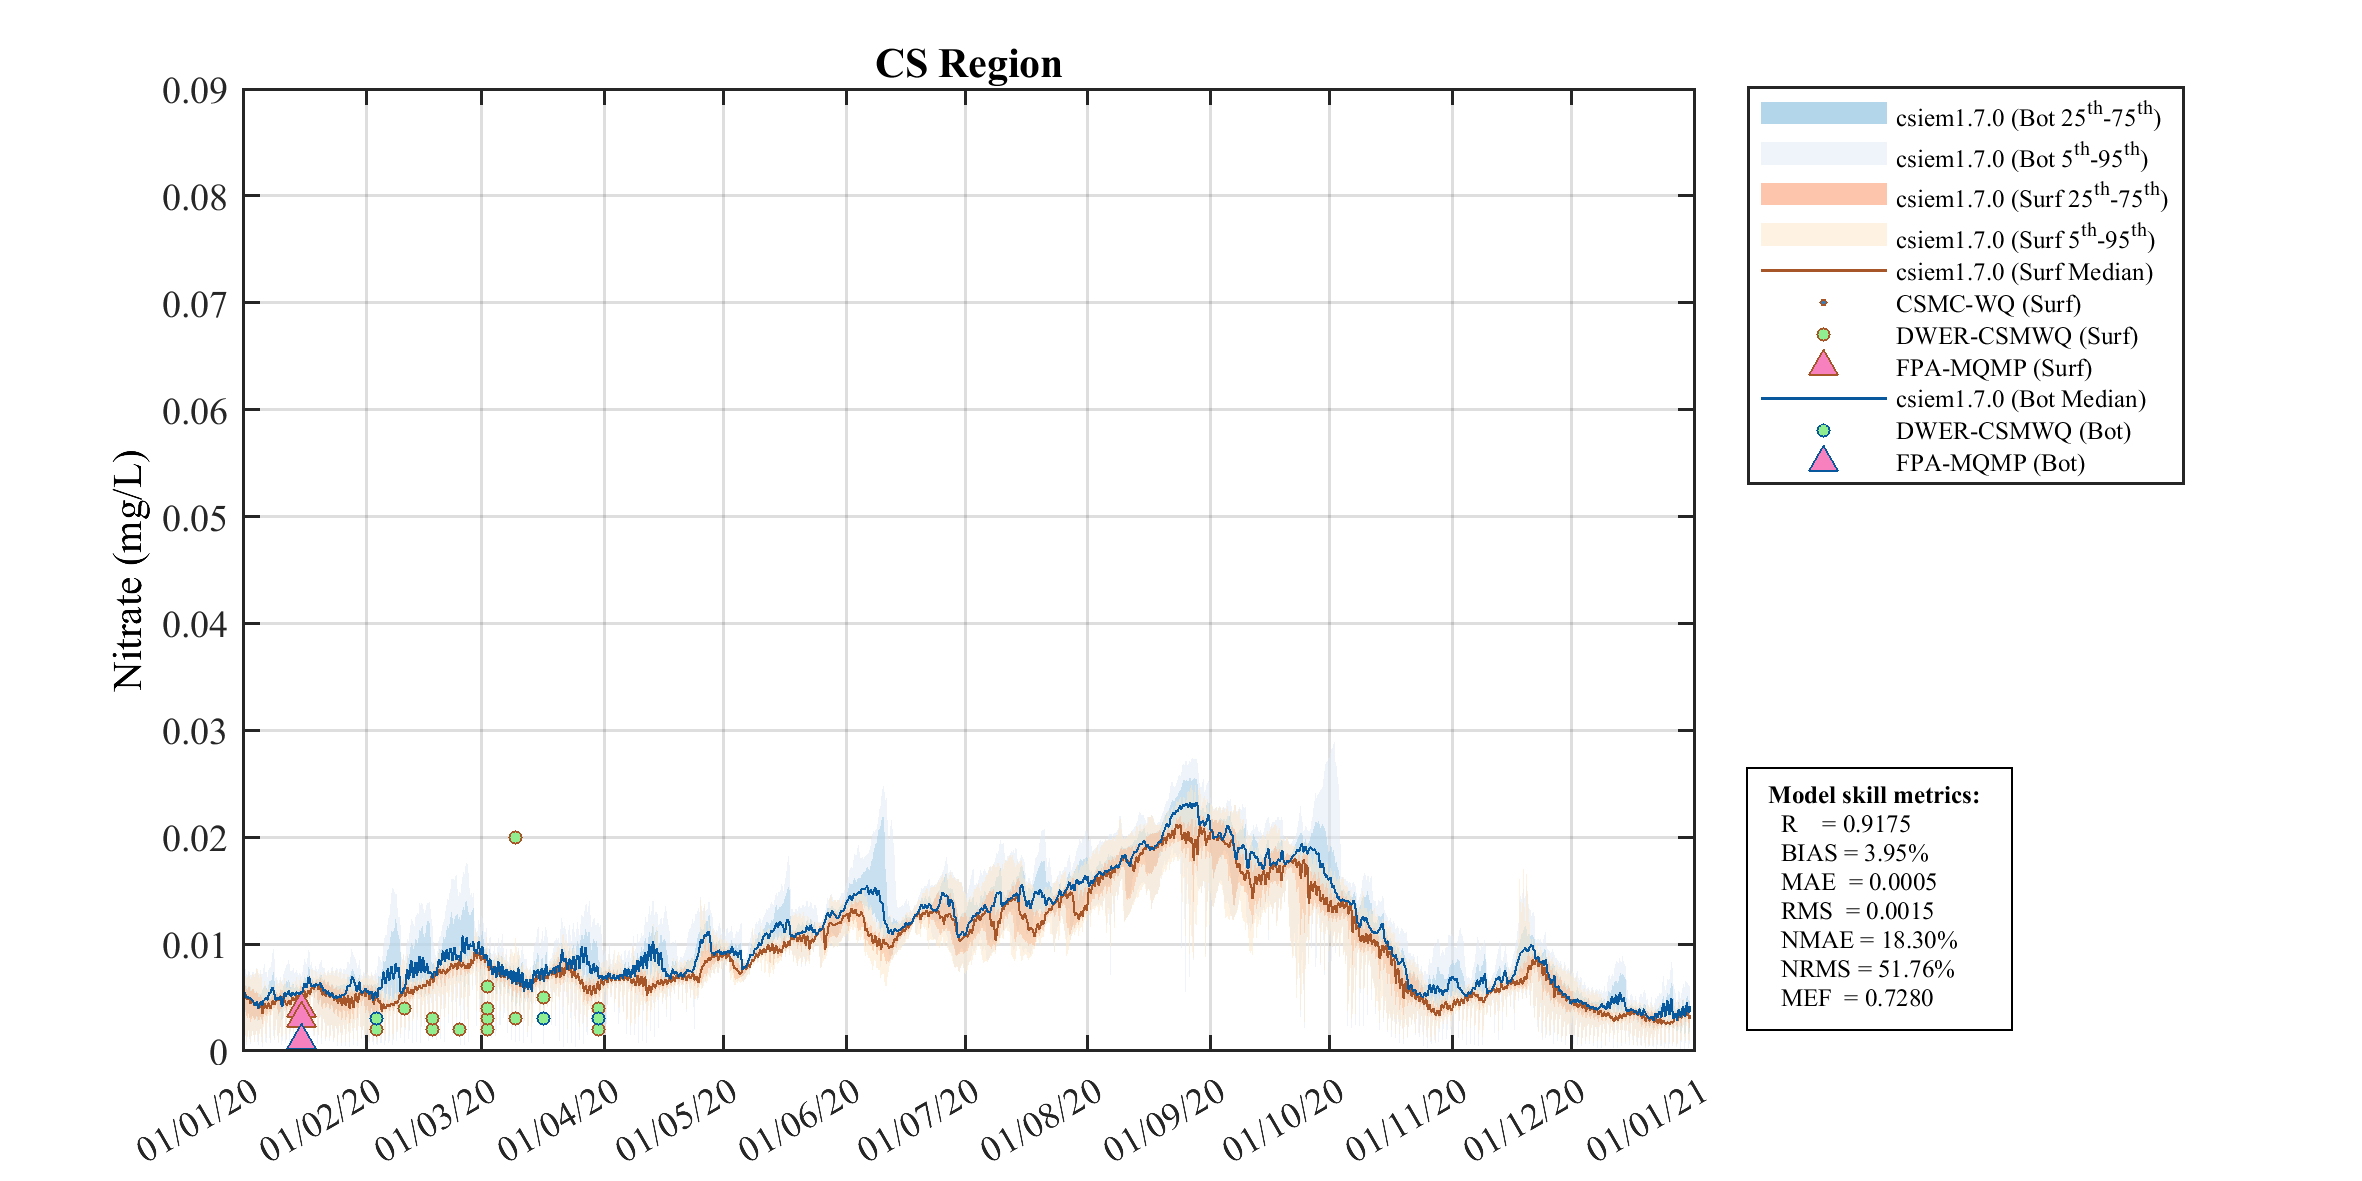
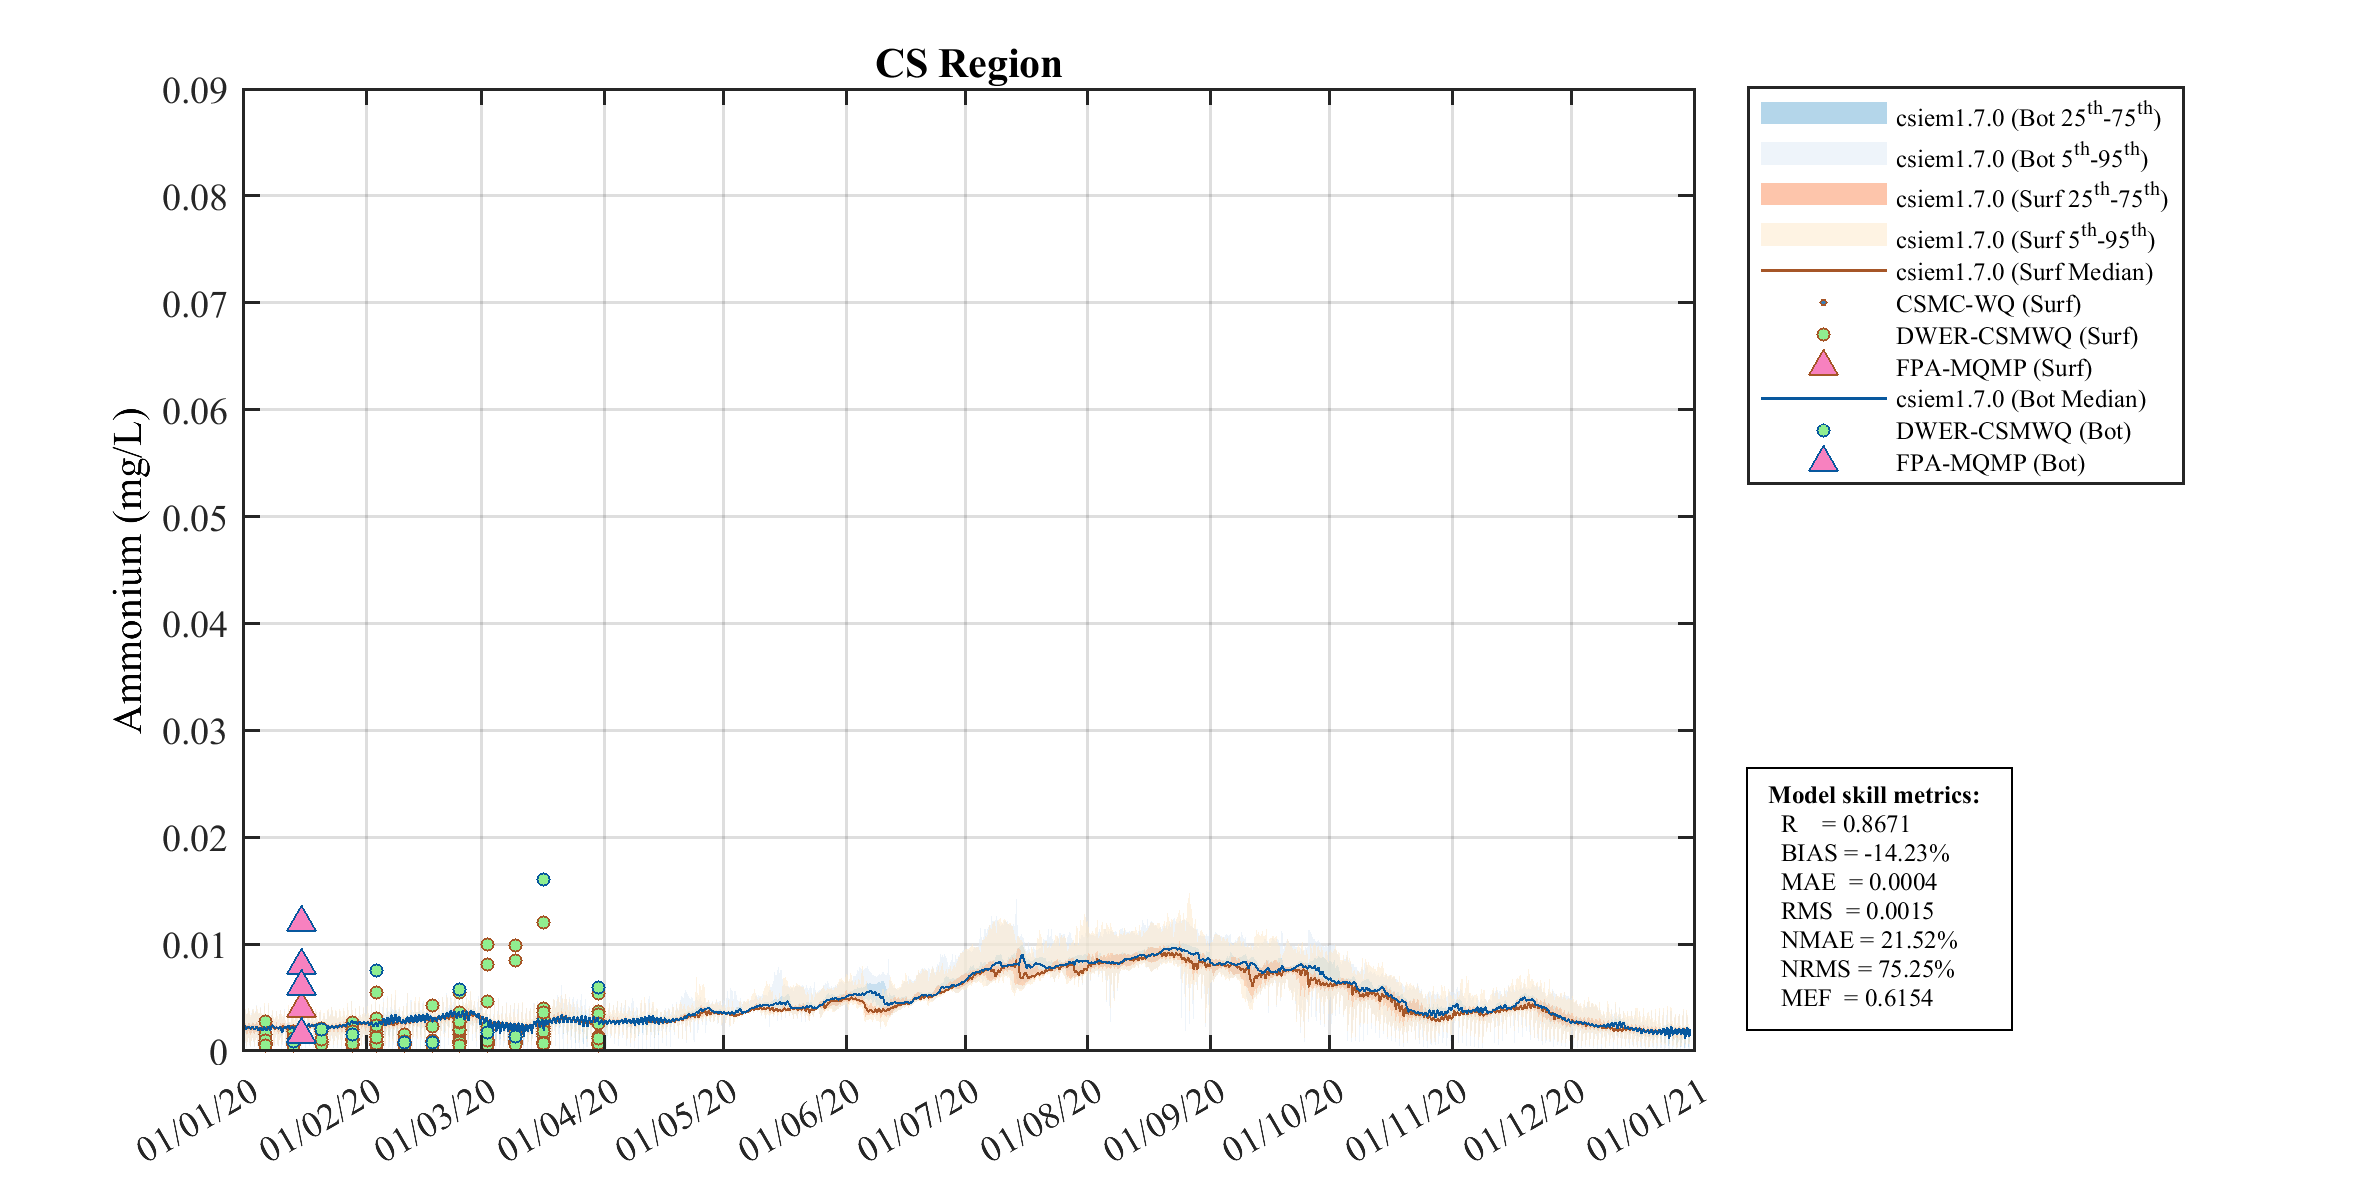
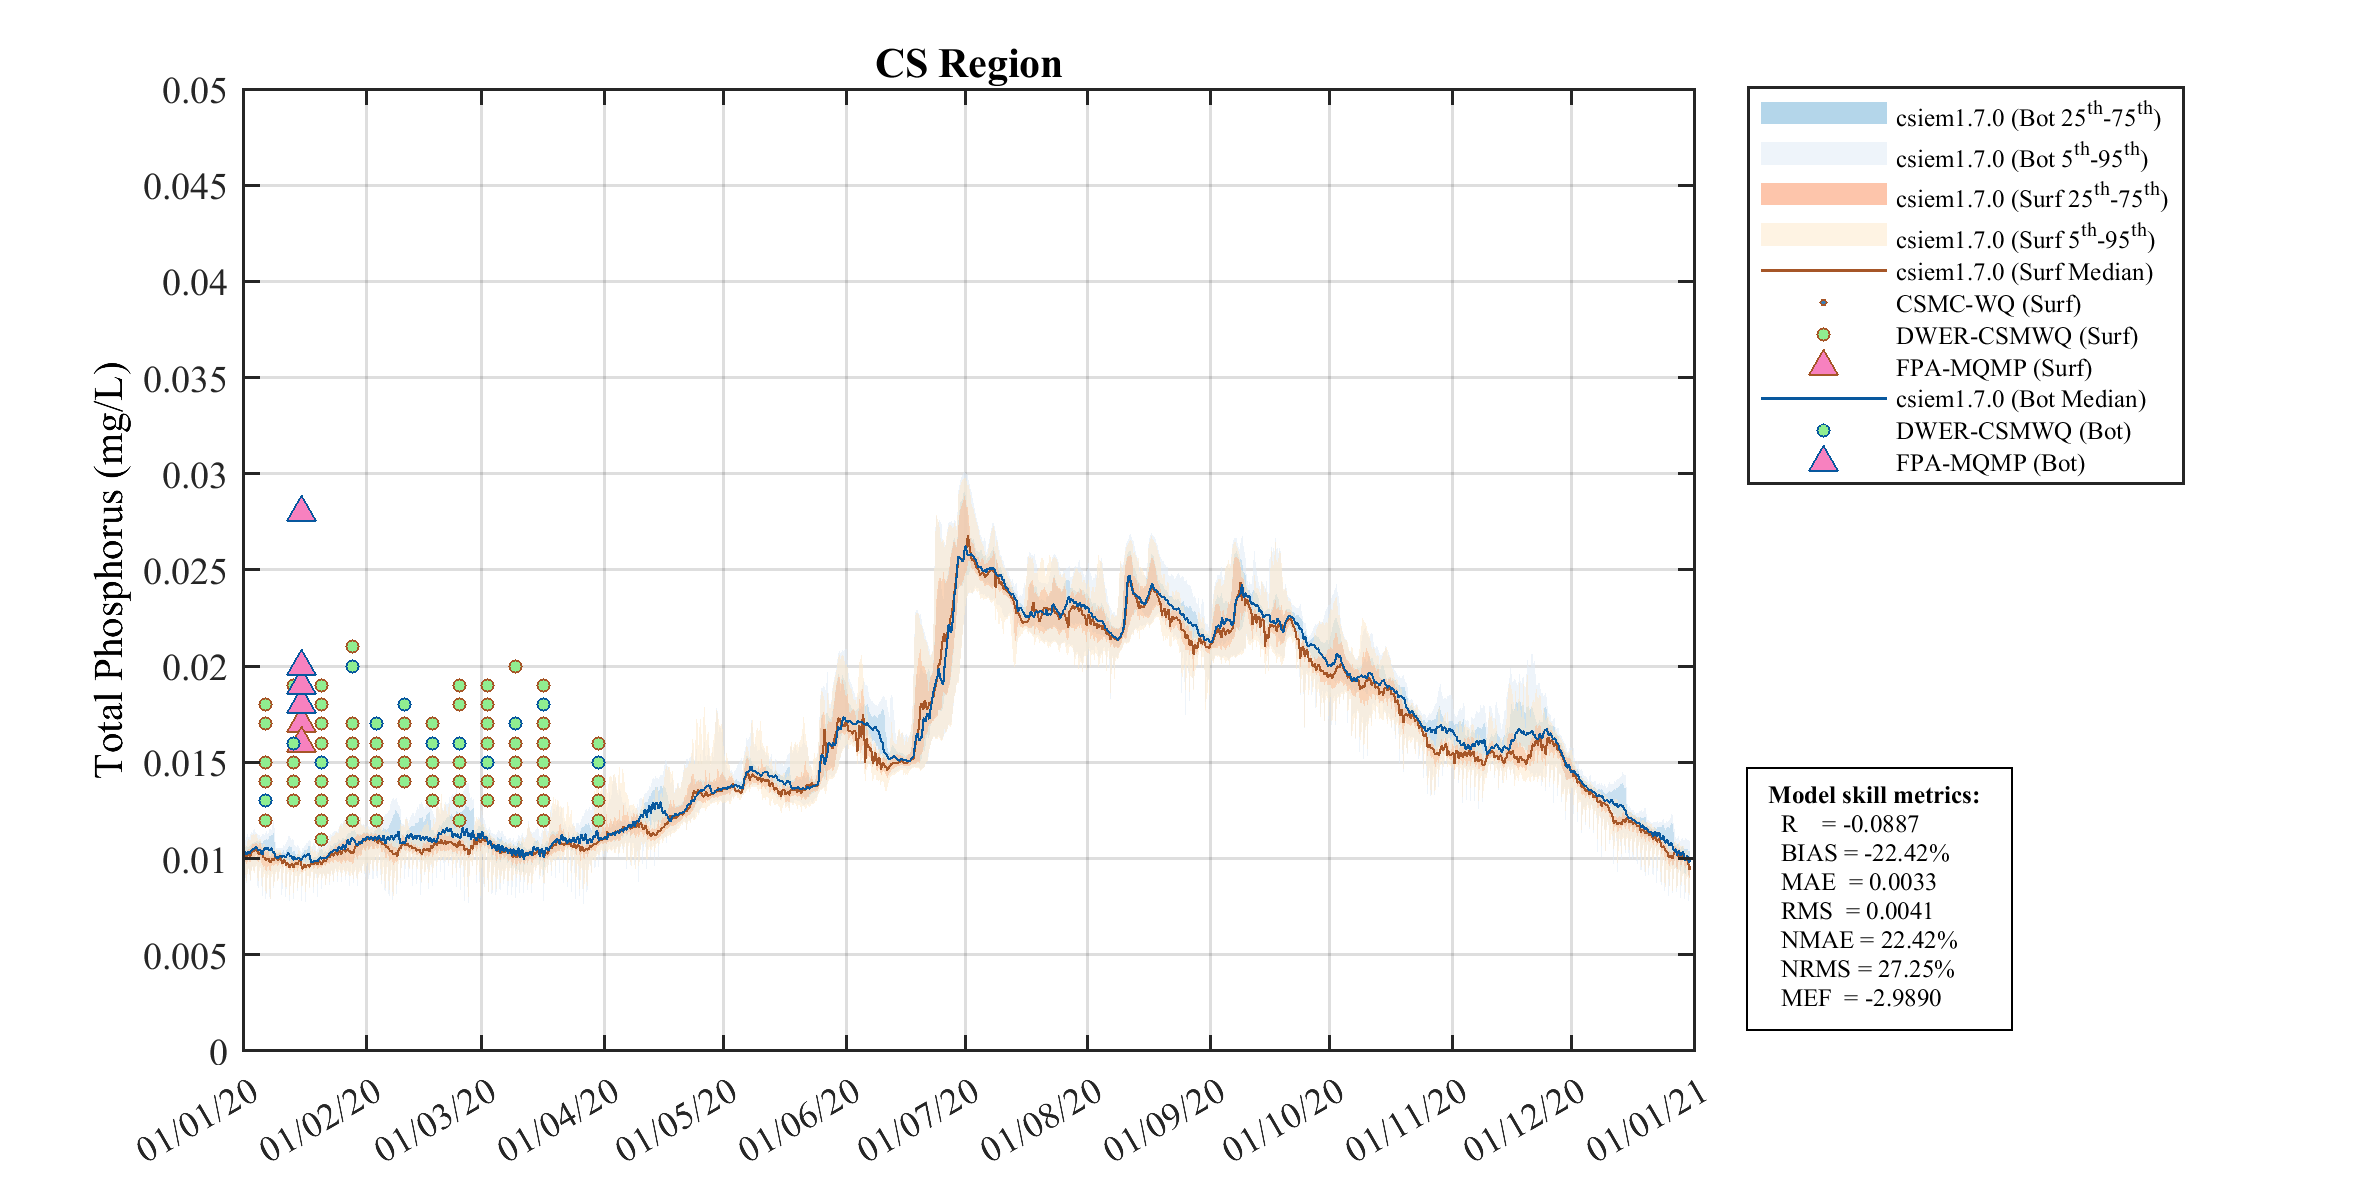
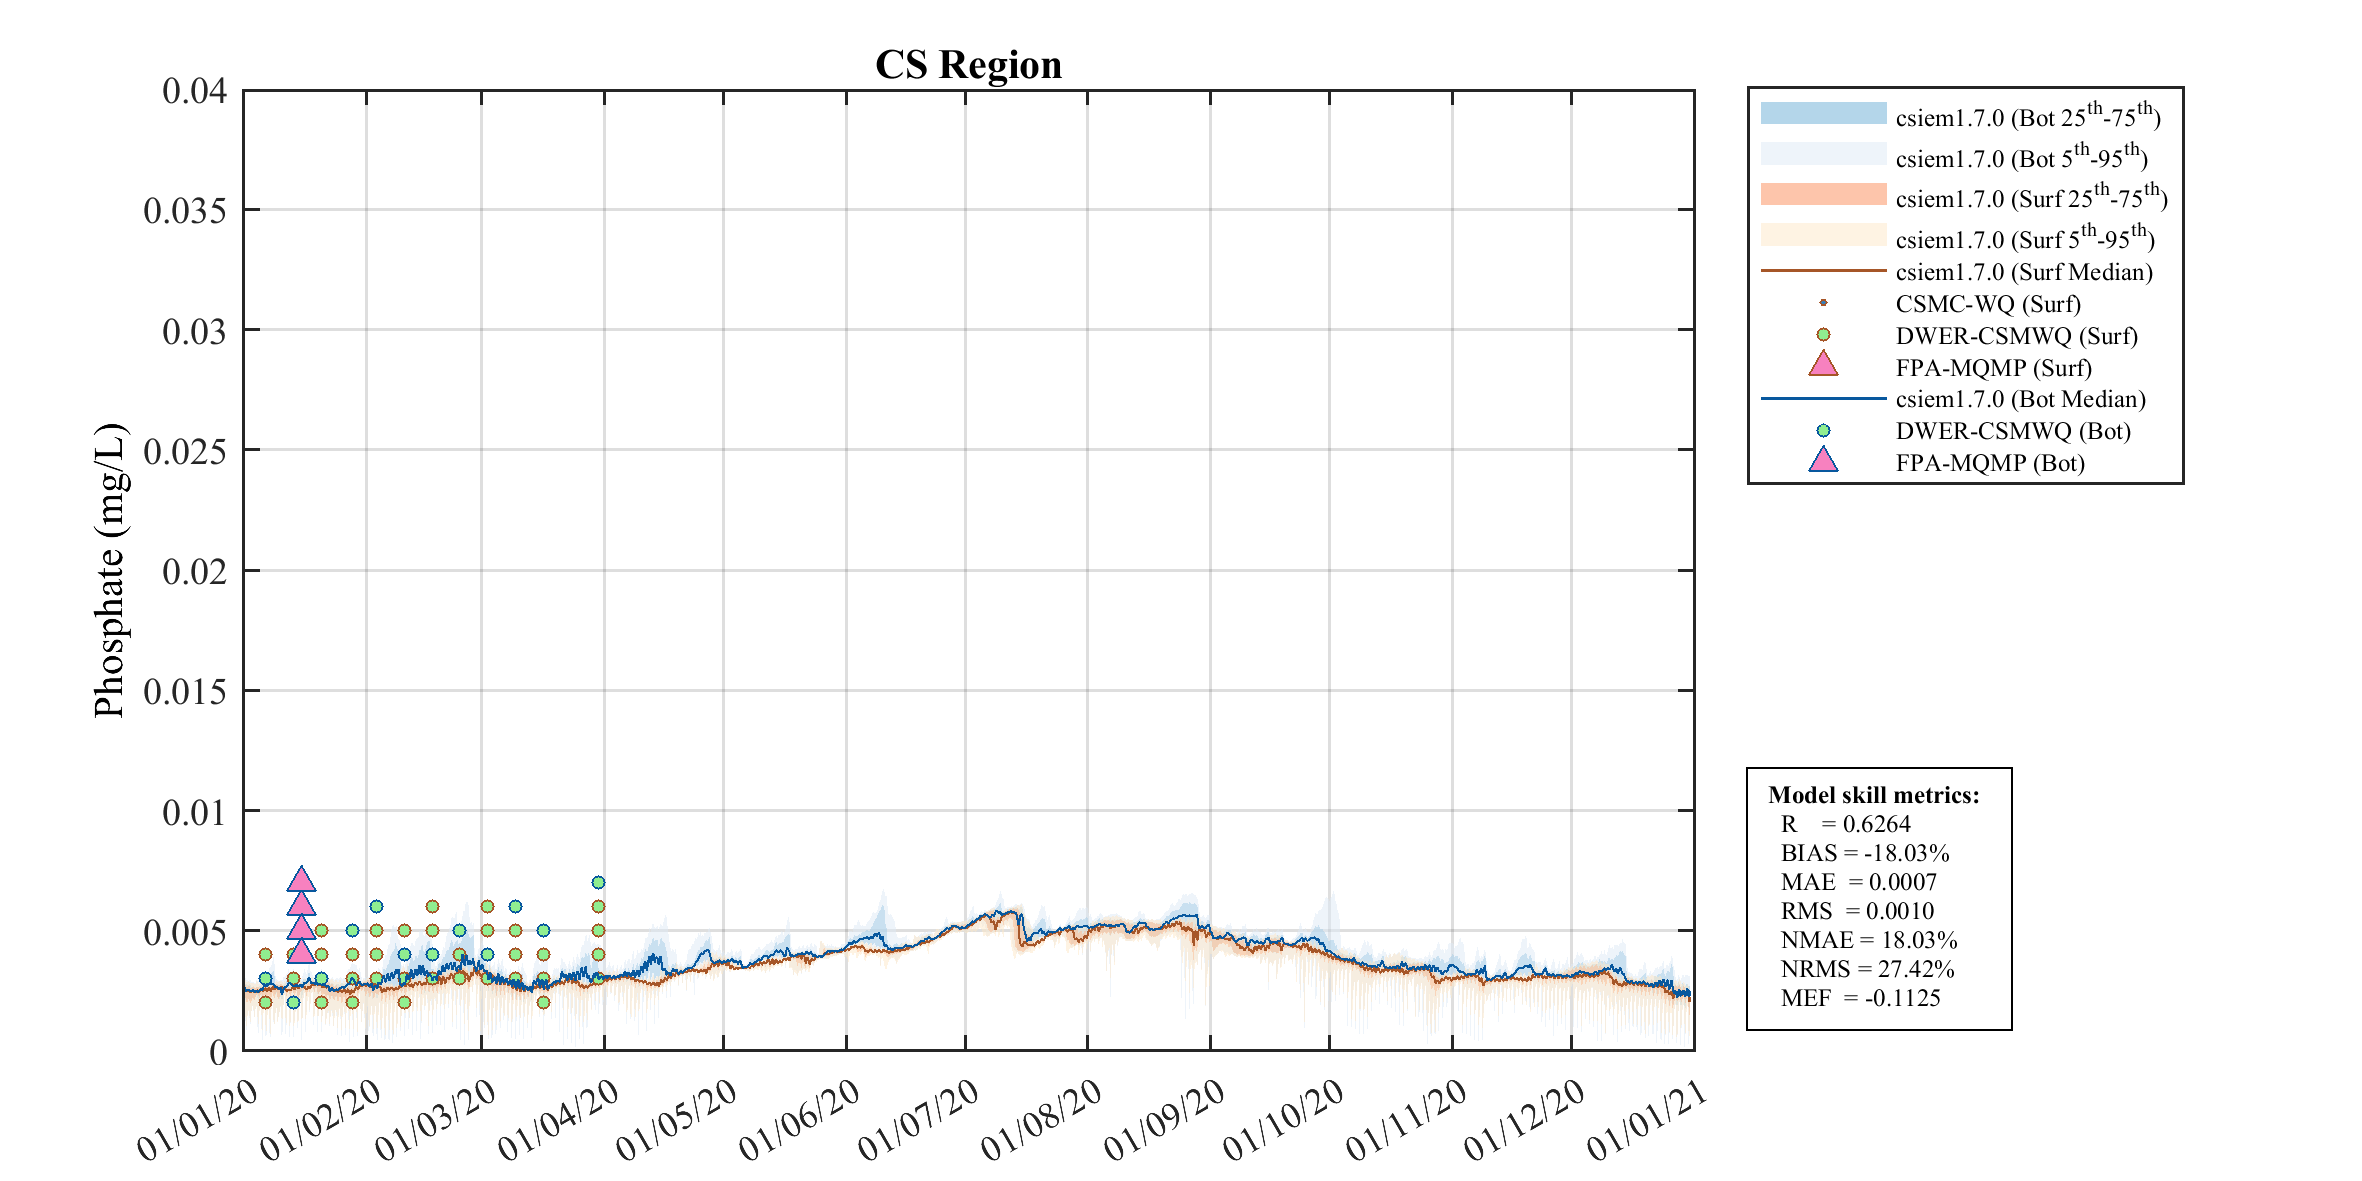
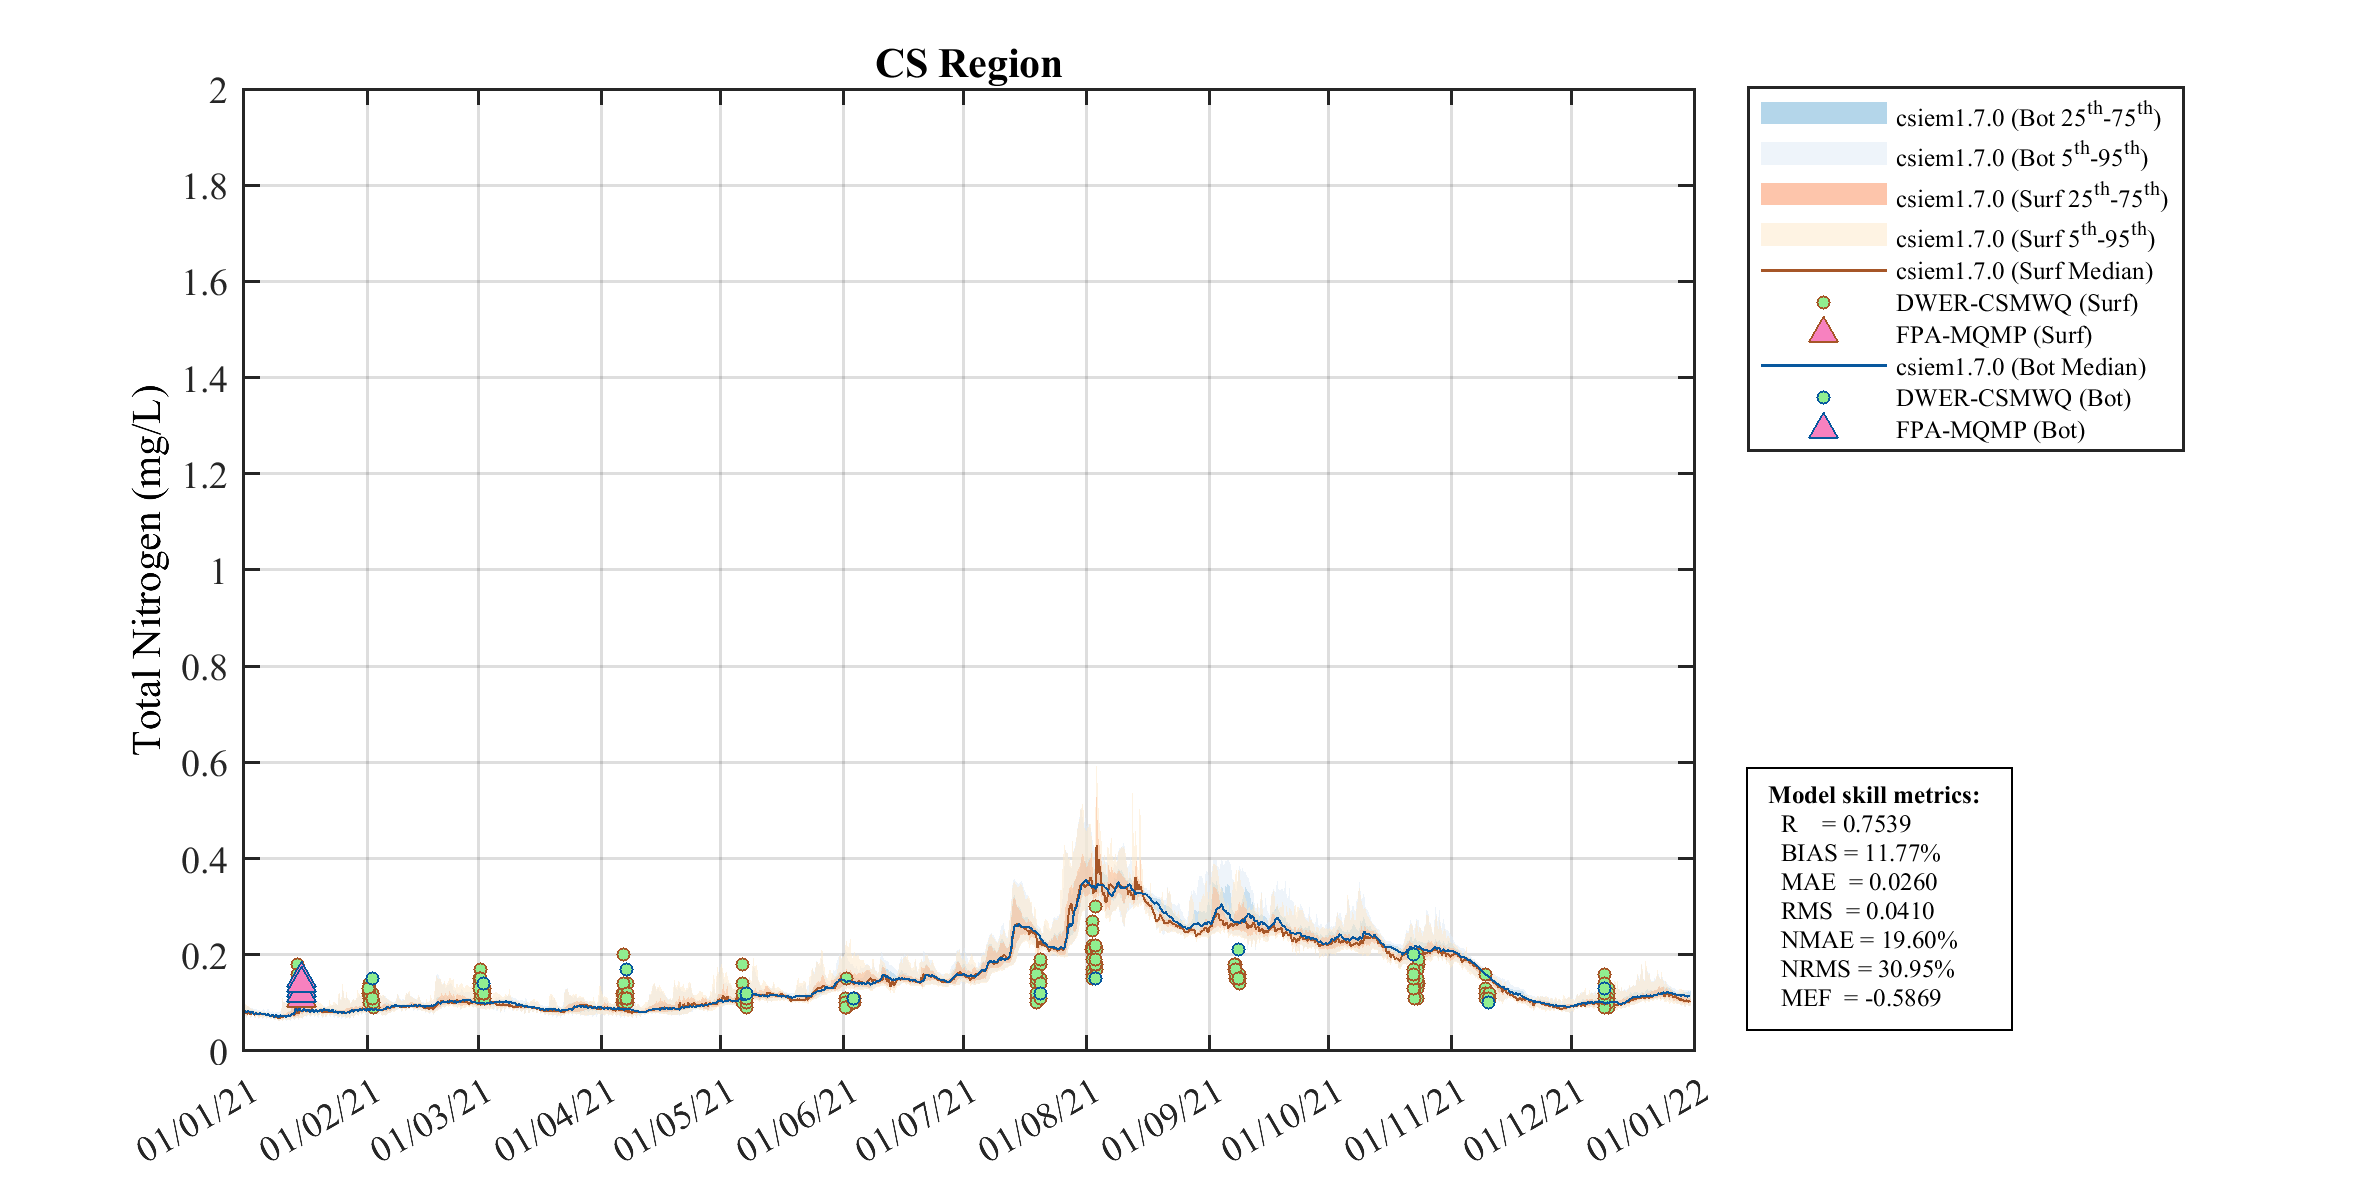
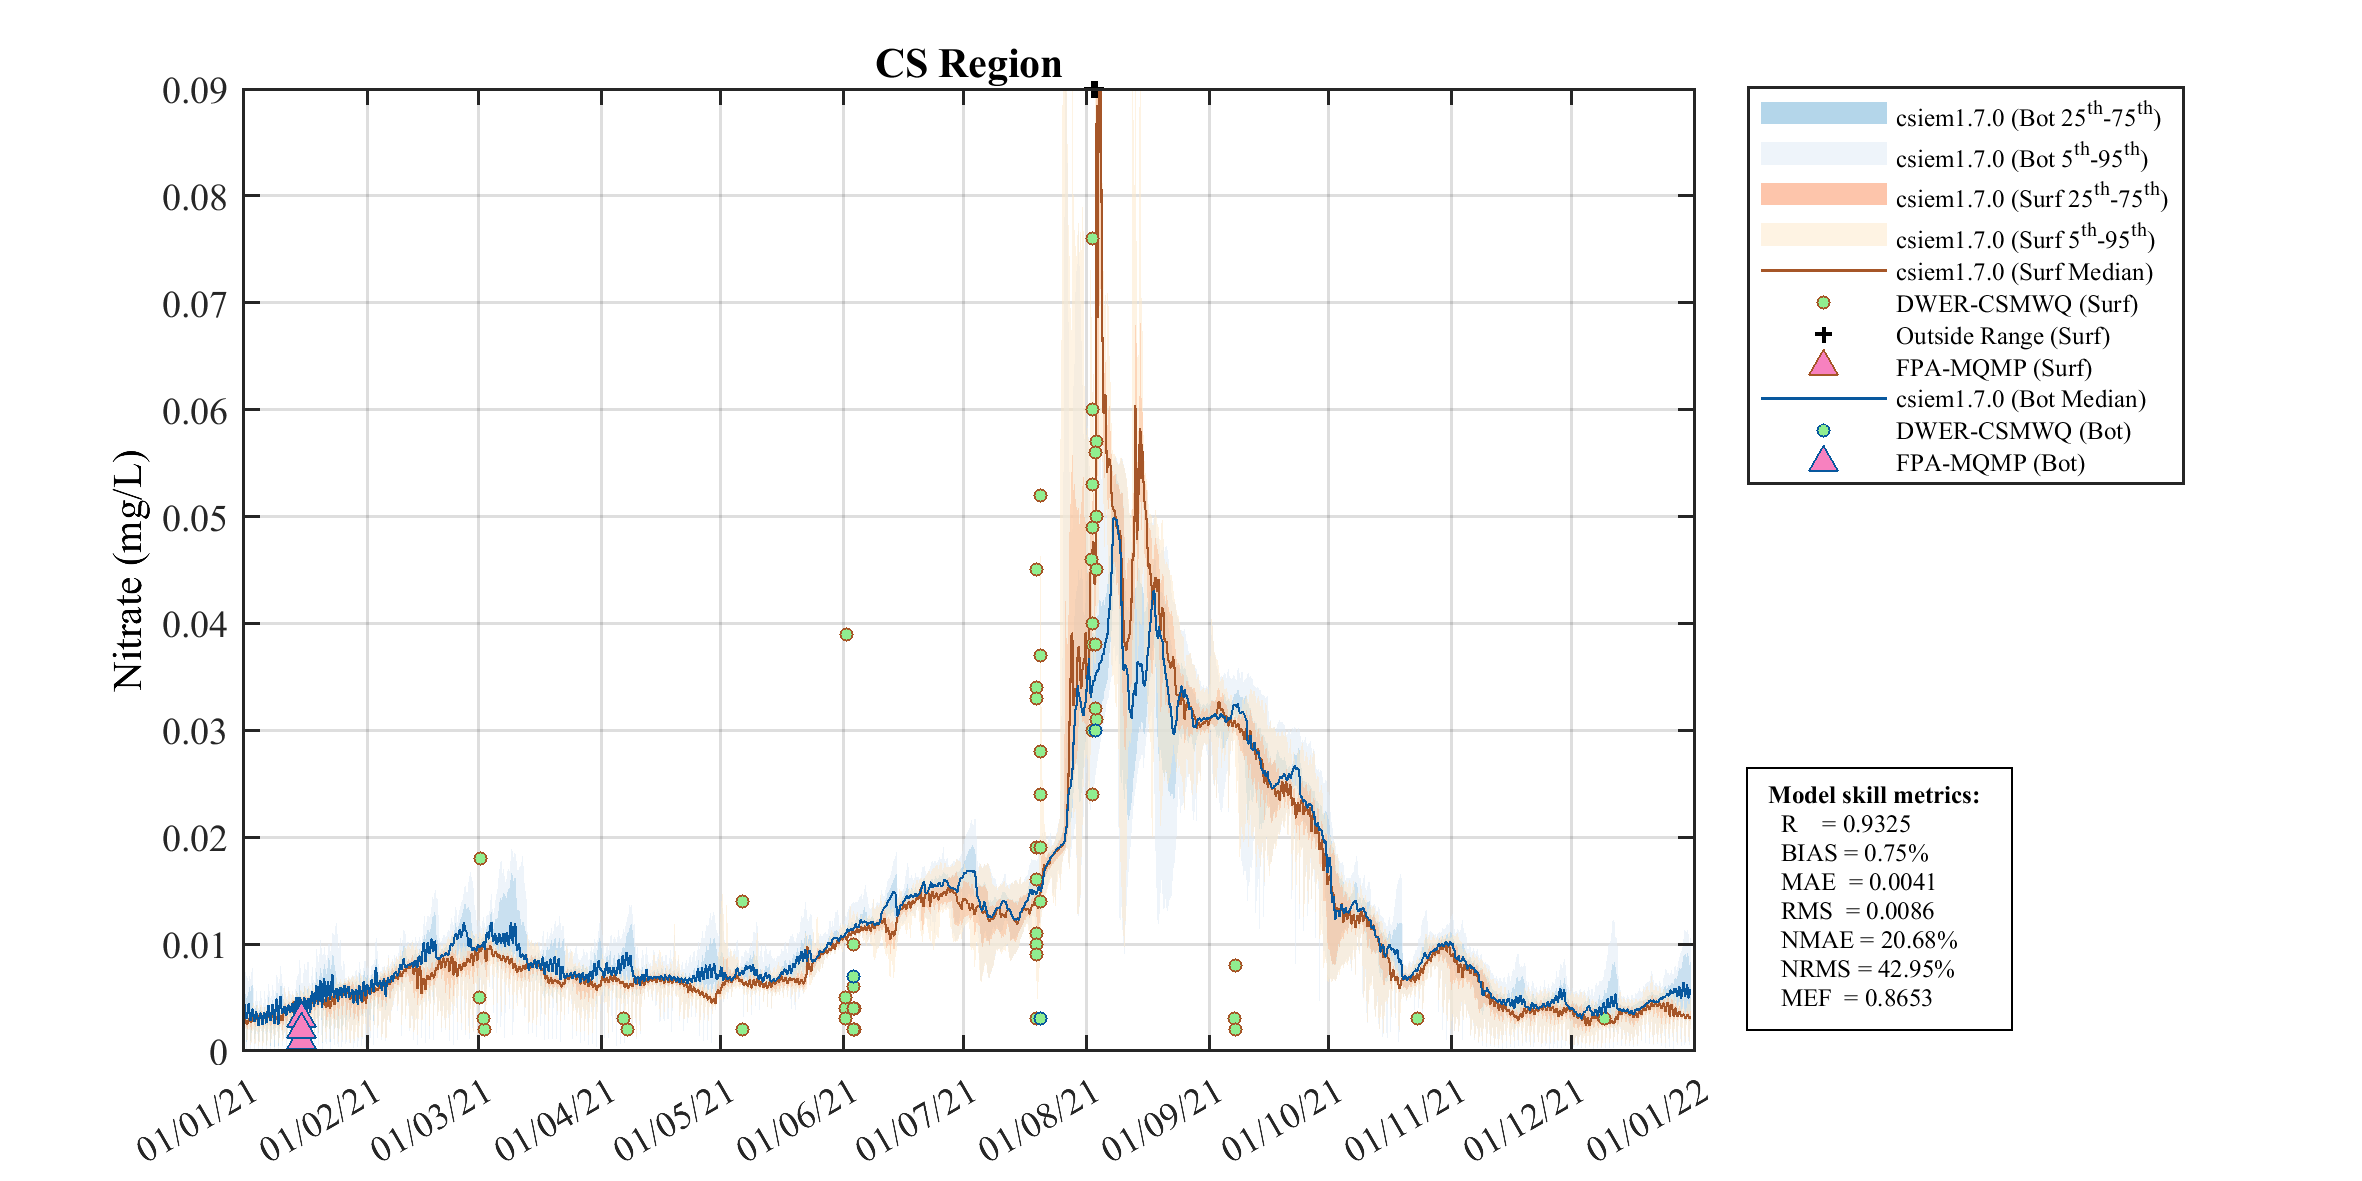
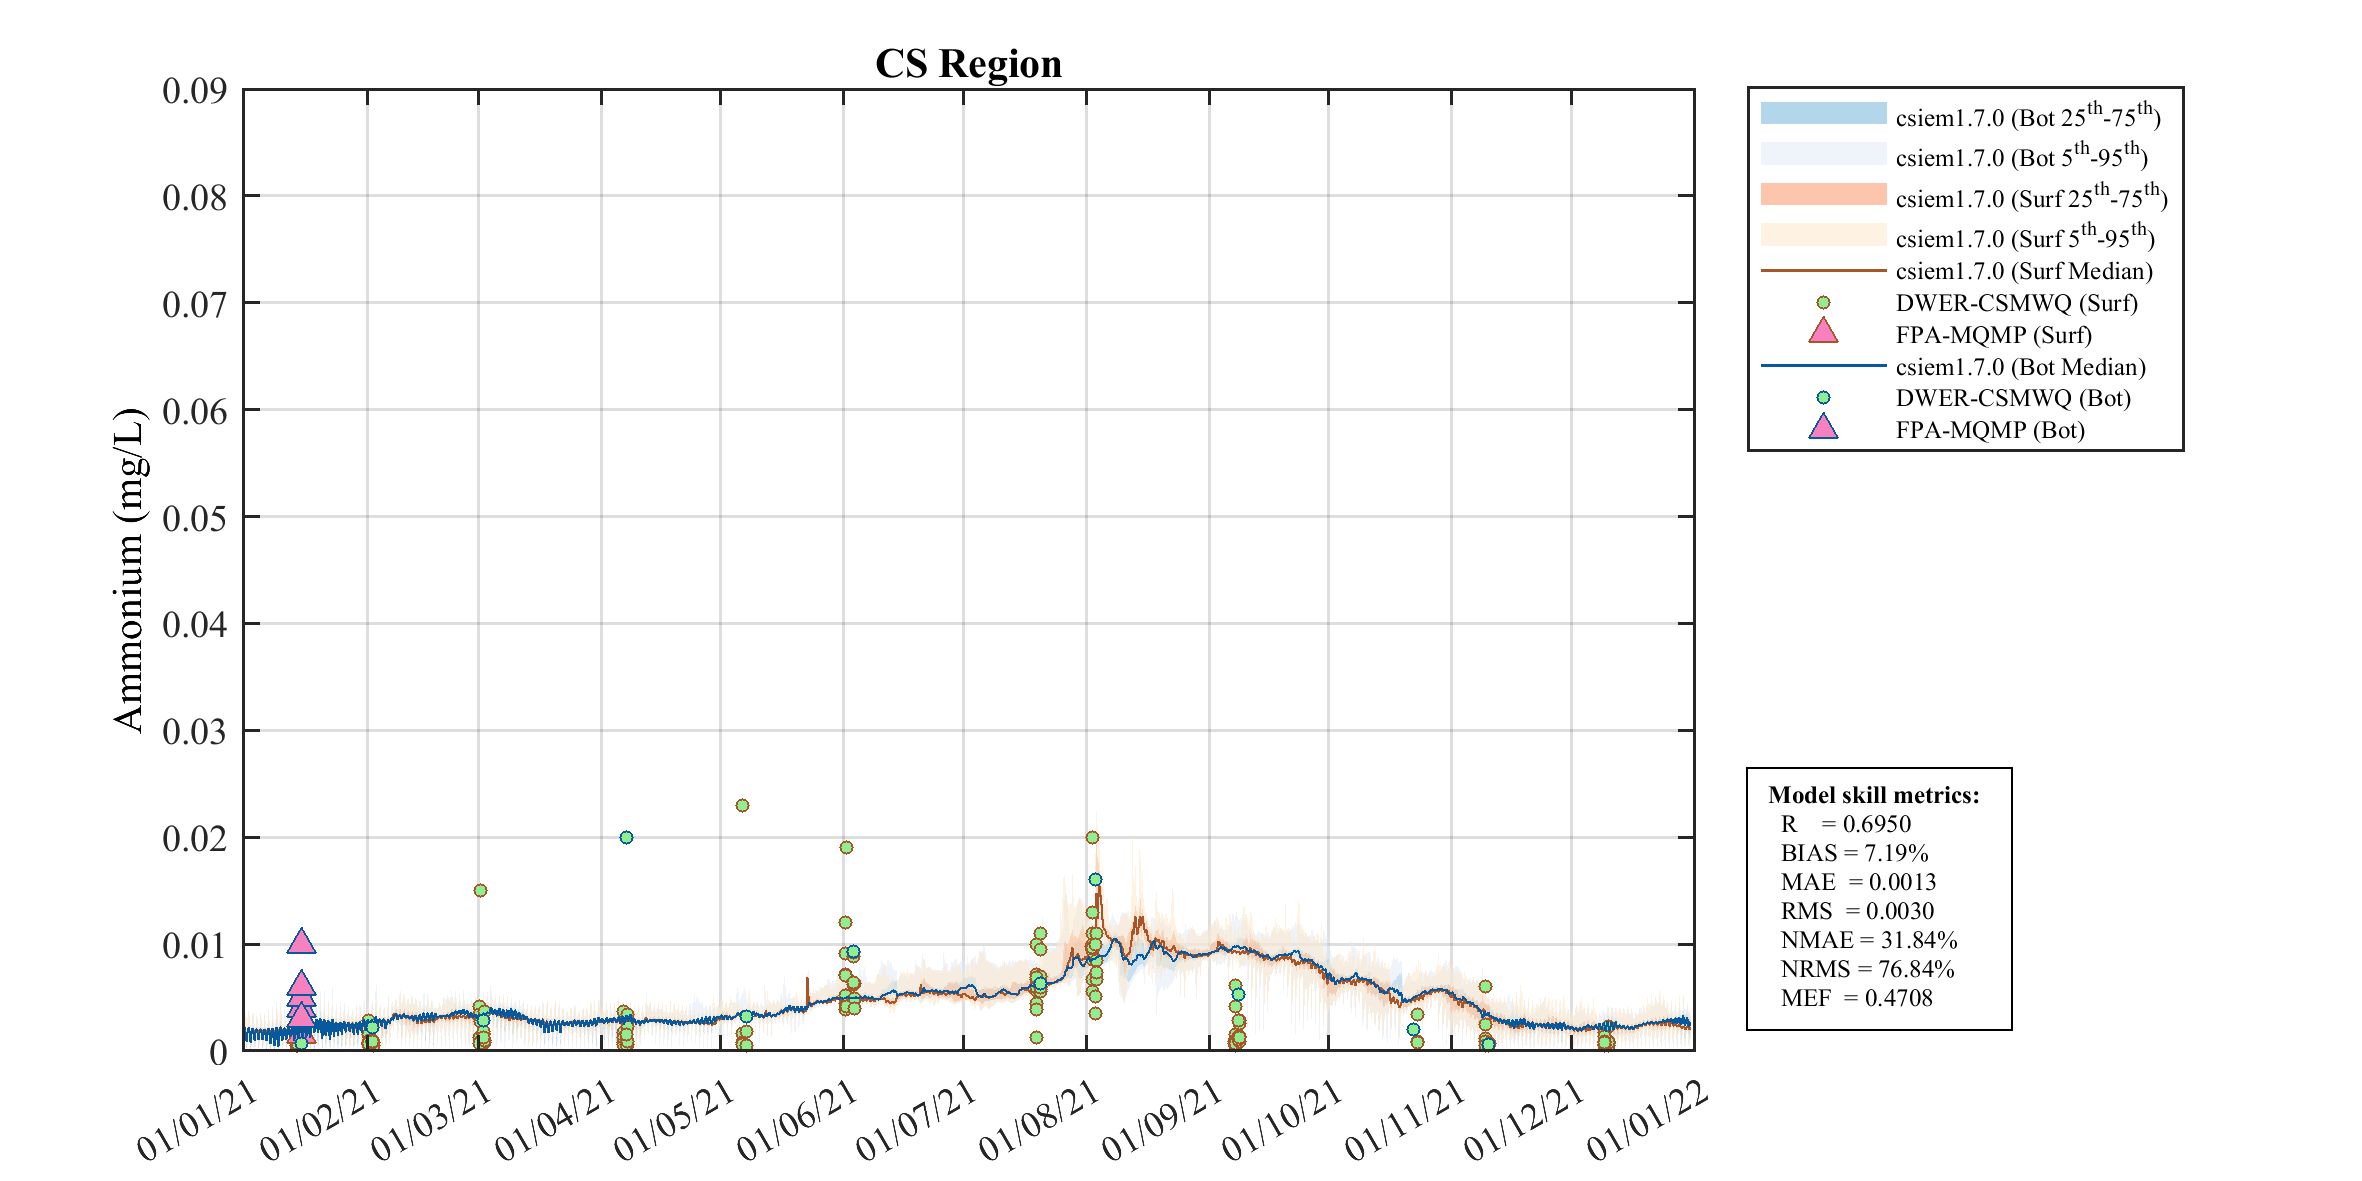
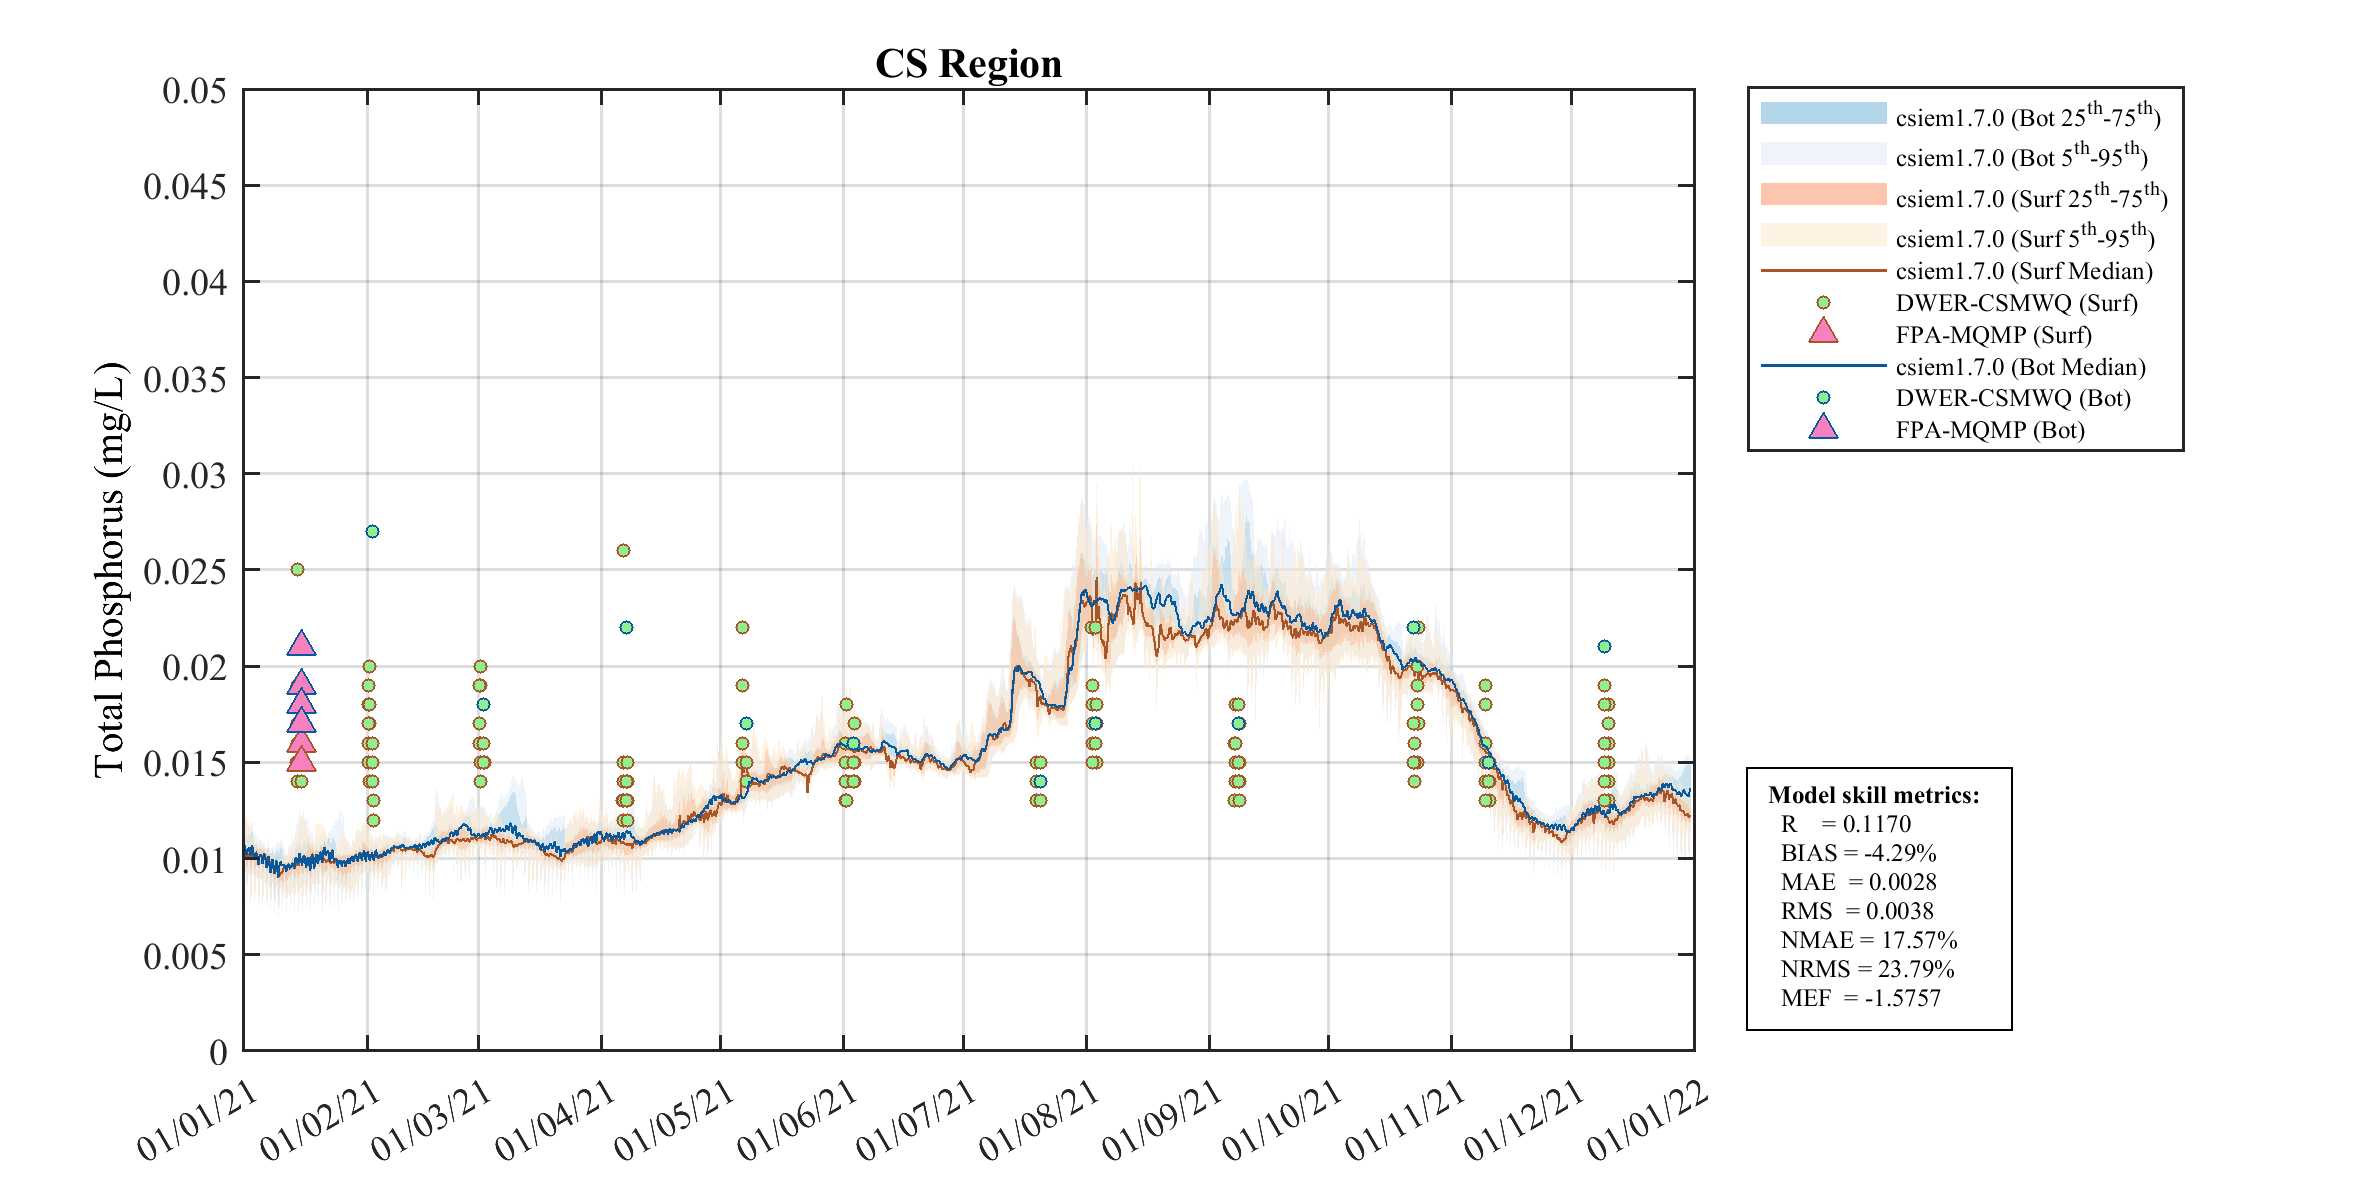
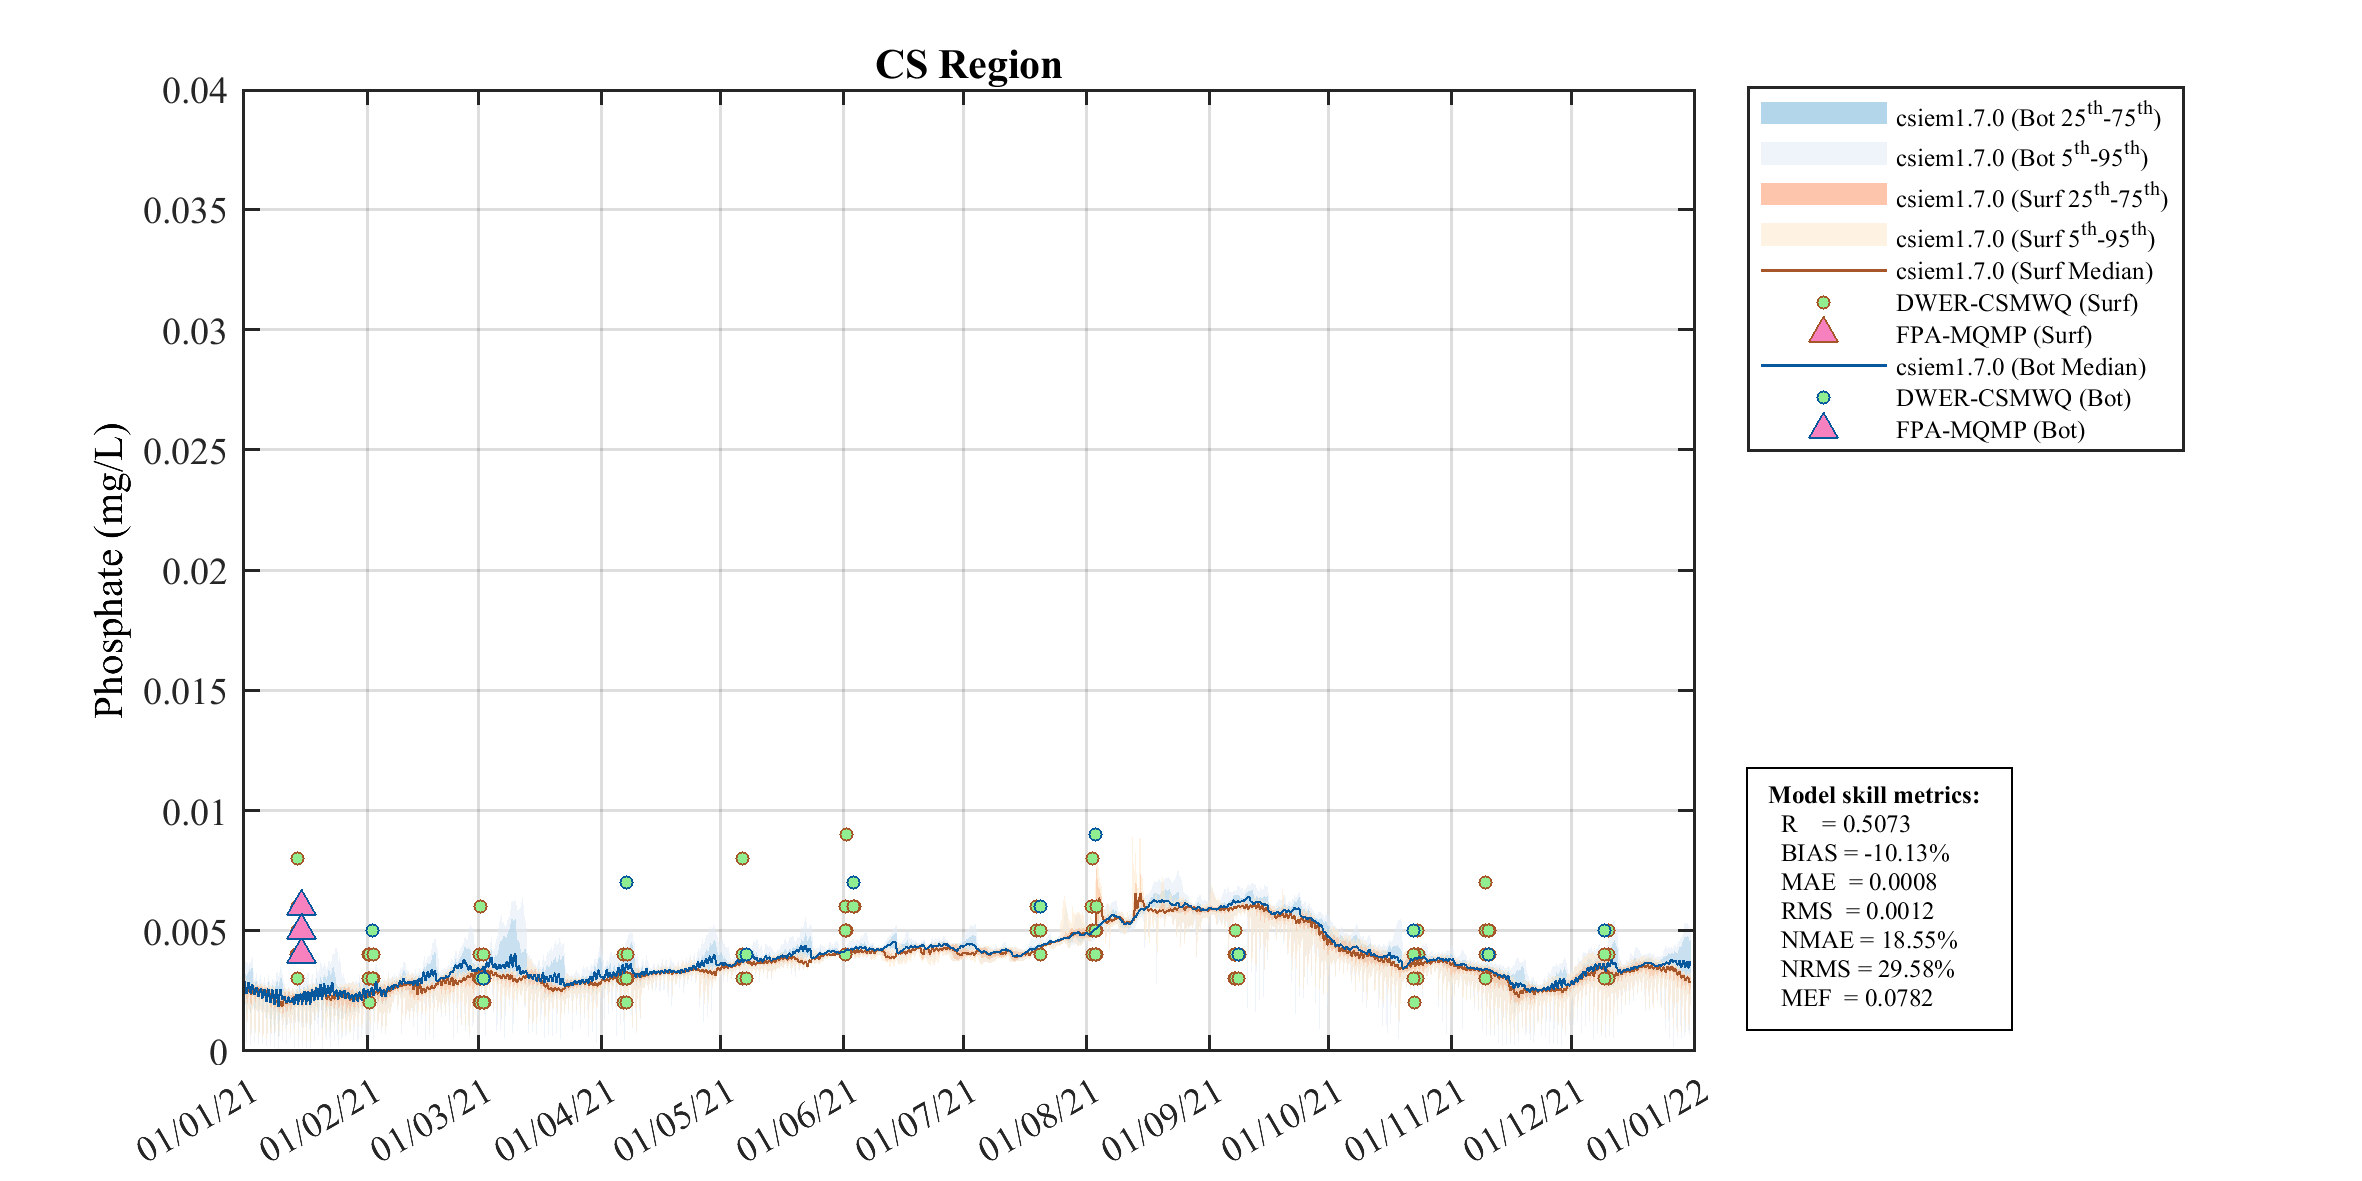
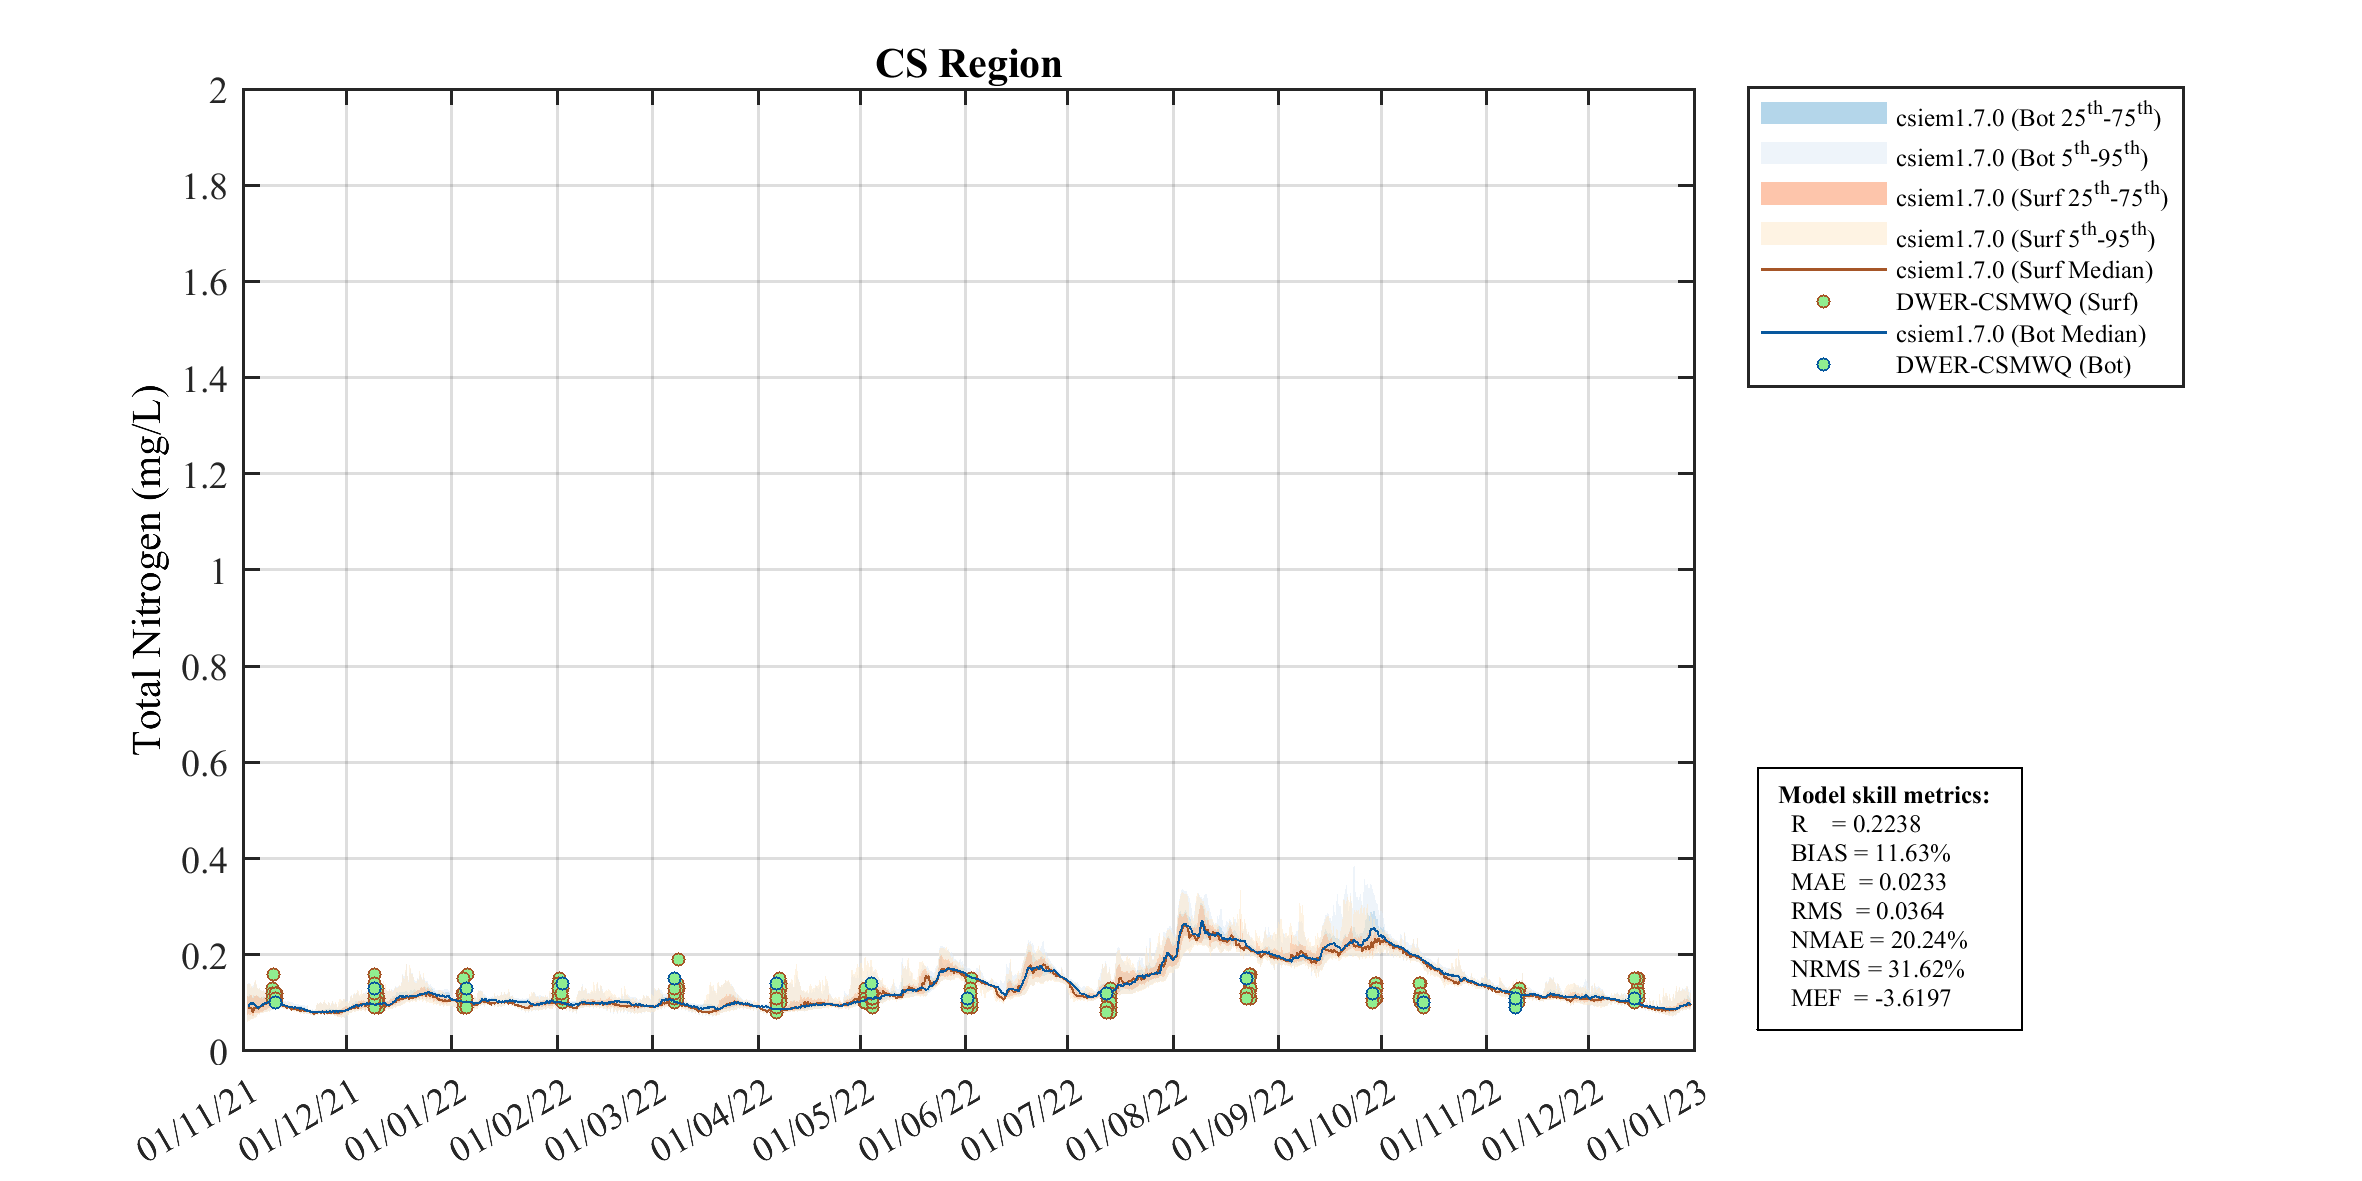
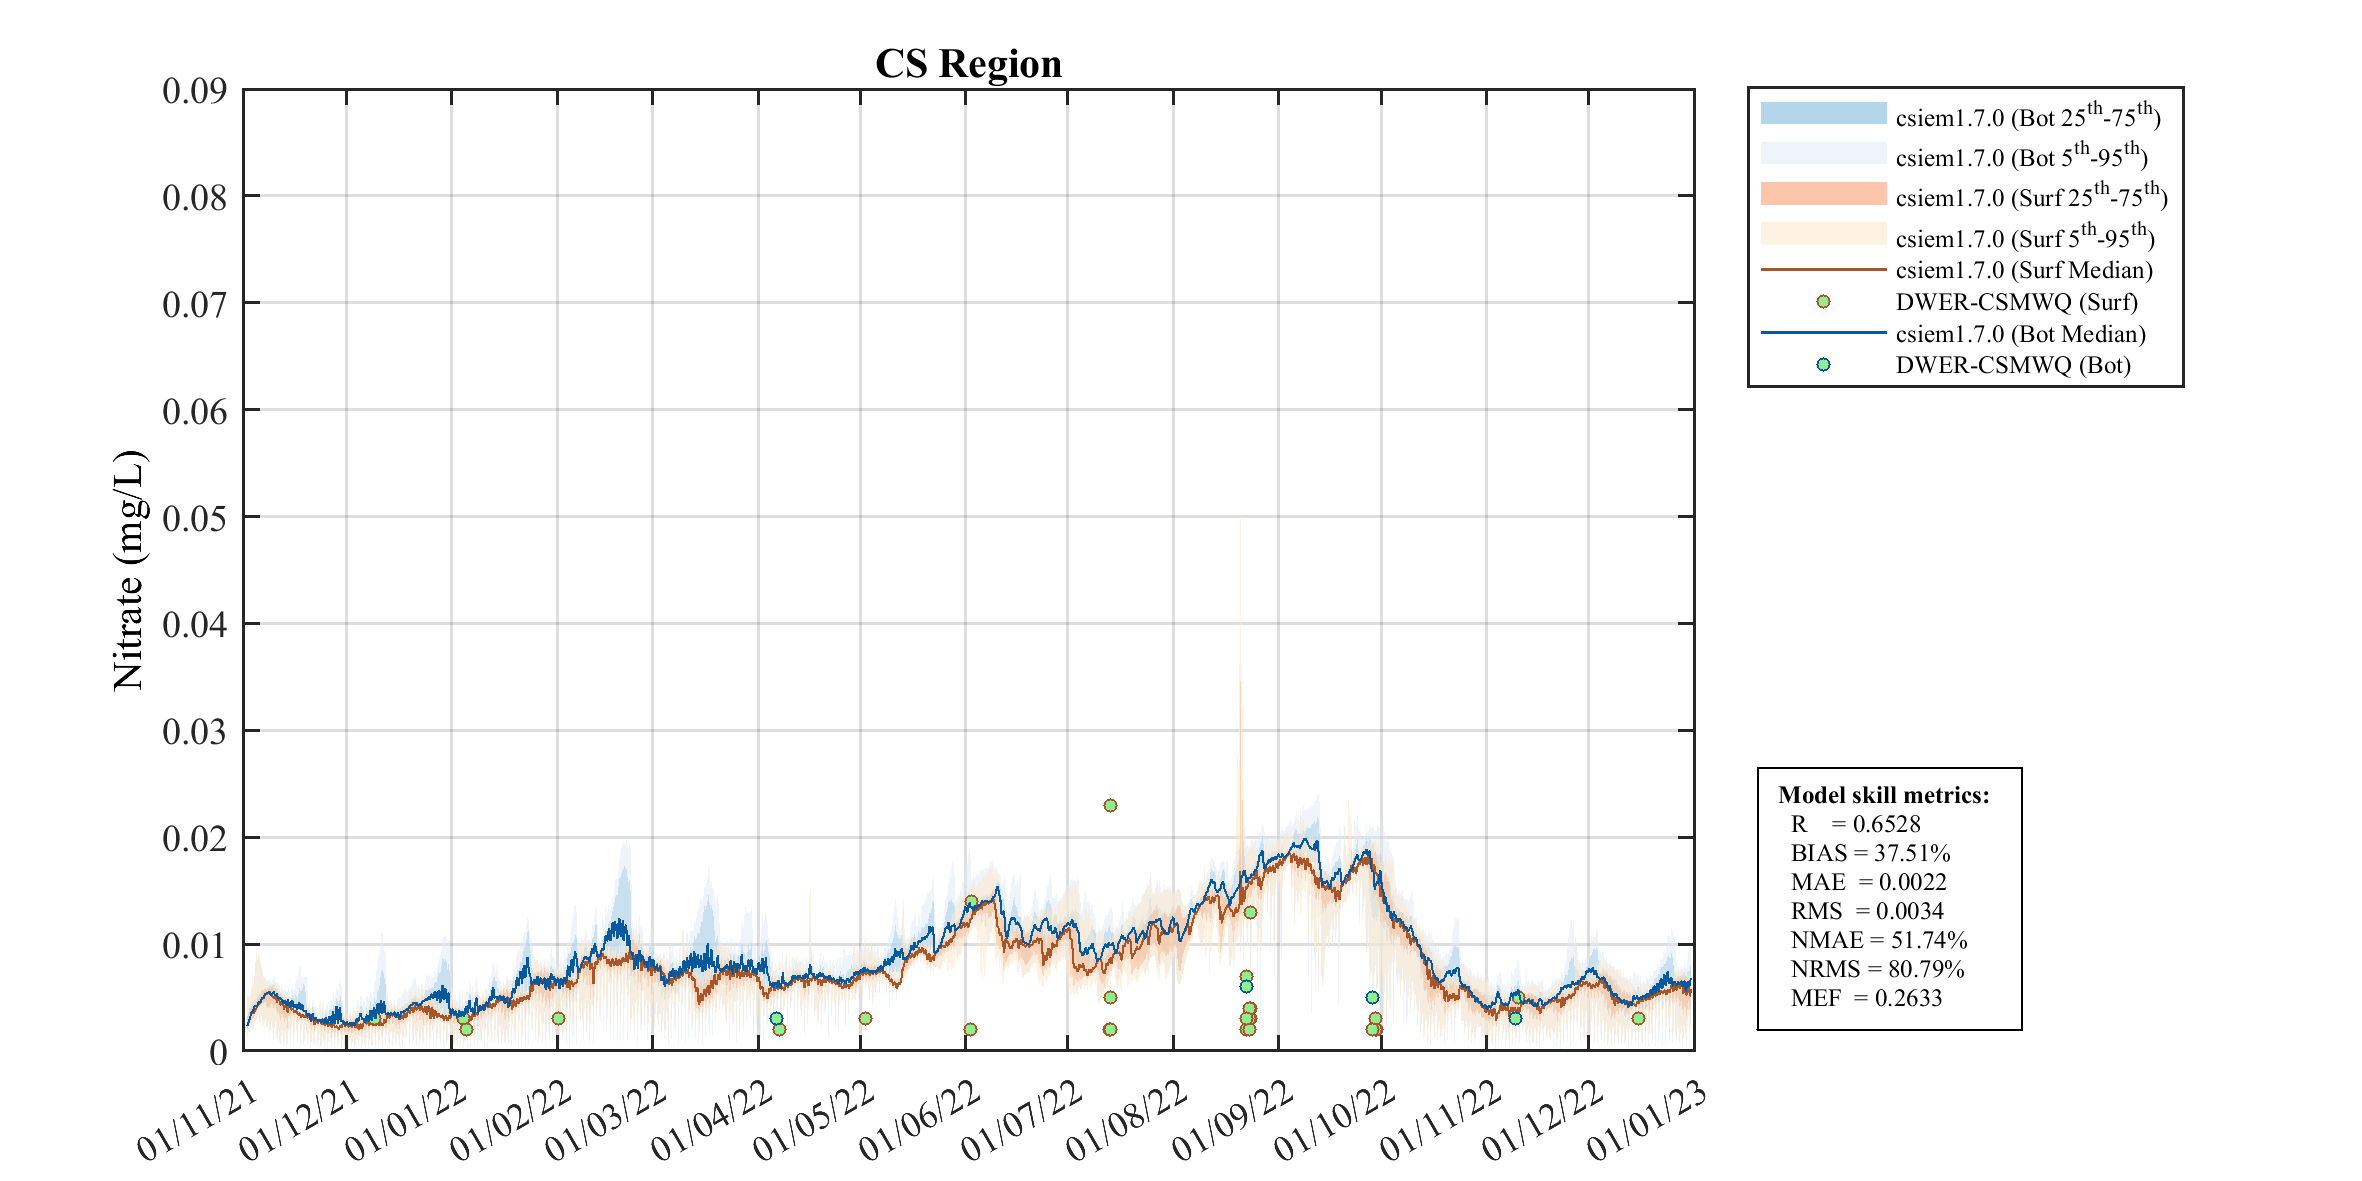
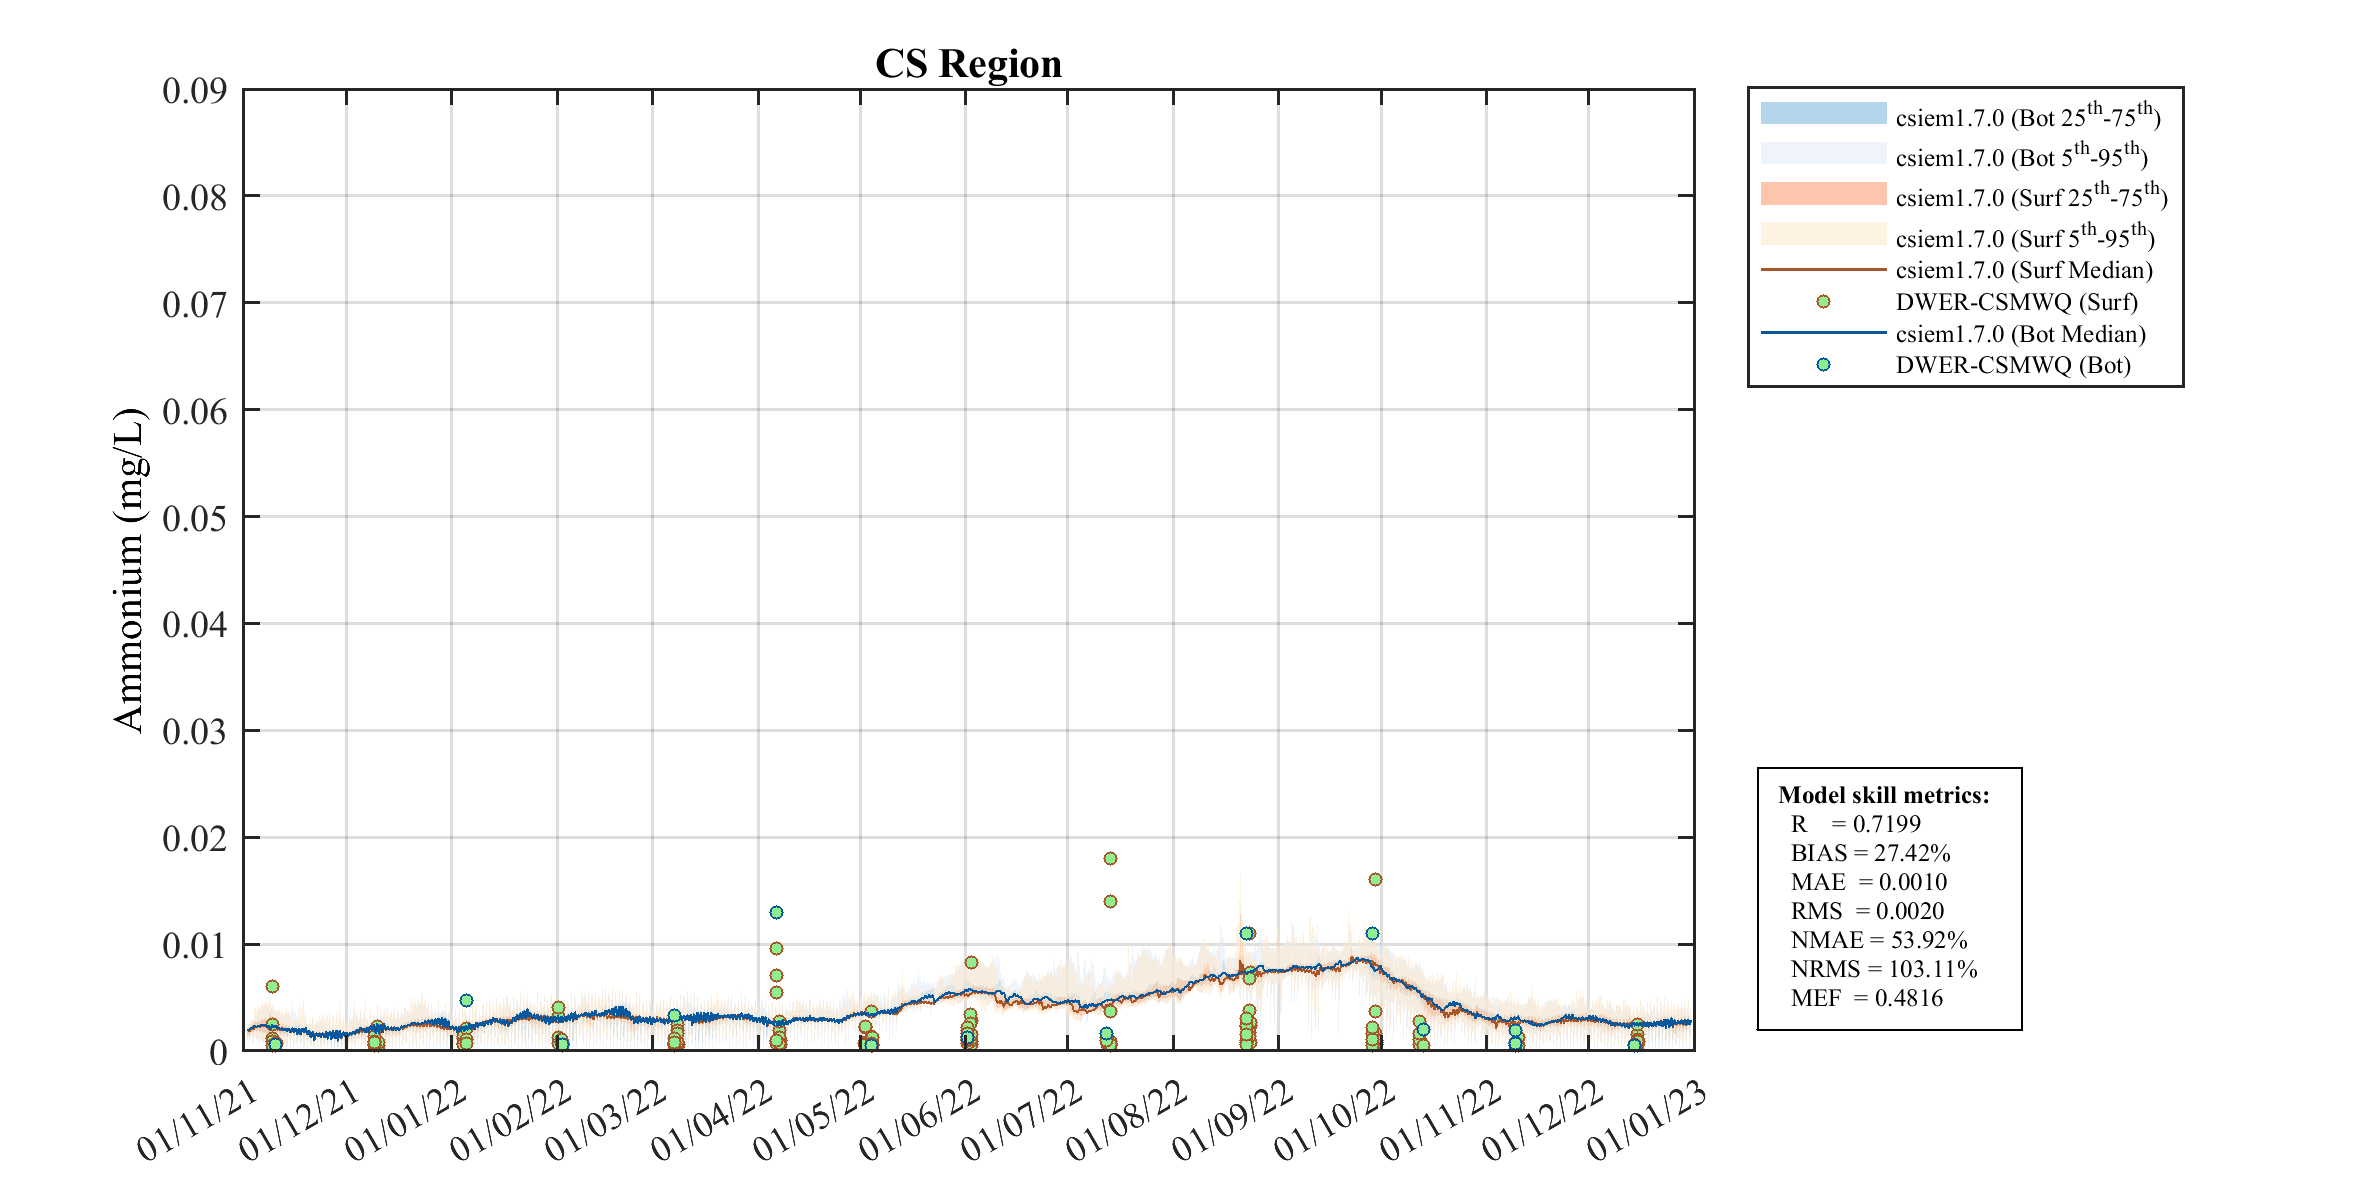
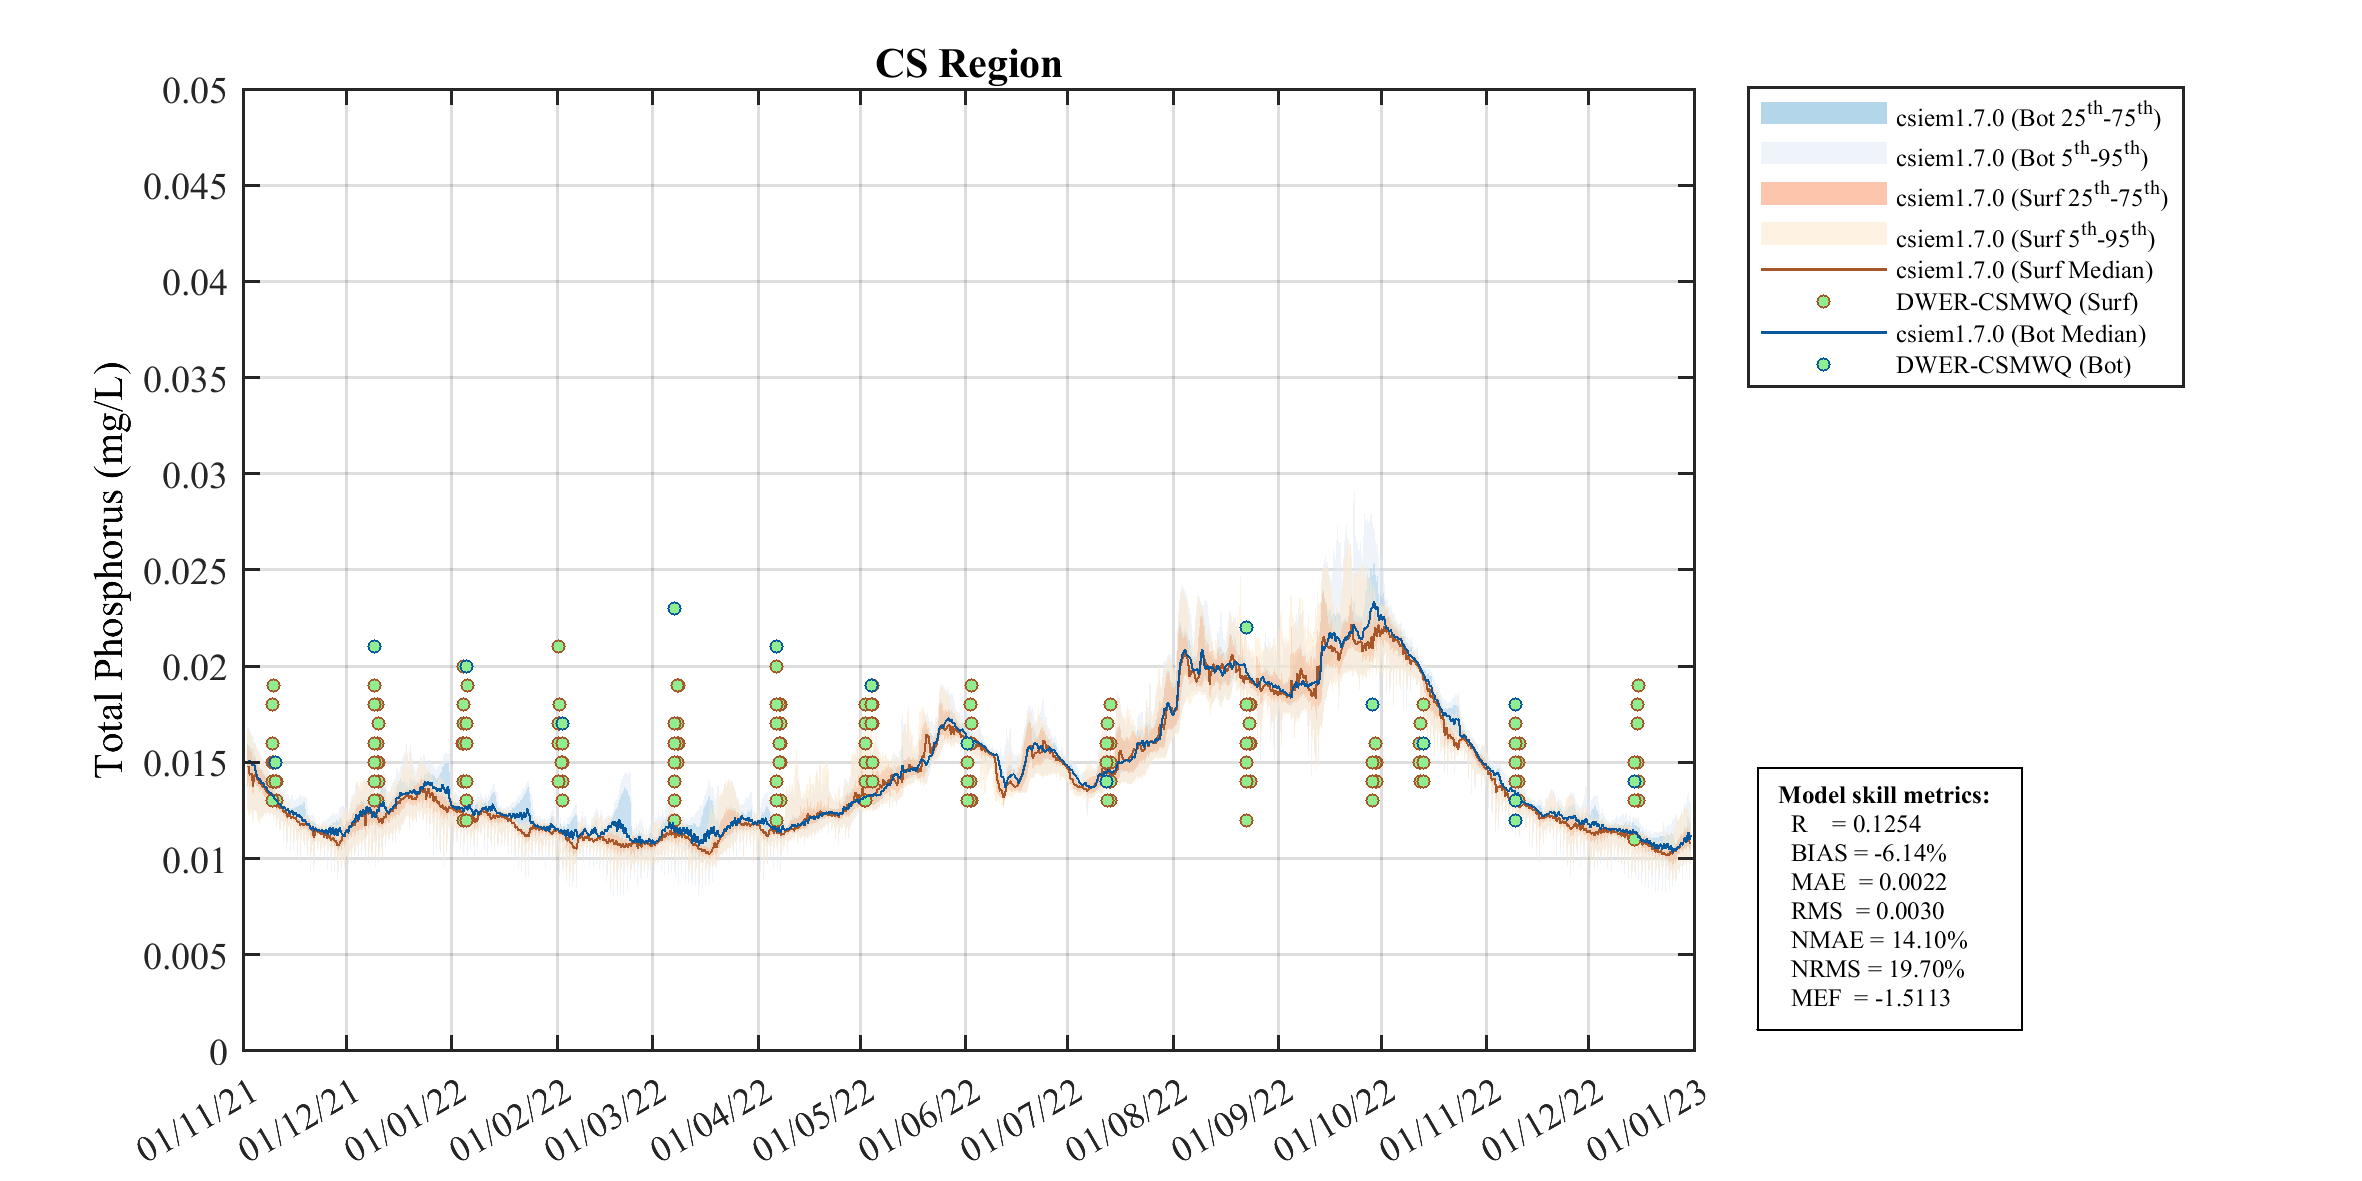
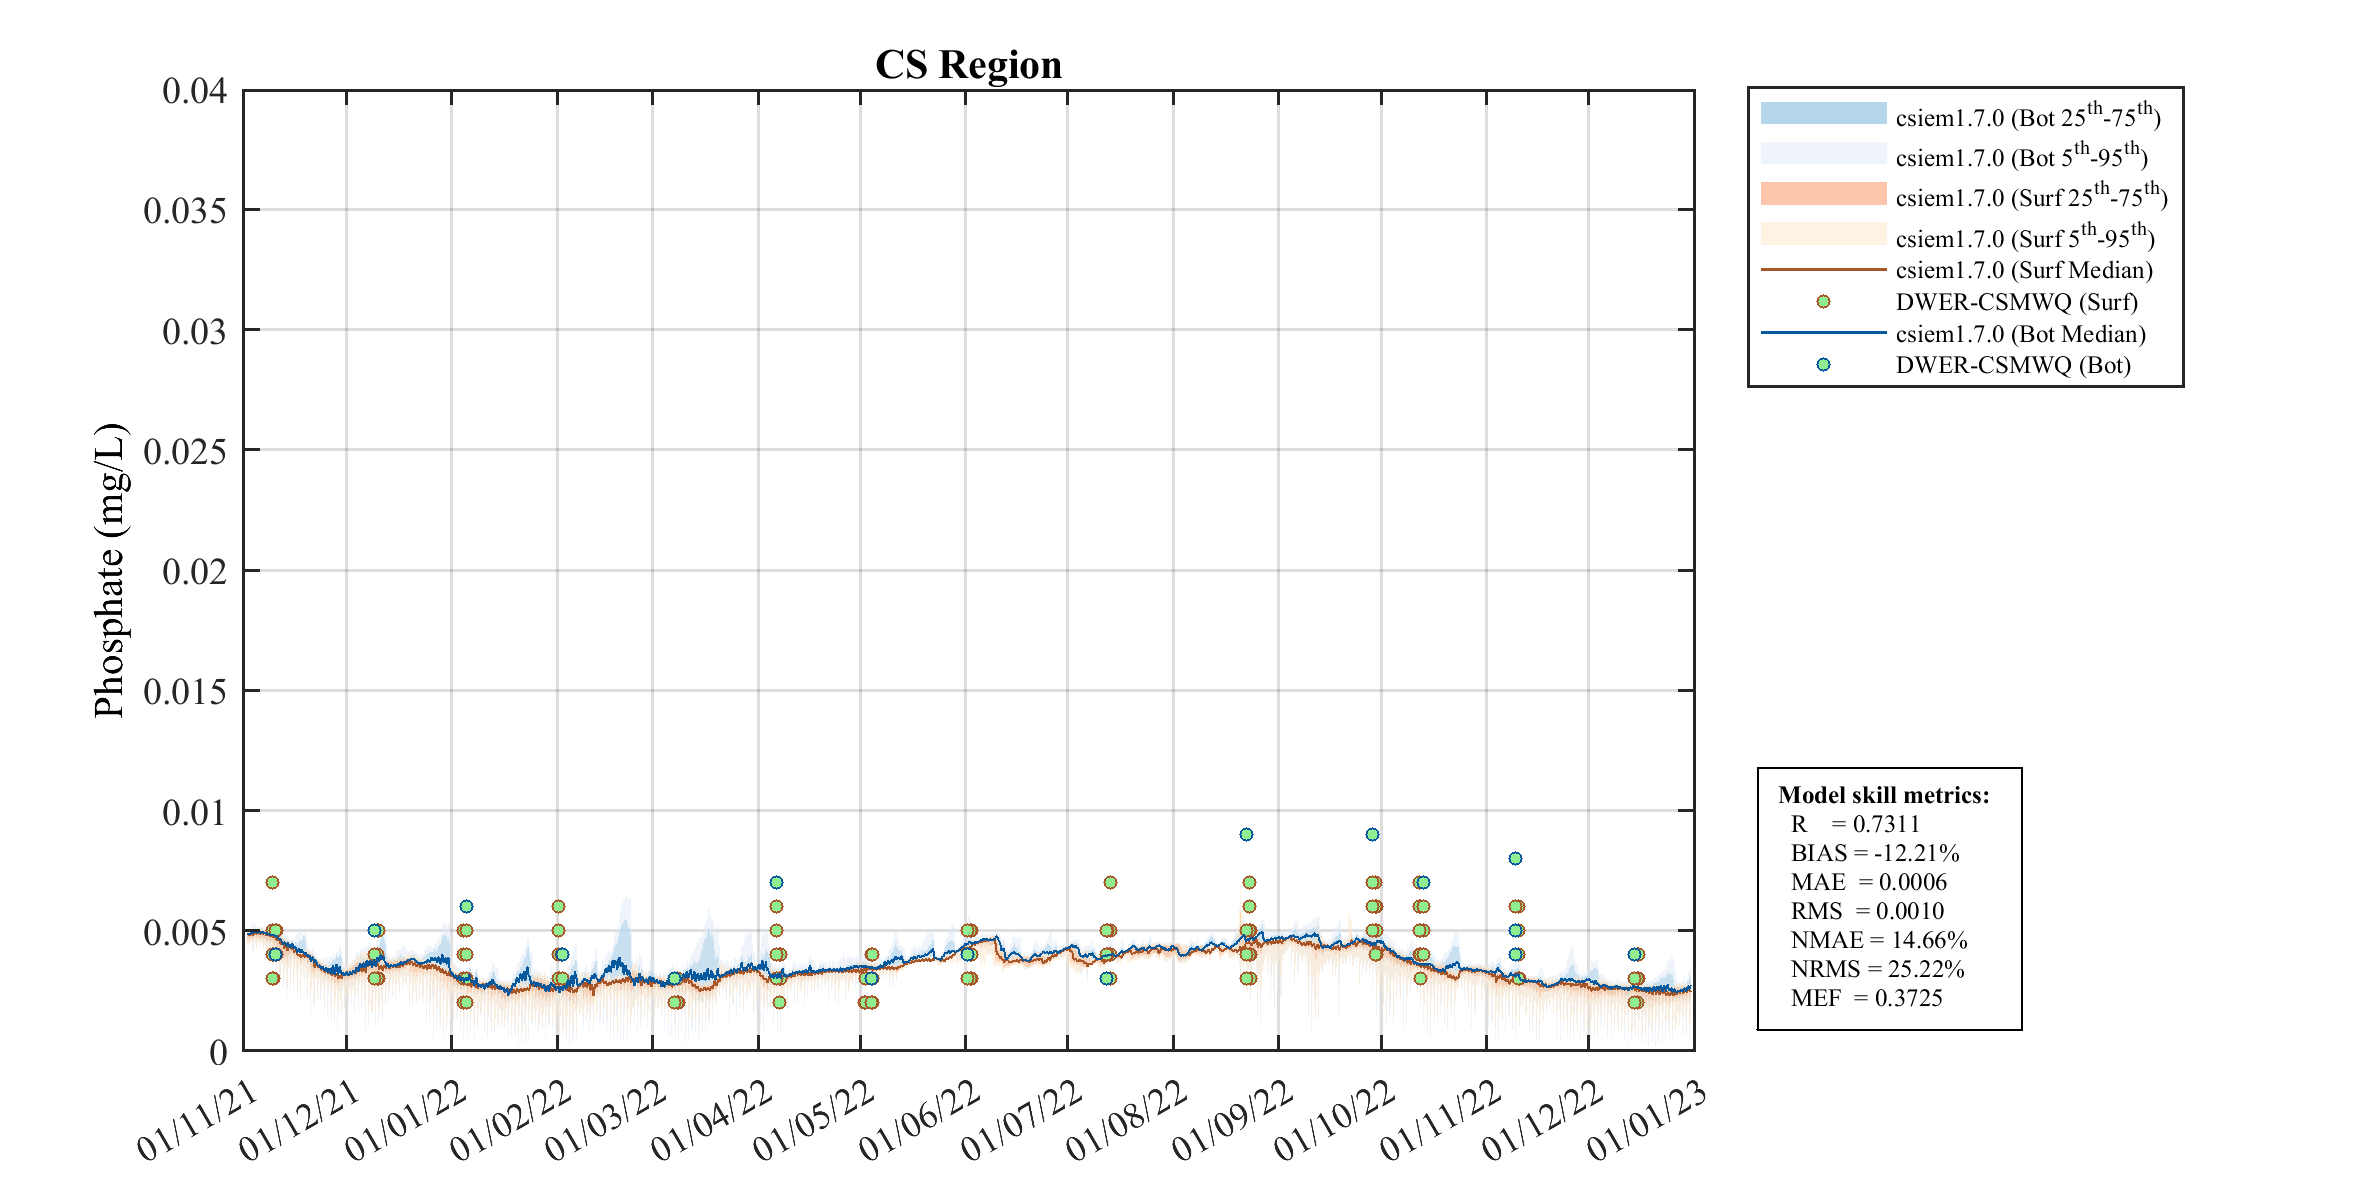
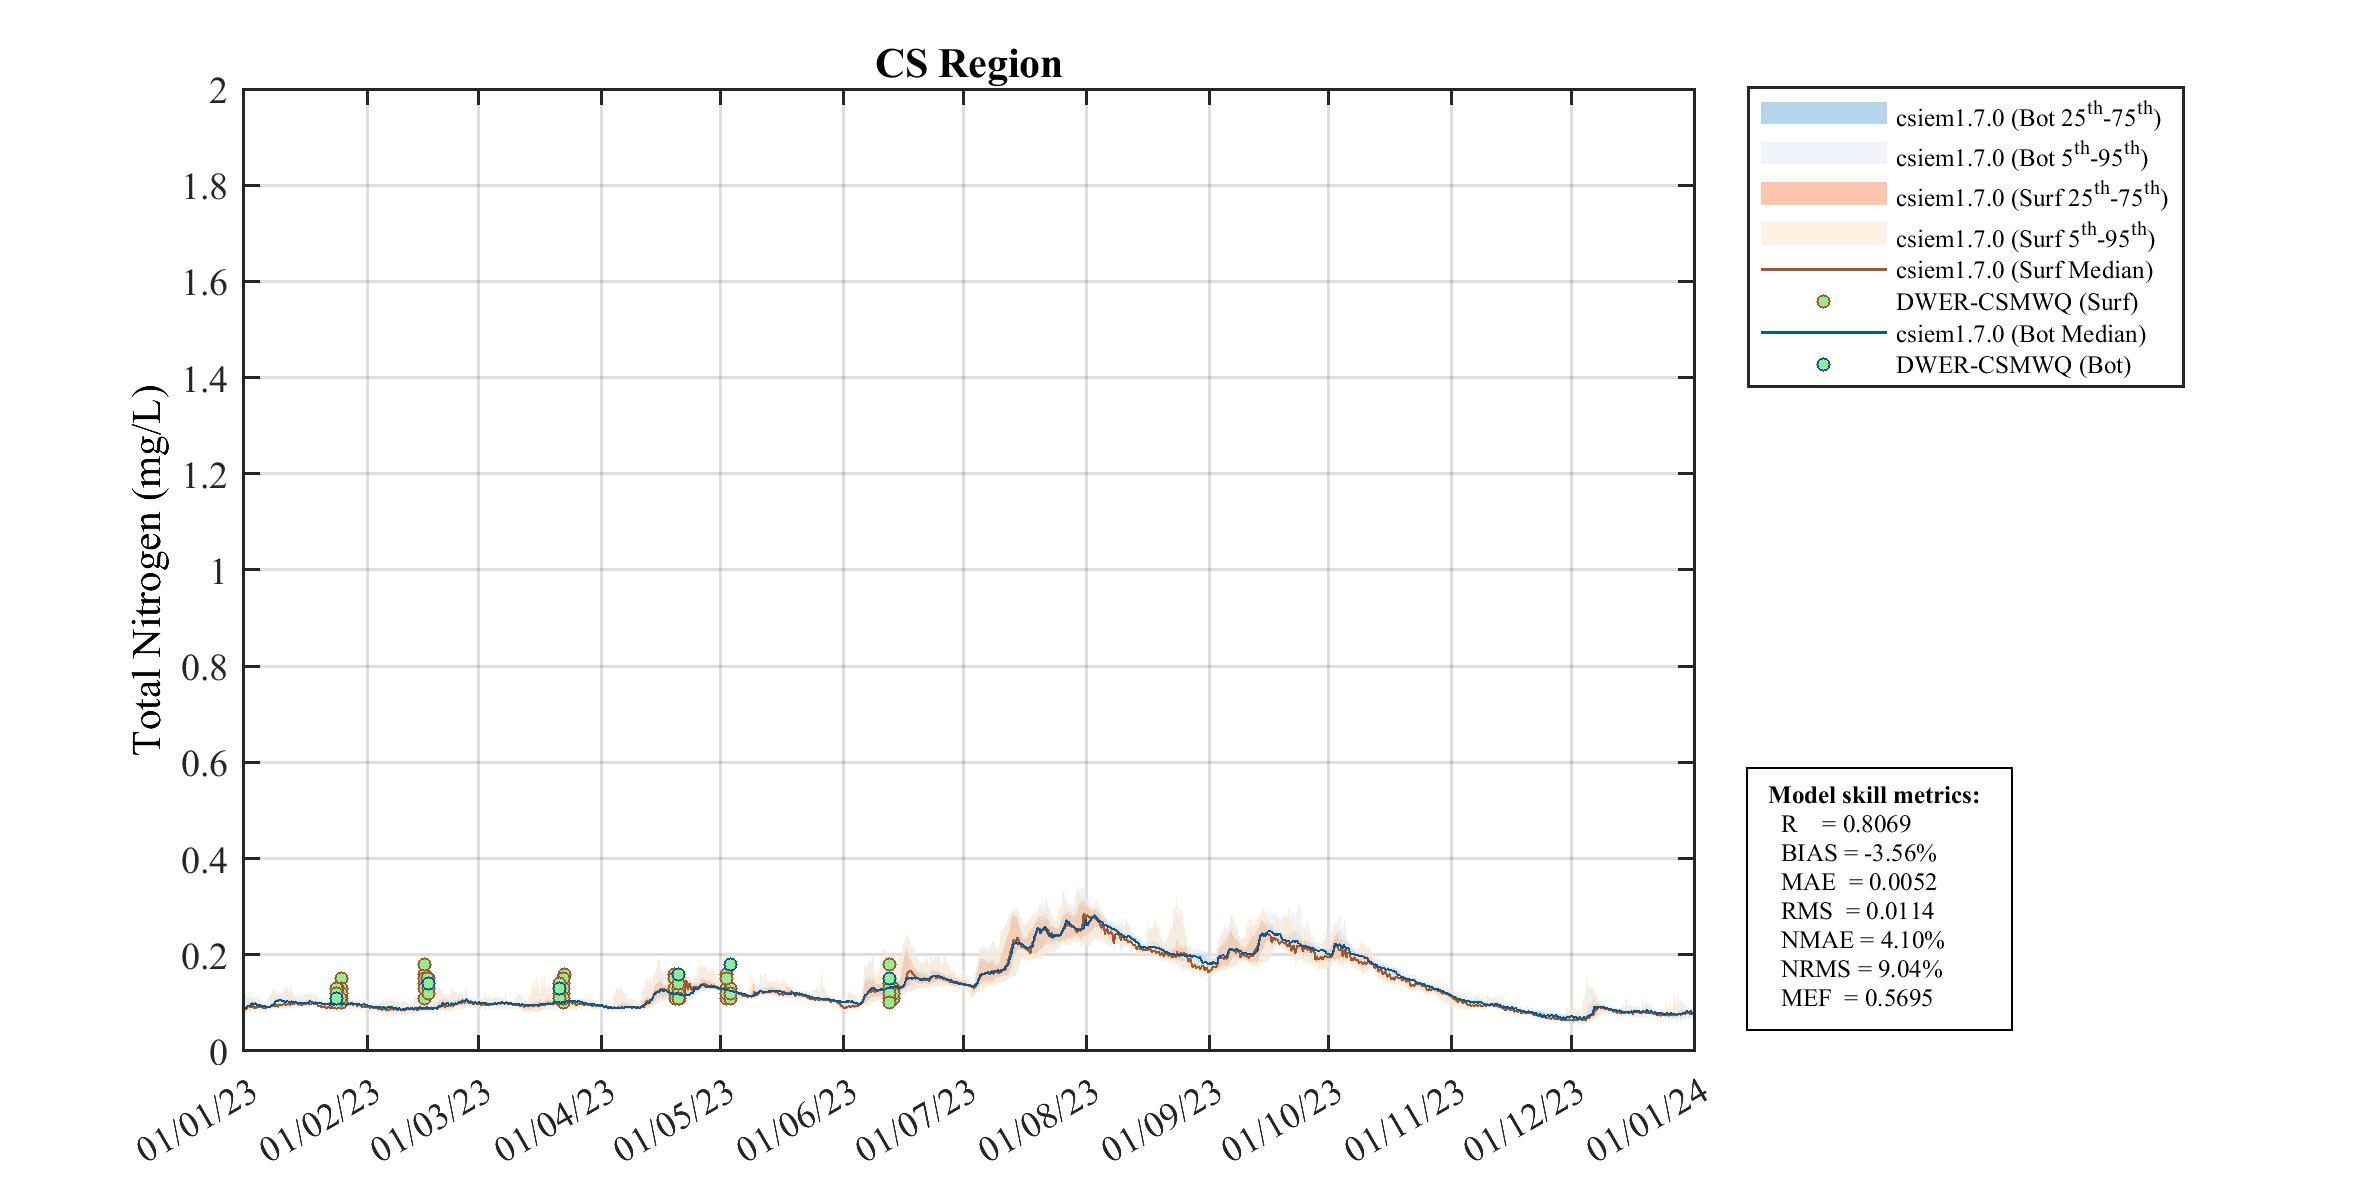
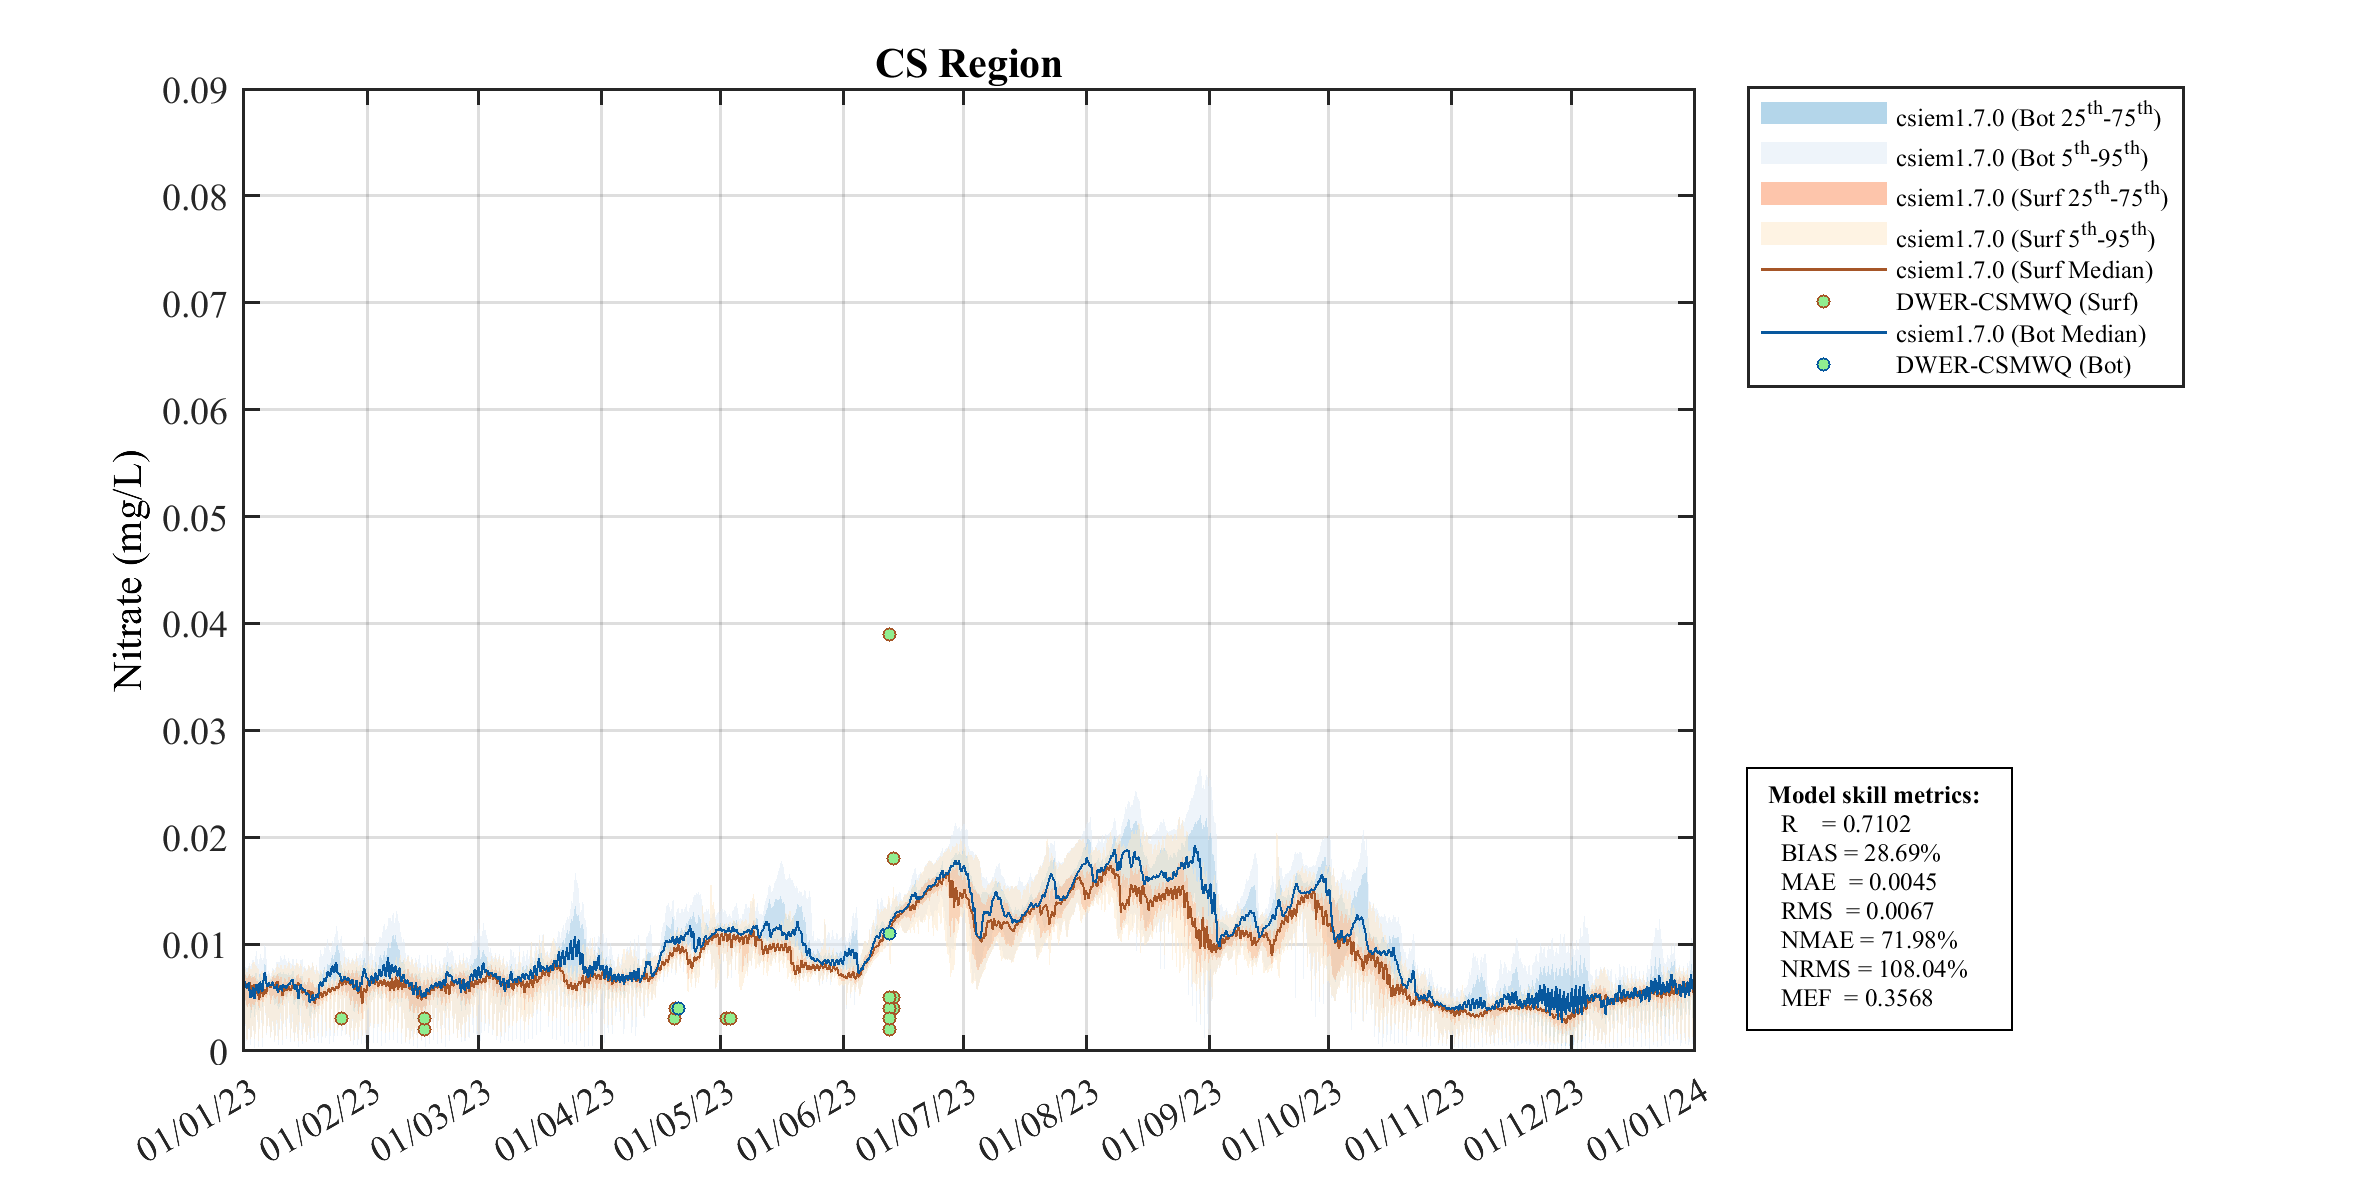
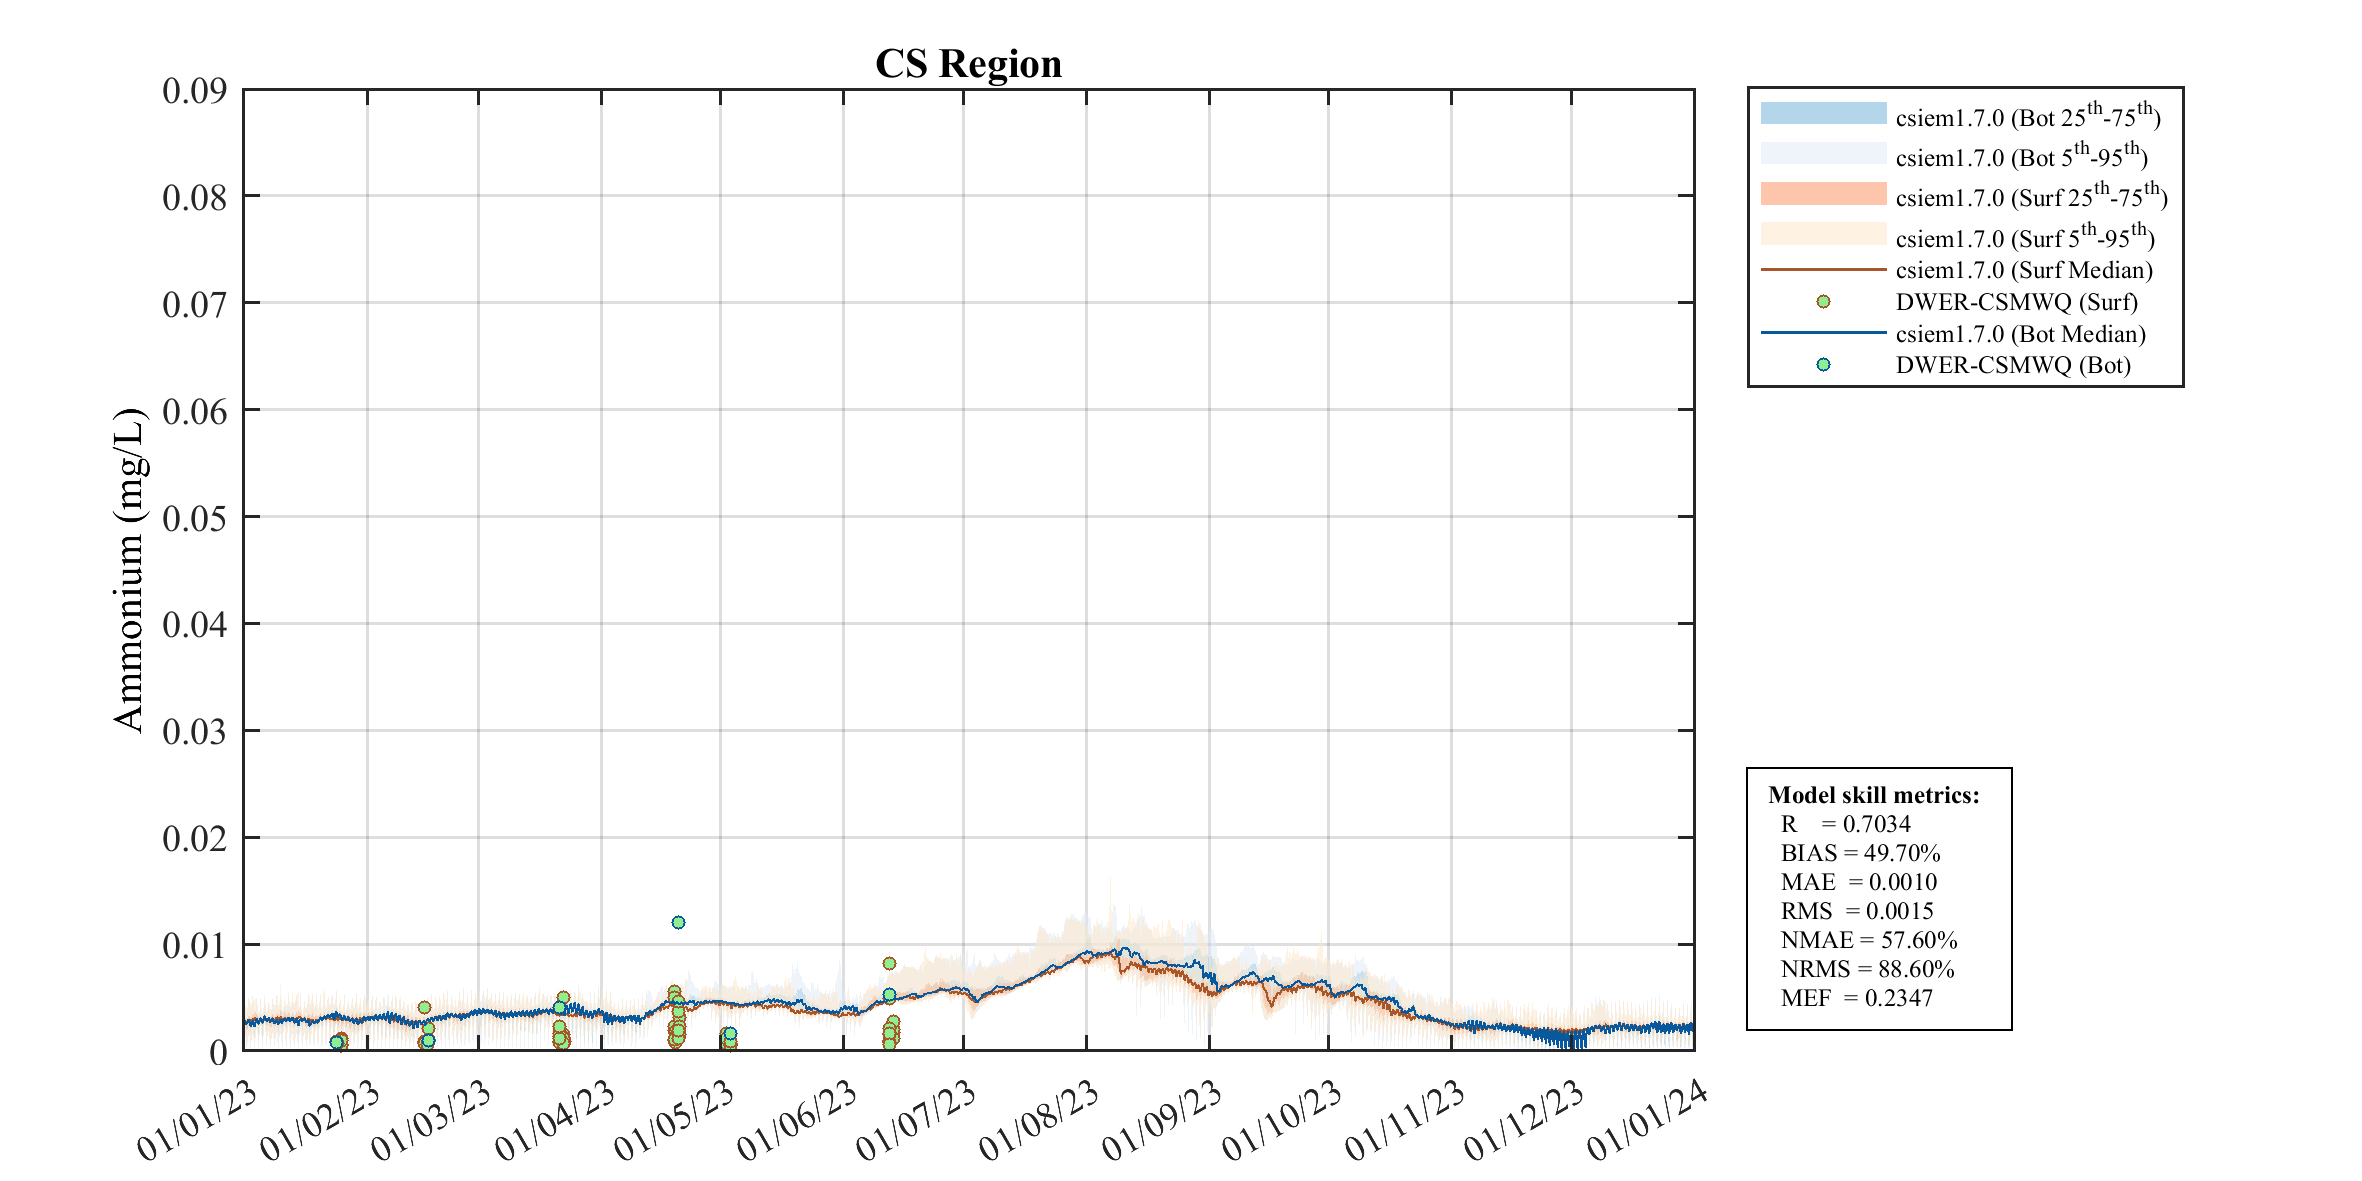
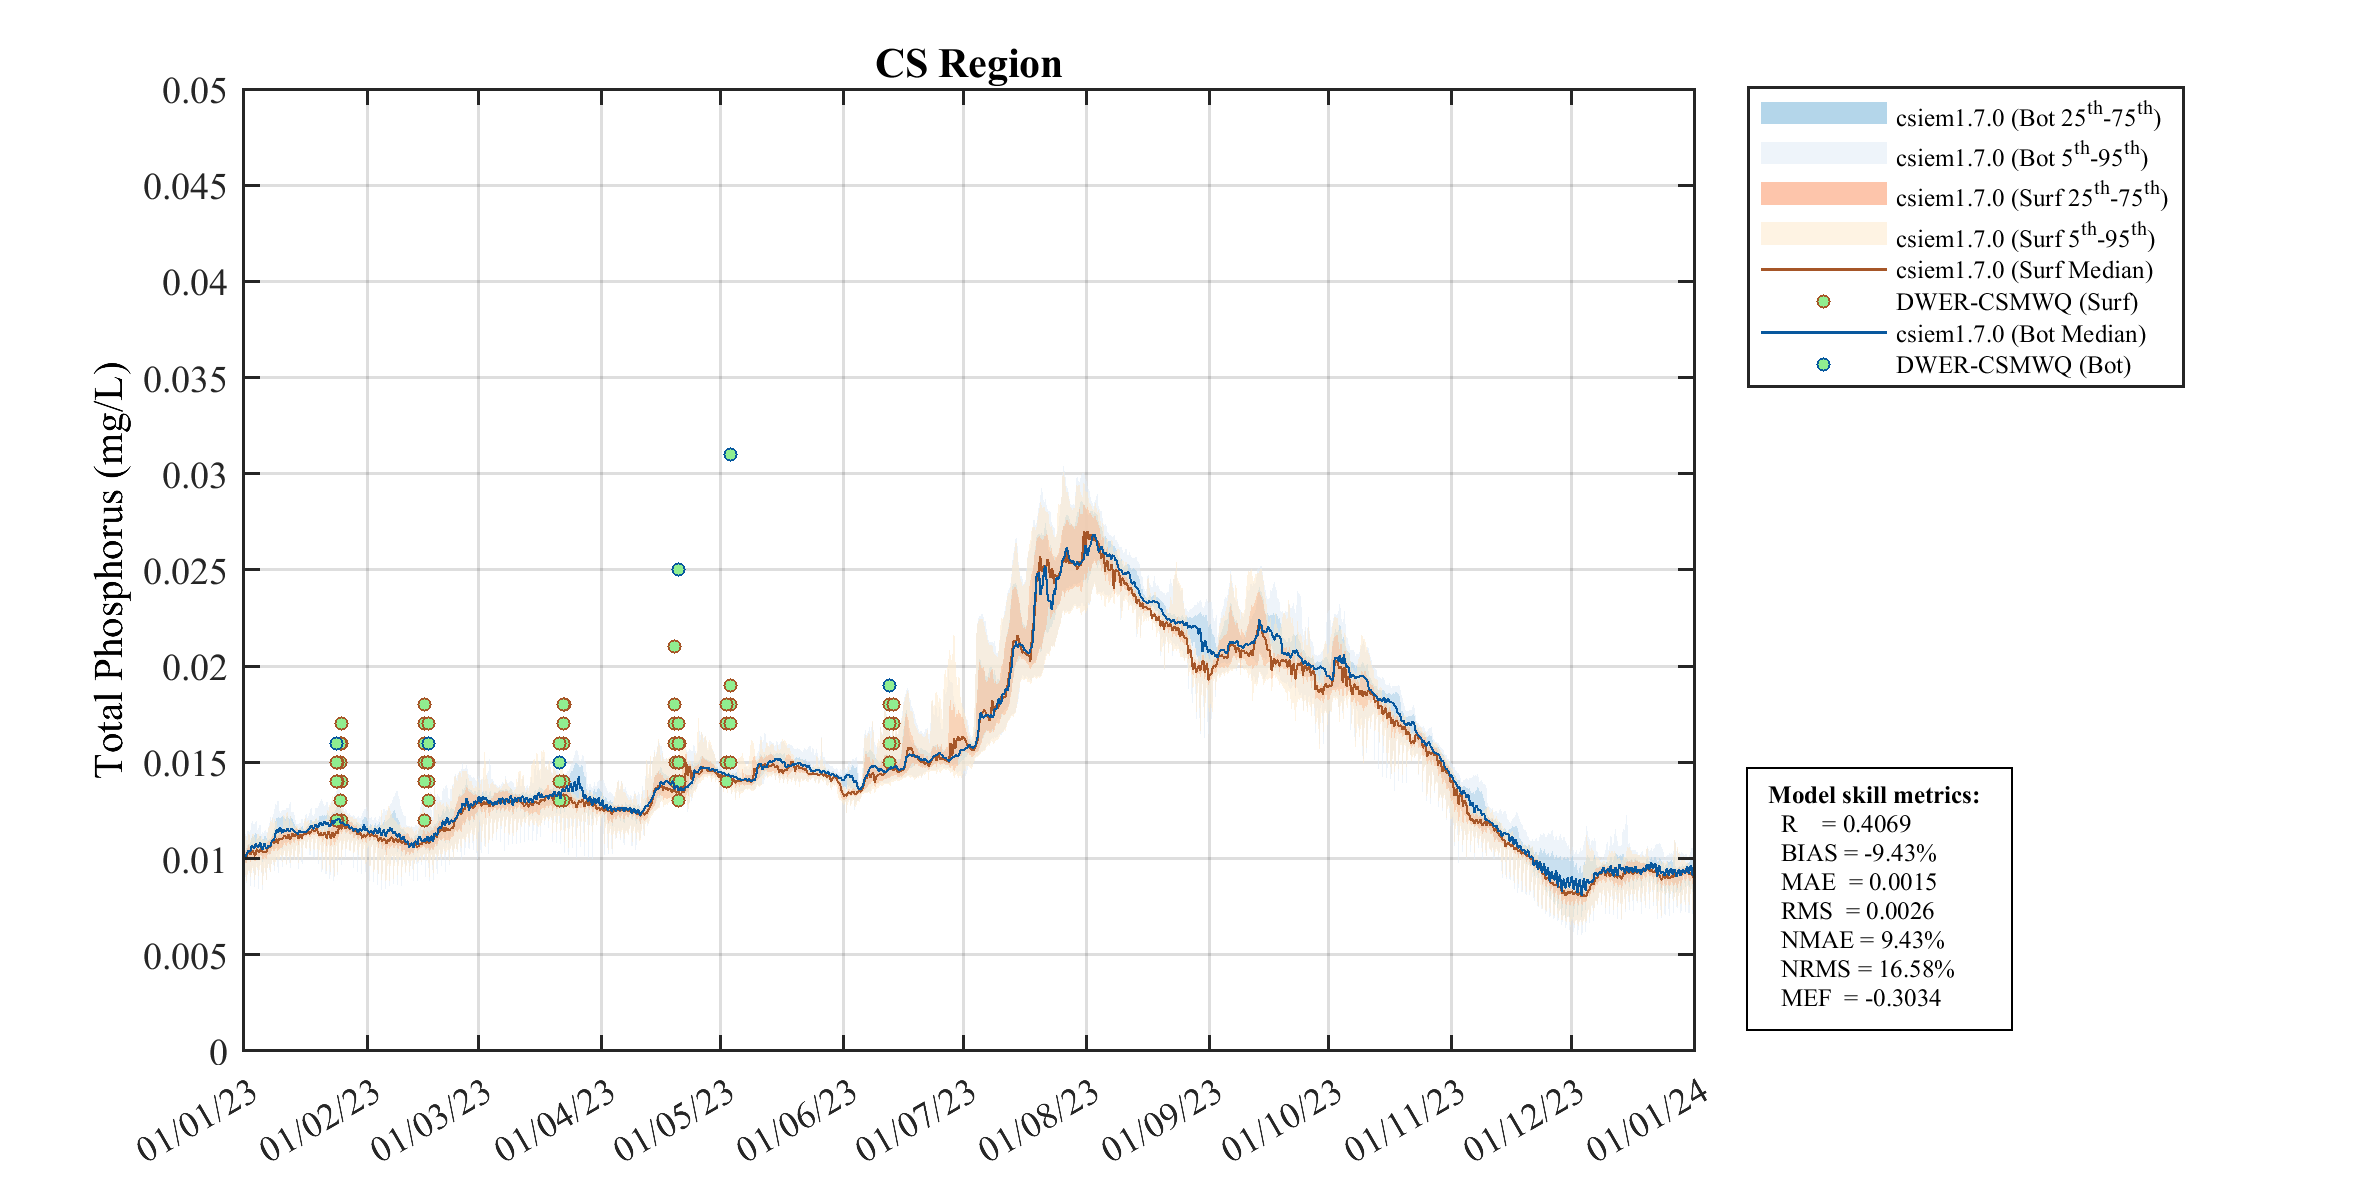
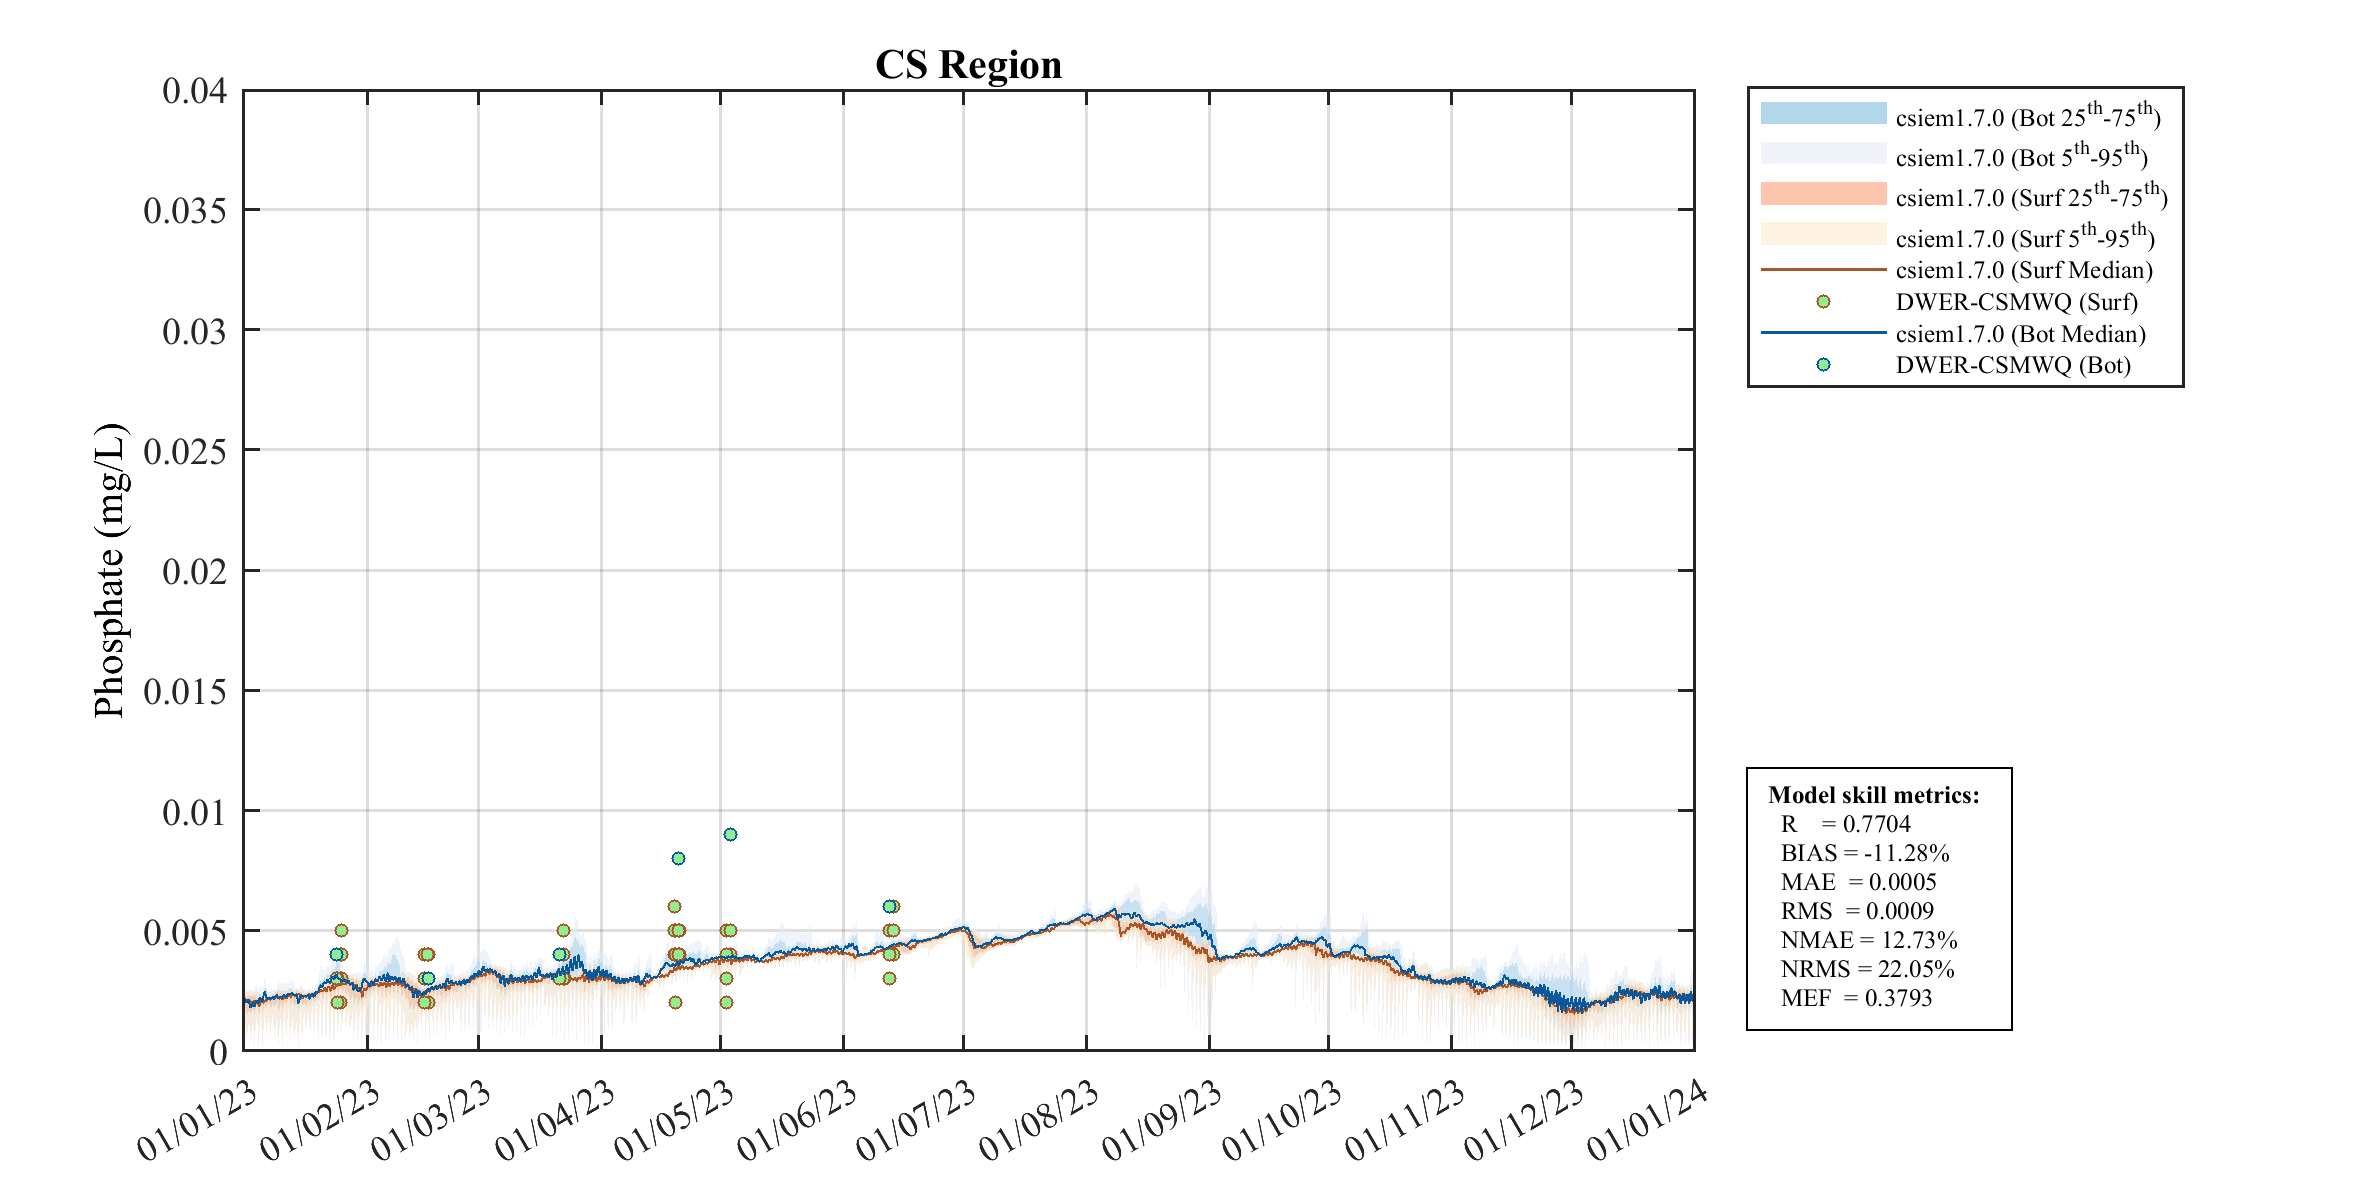
Data shown for the CS Region aggregate.
Nitrogen Species
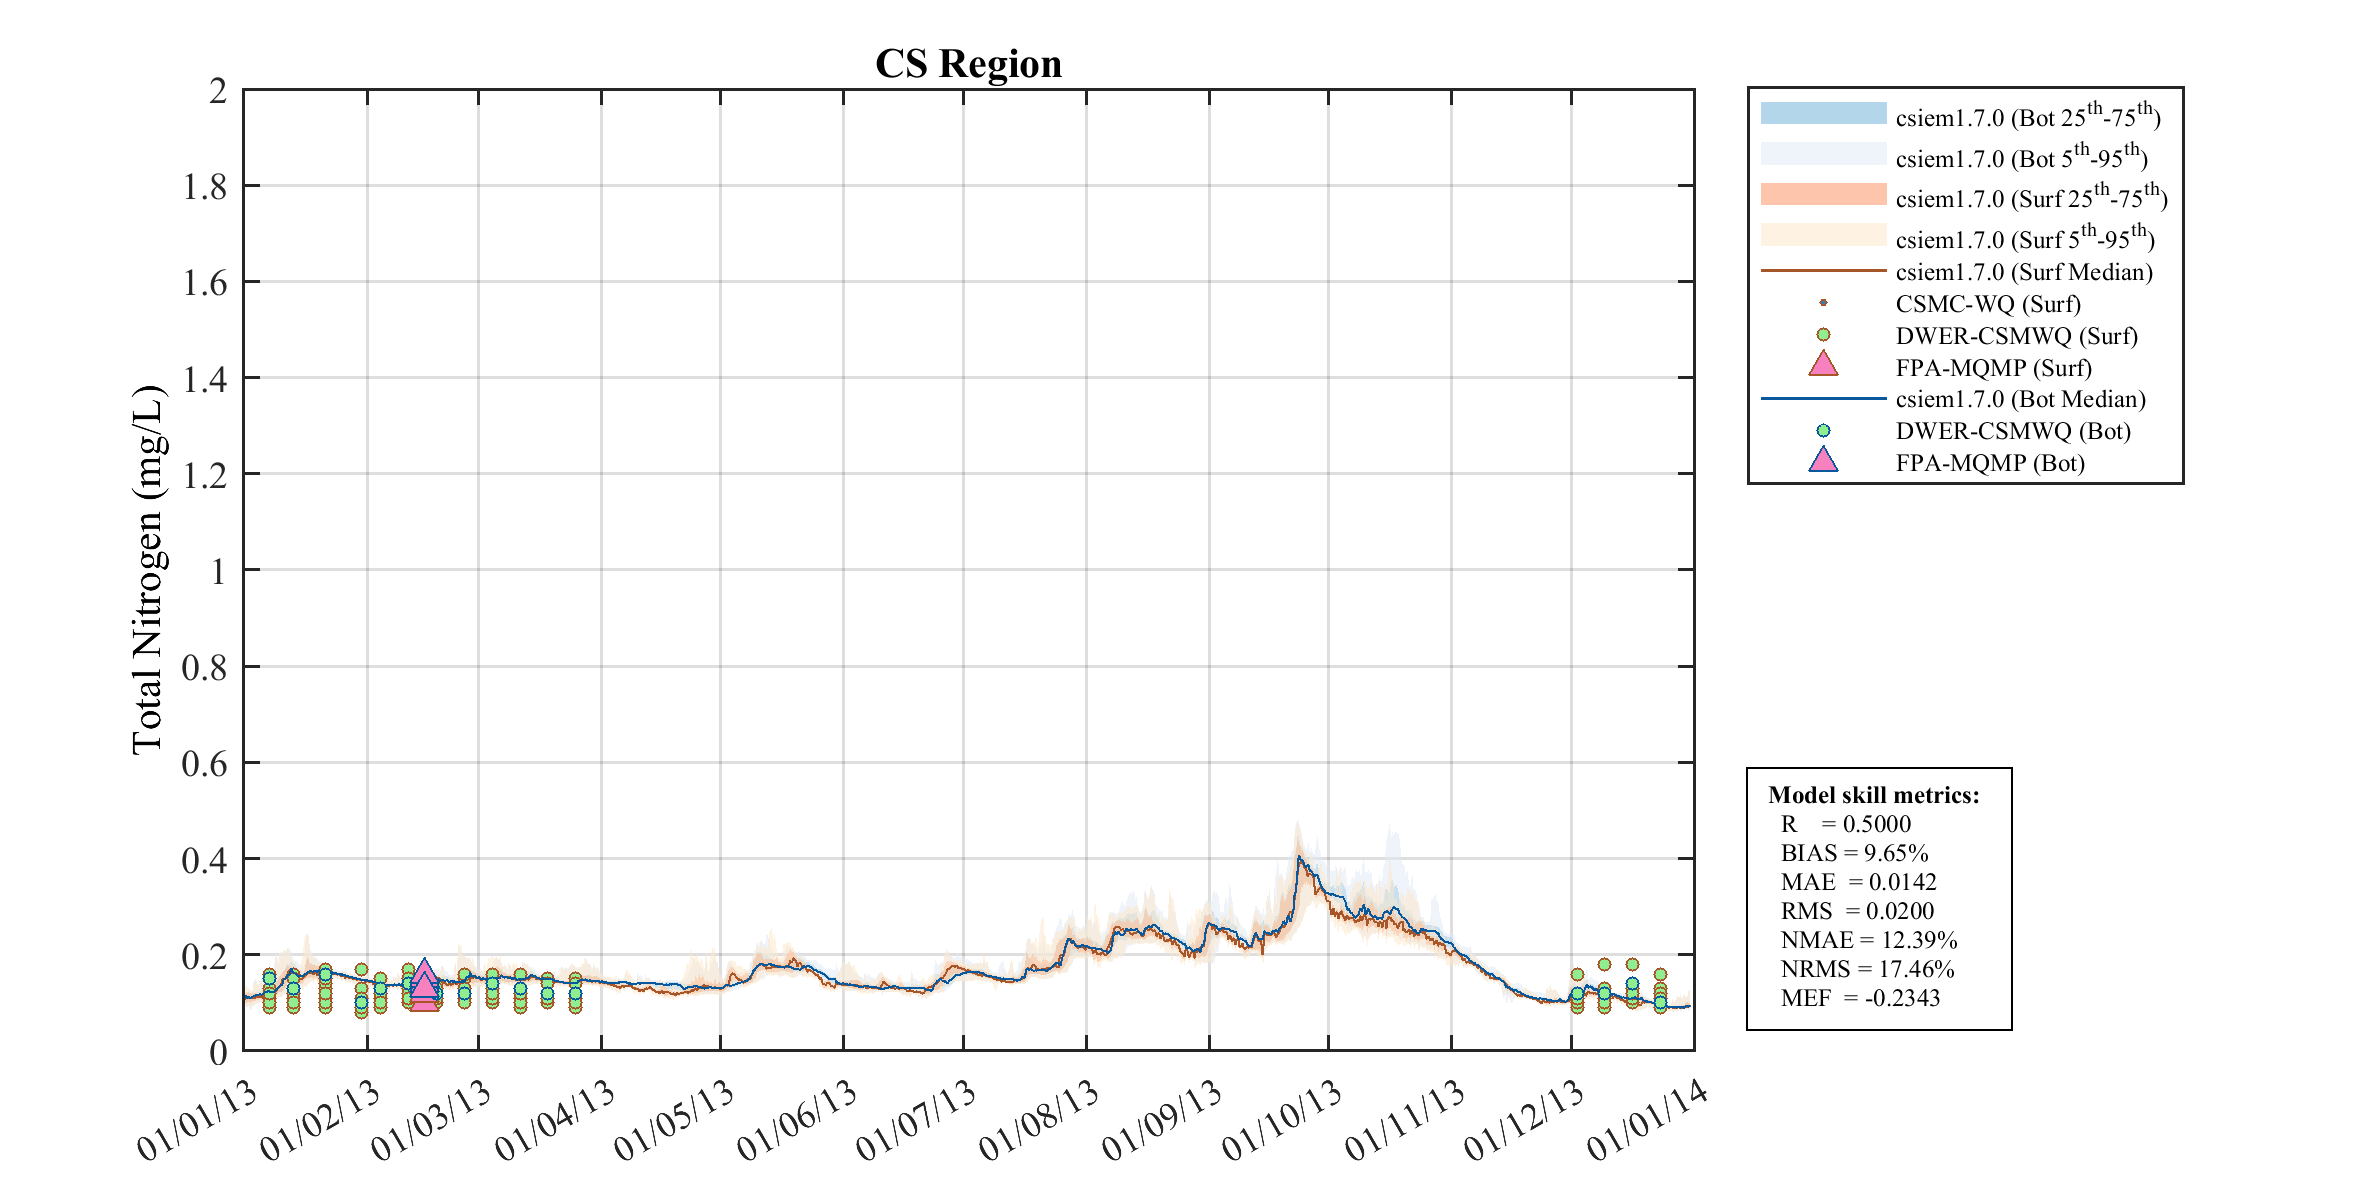
Total Nitrogen (mg/L)
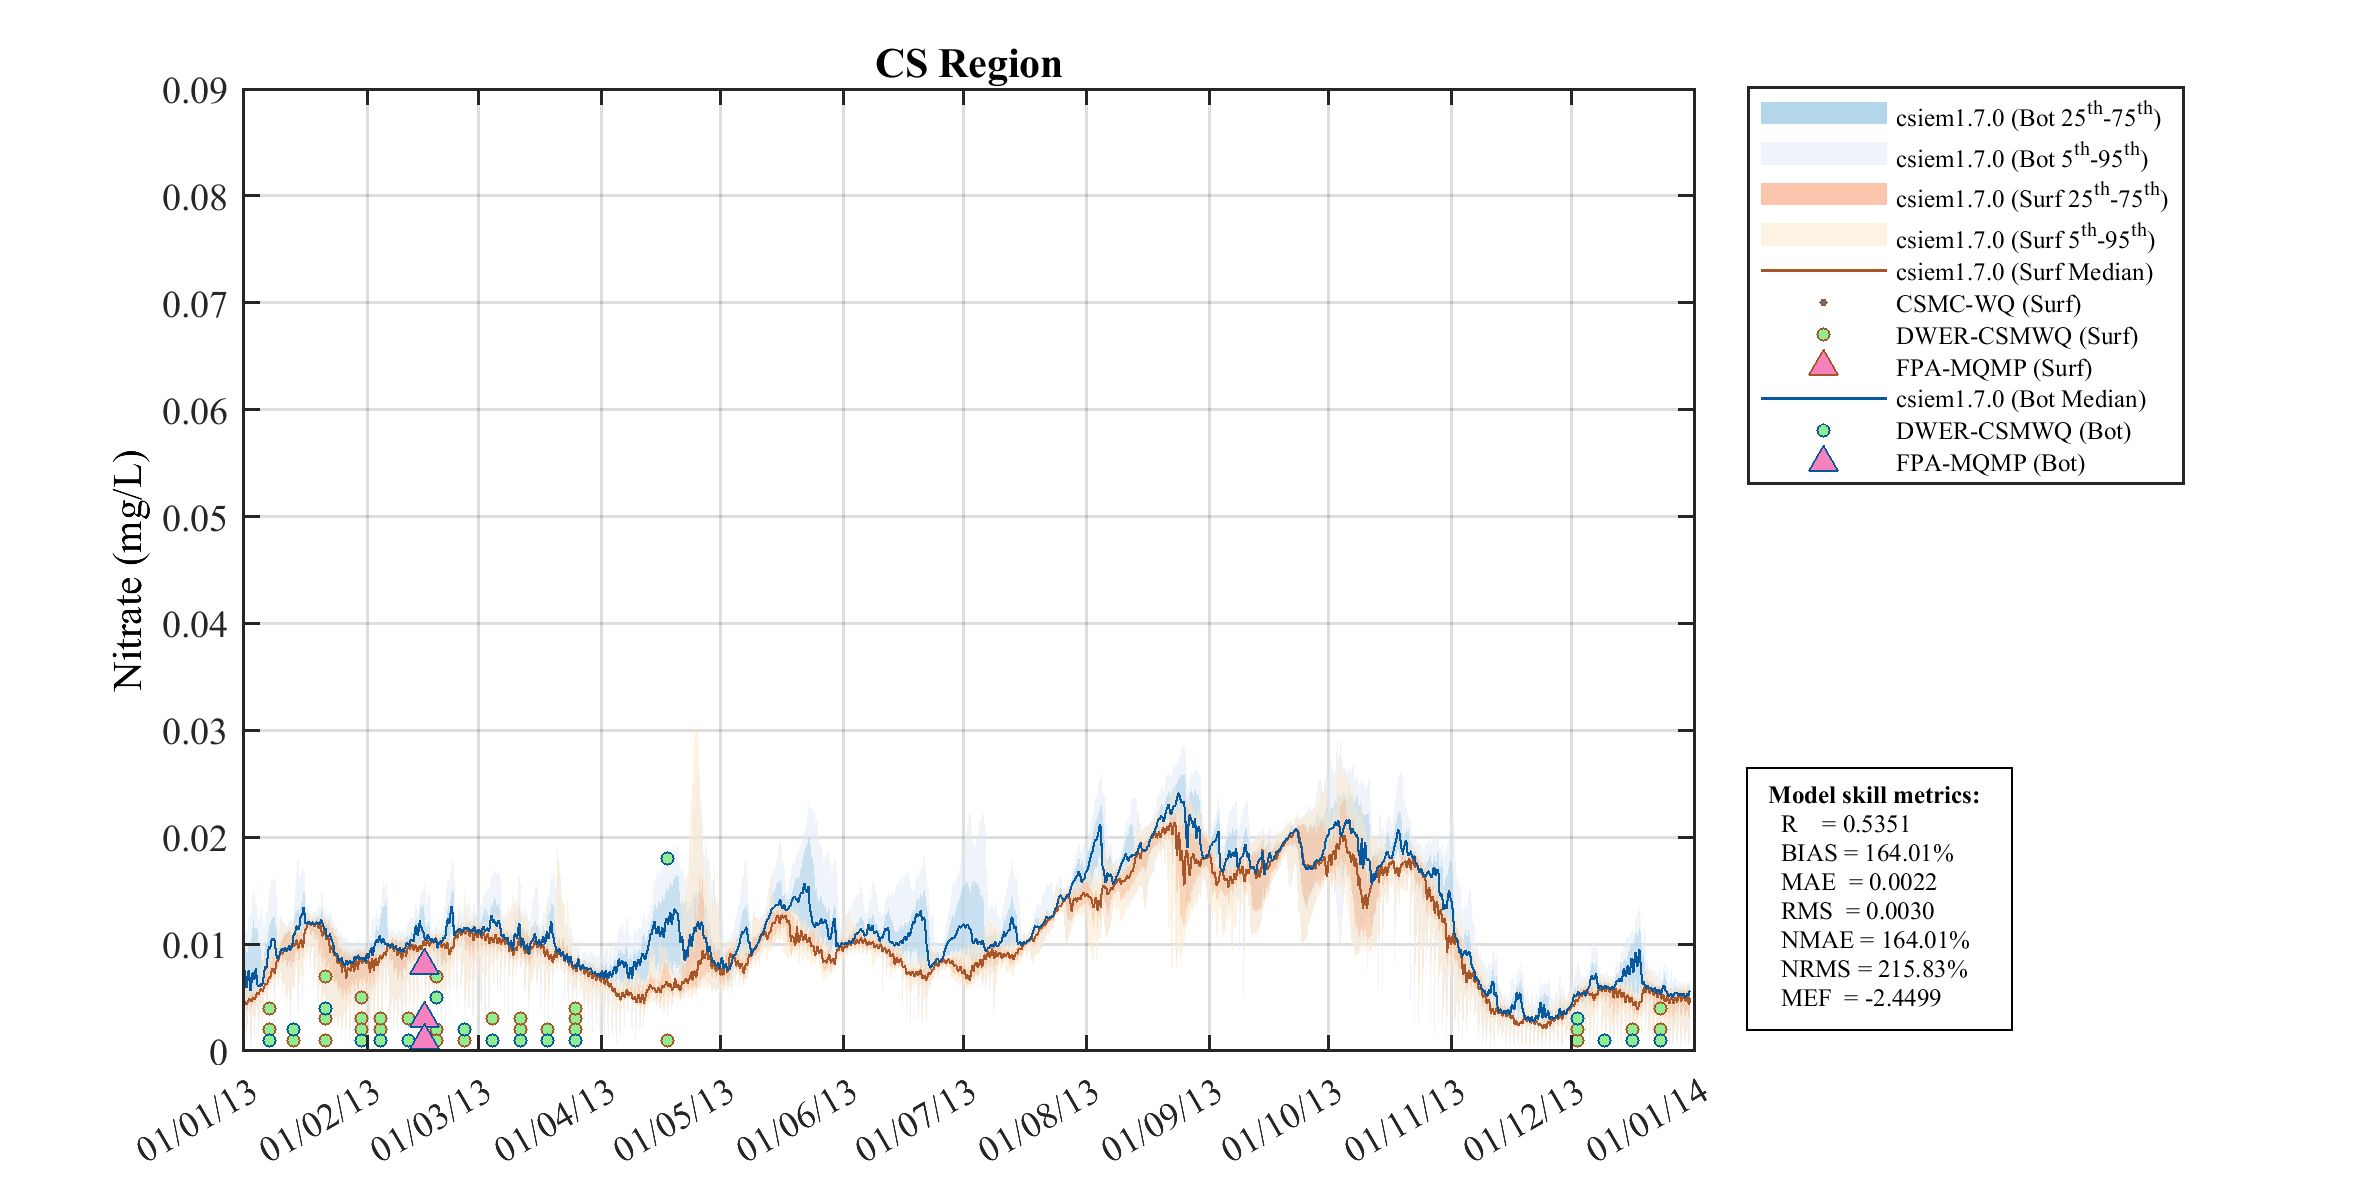
Nitrate (NO₃) (mg/L)
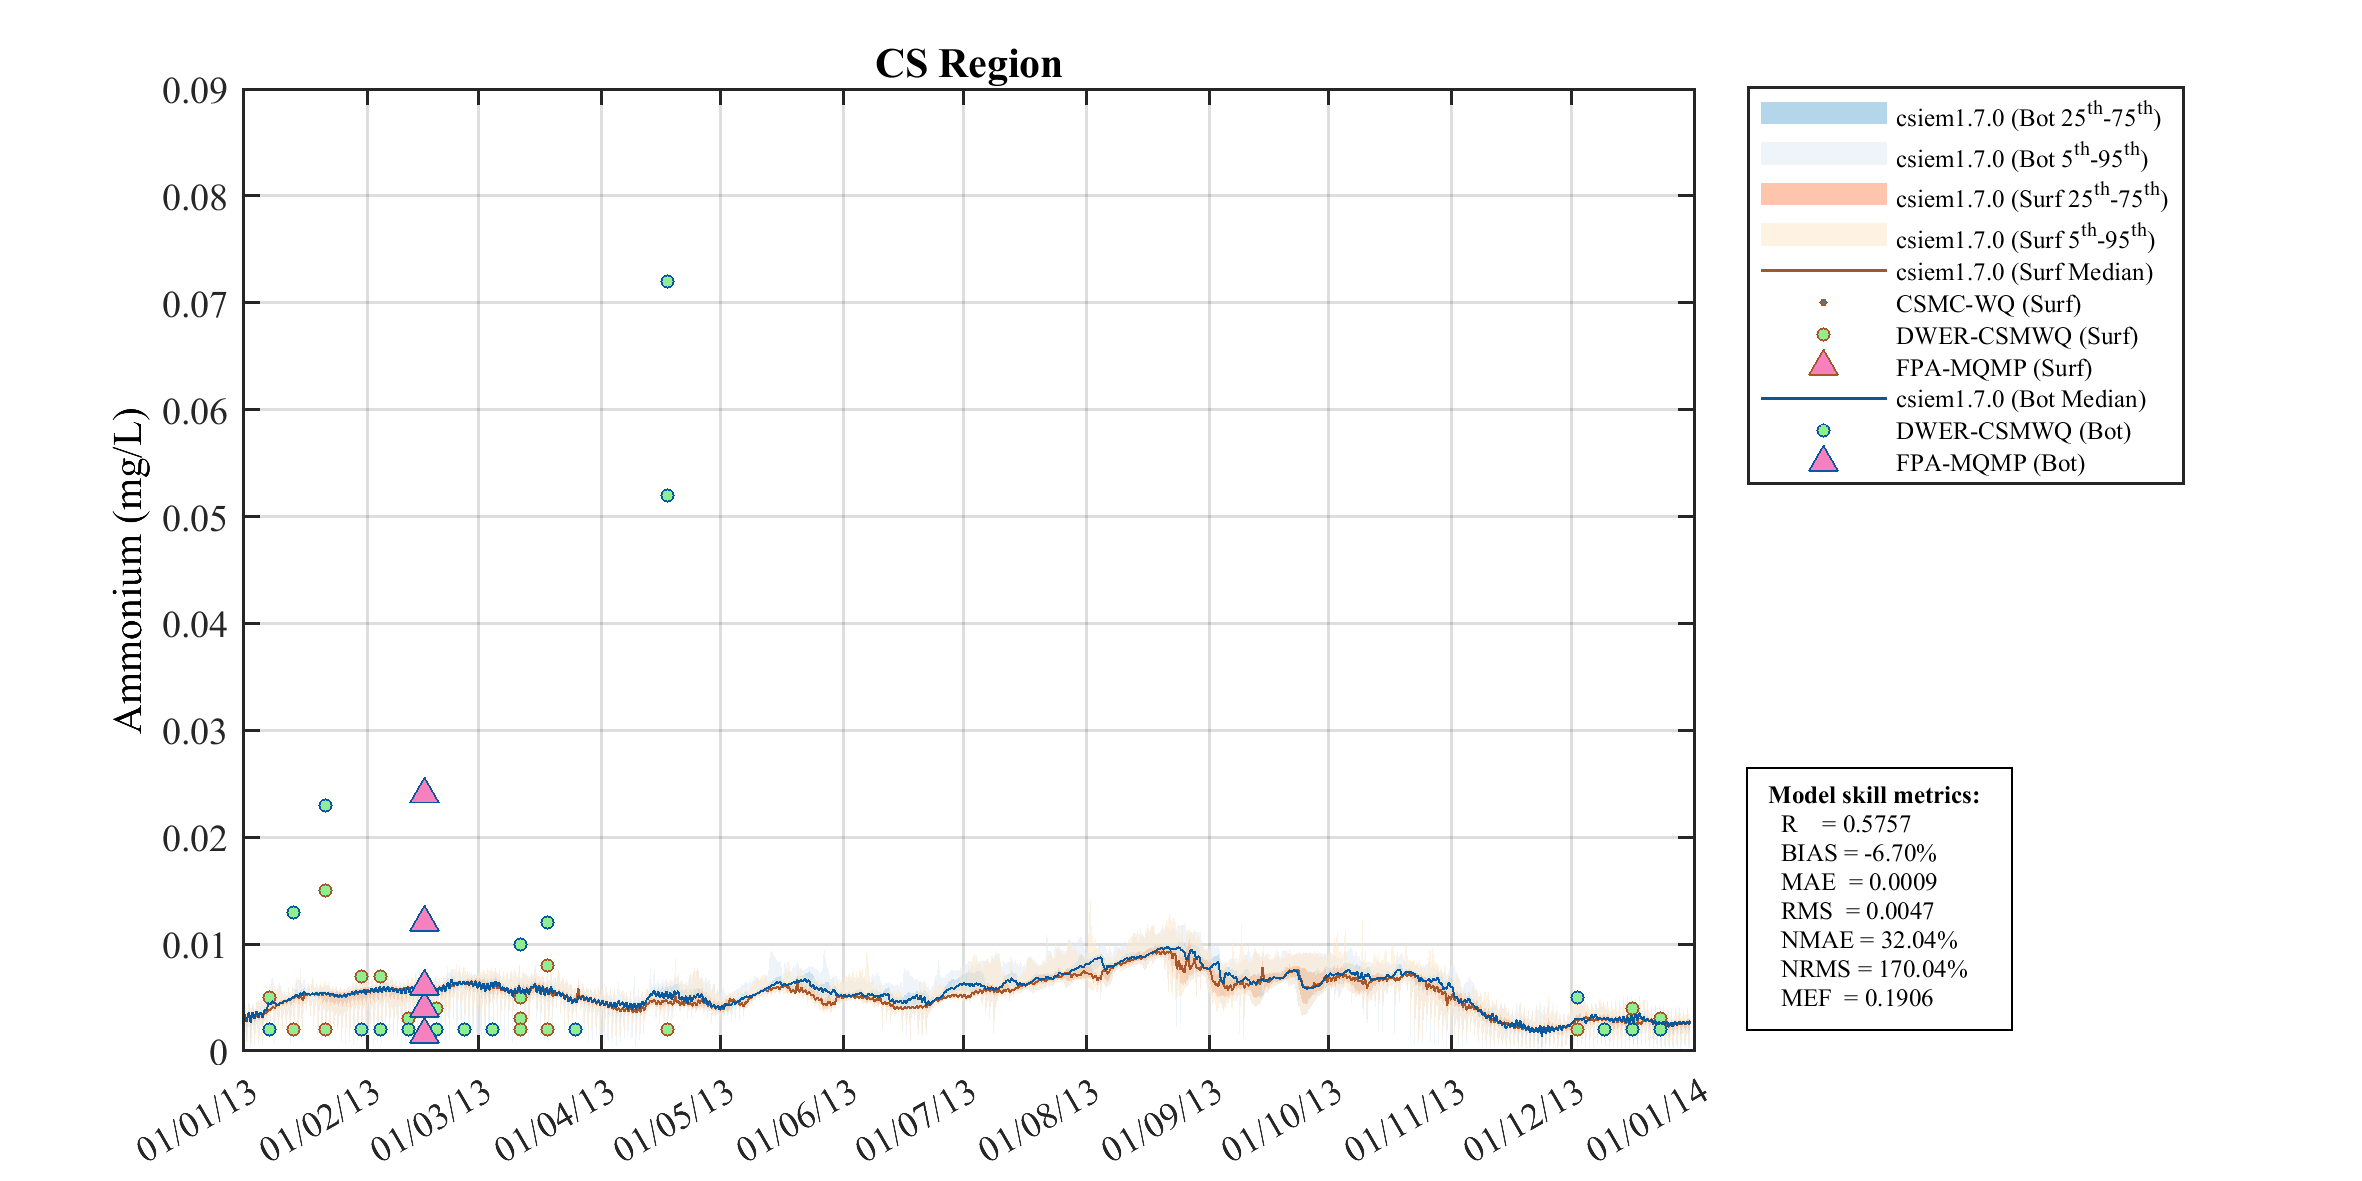
Ammonium (NH₄) (mg/L)
Phosphorus Species
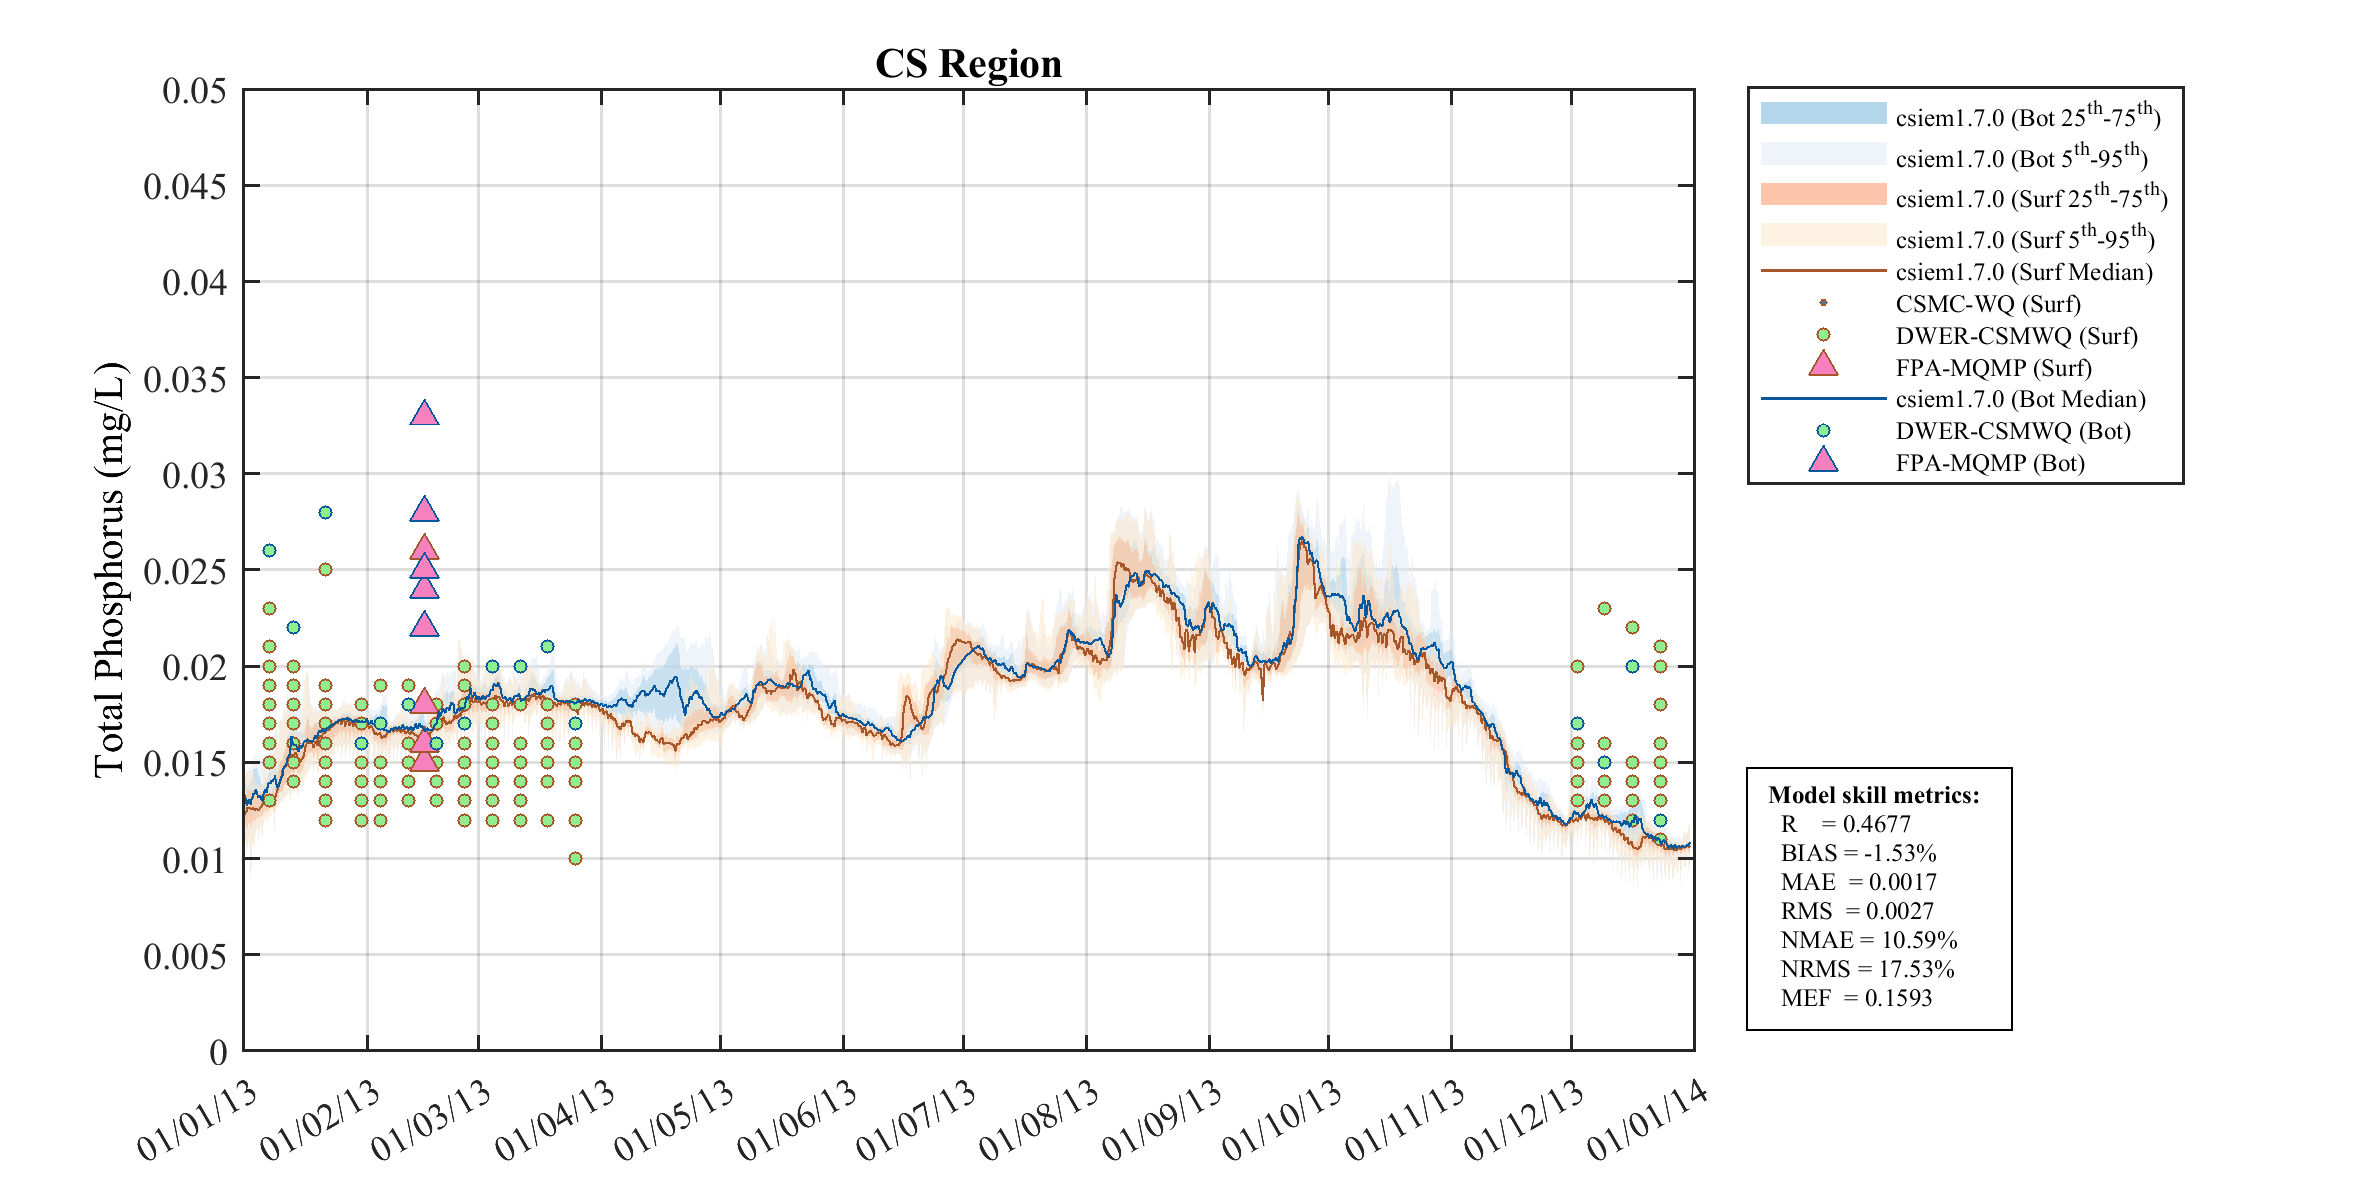
Total Phosphorus (mg/L)
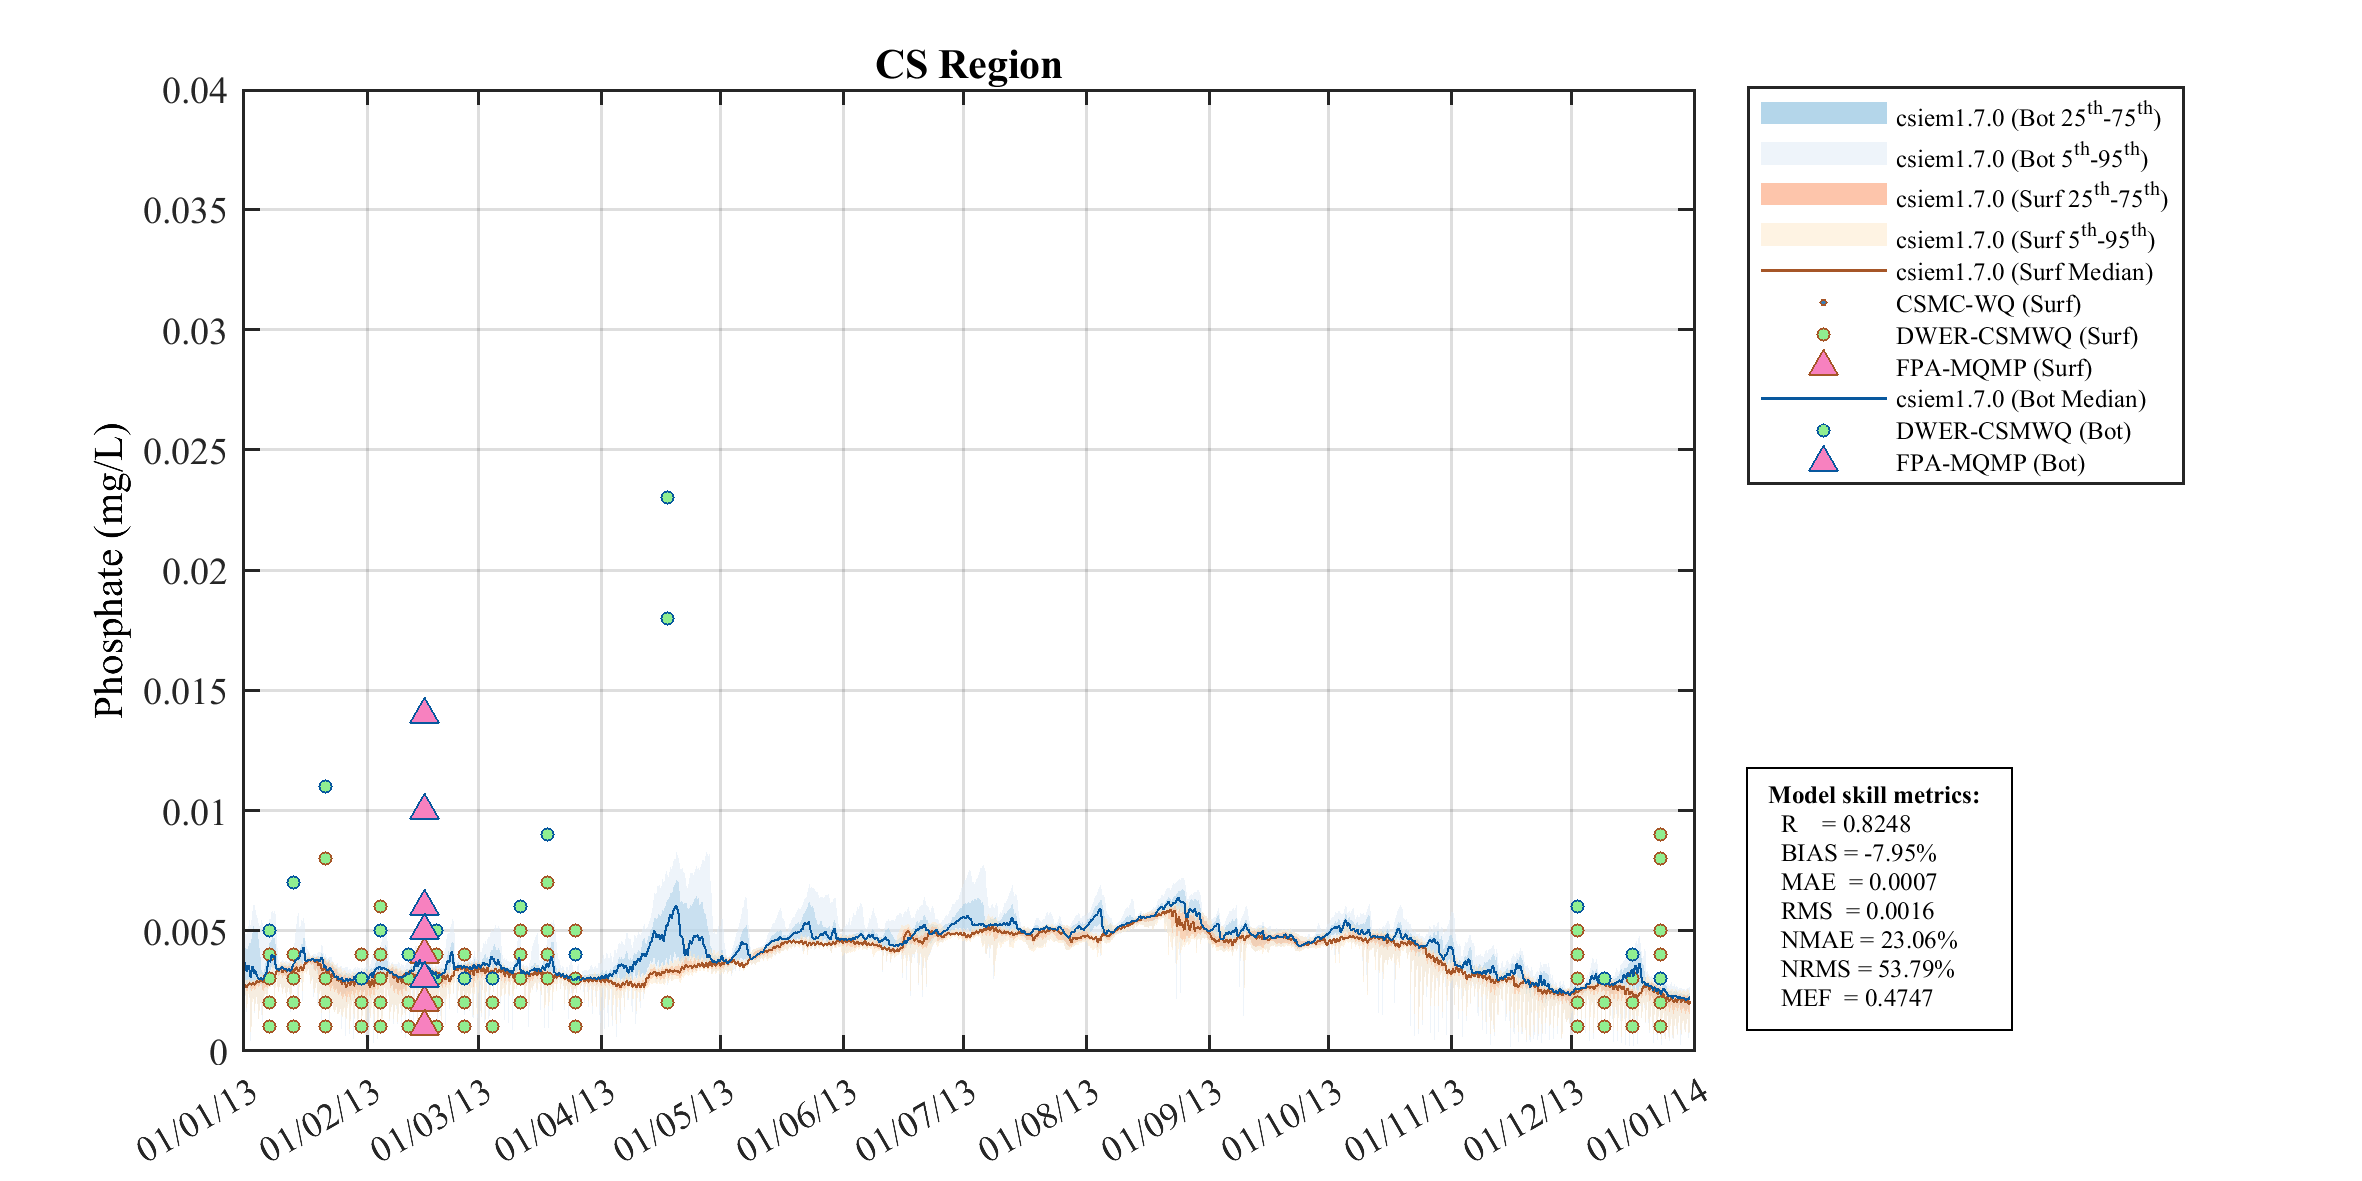
Phosphate (FRP) (mg/L)
Nitrogen Species
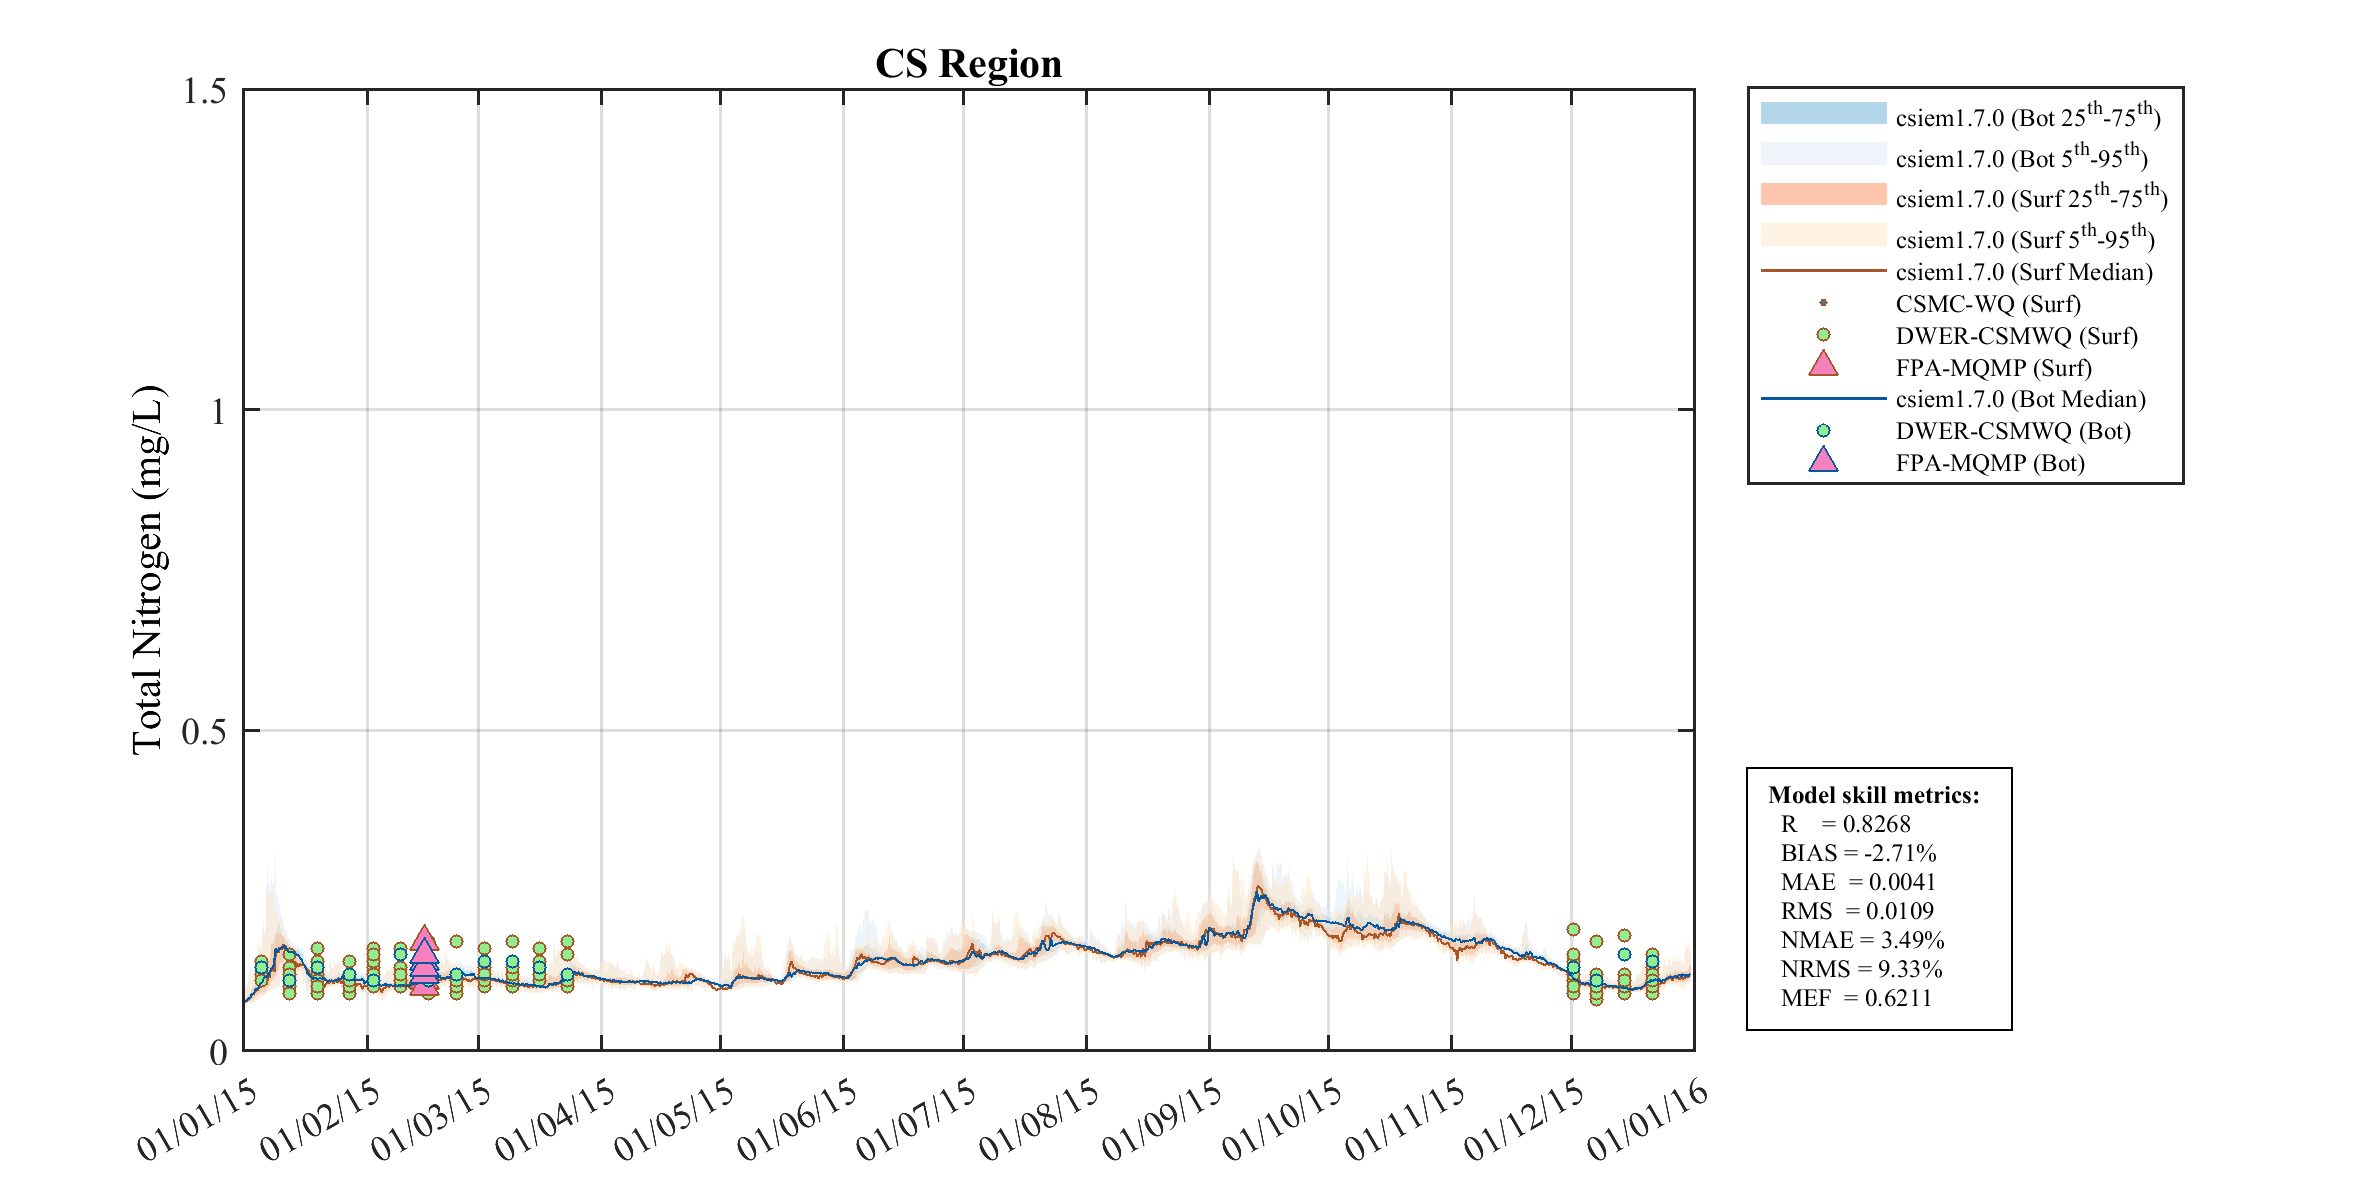
Total Nitrogen (mg/L)
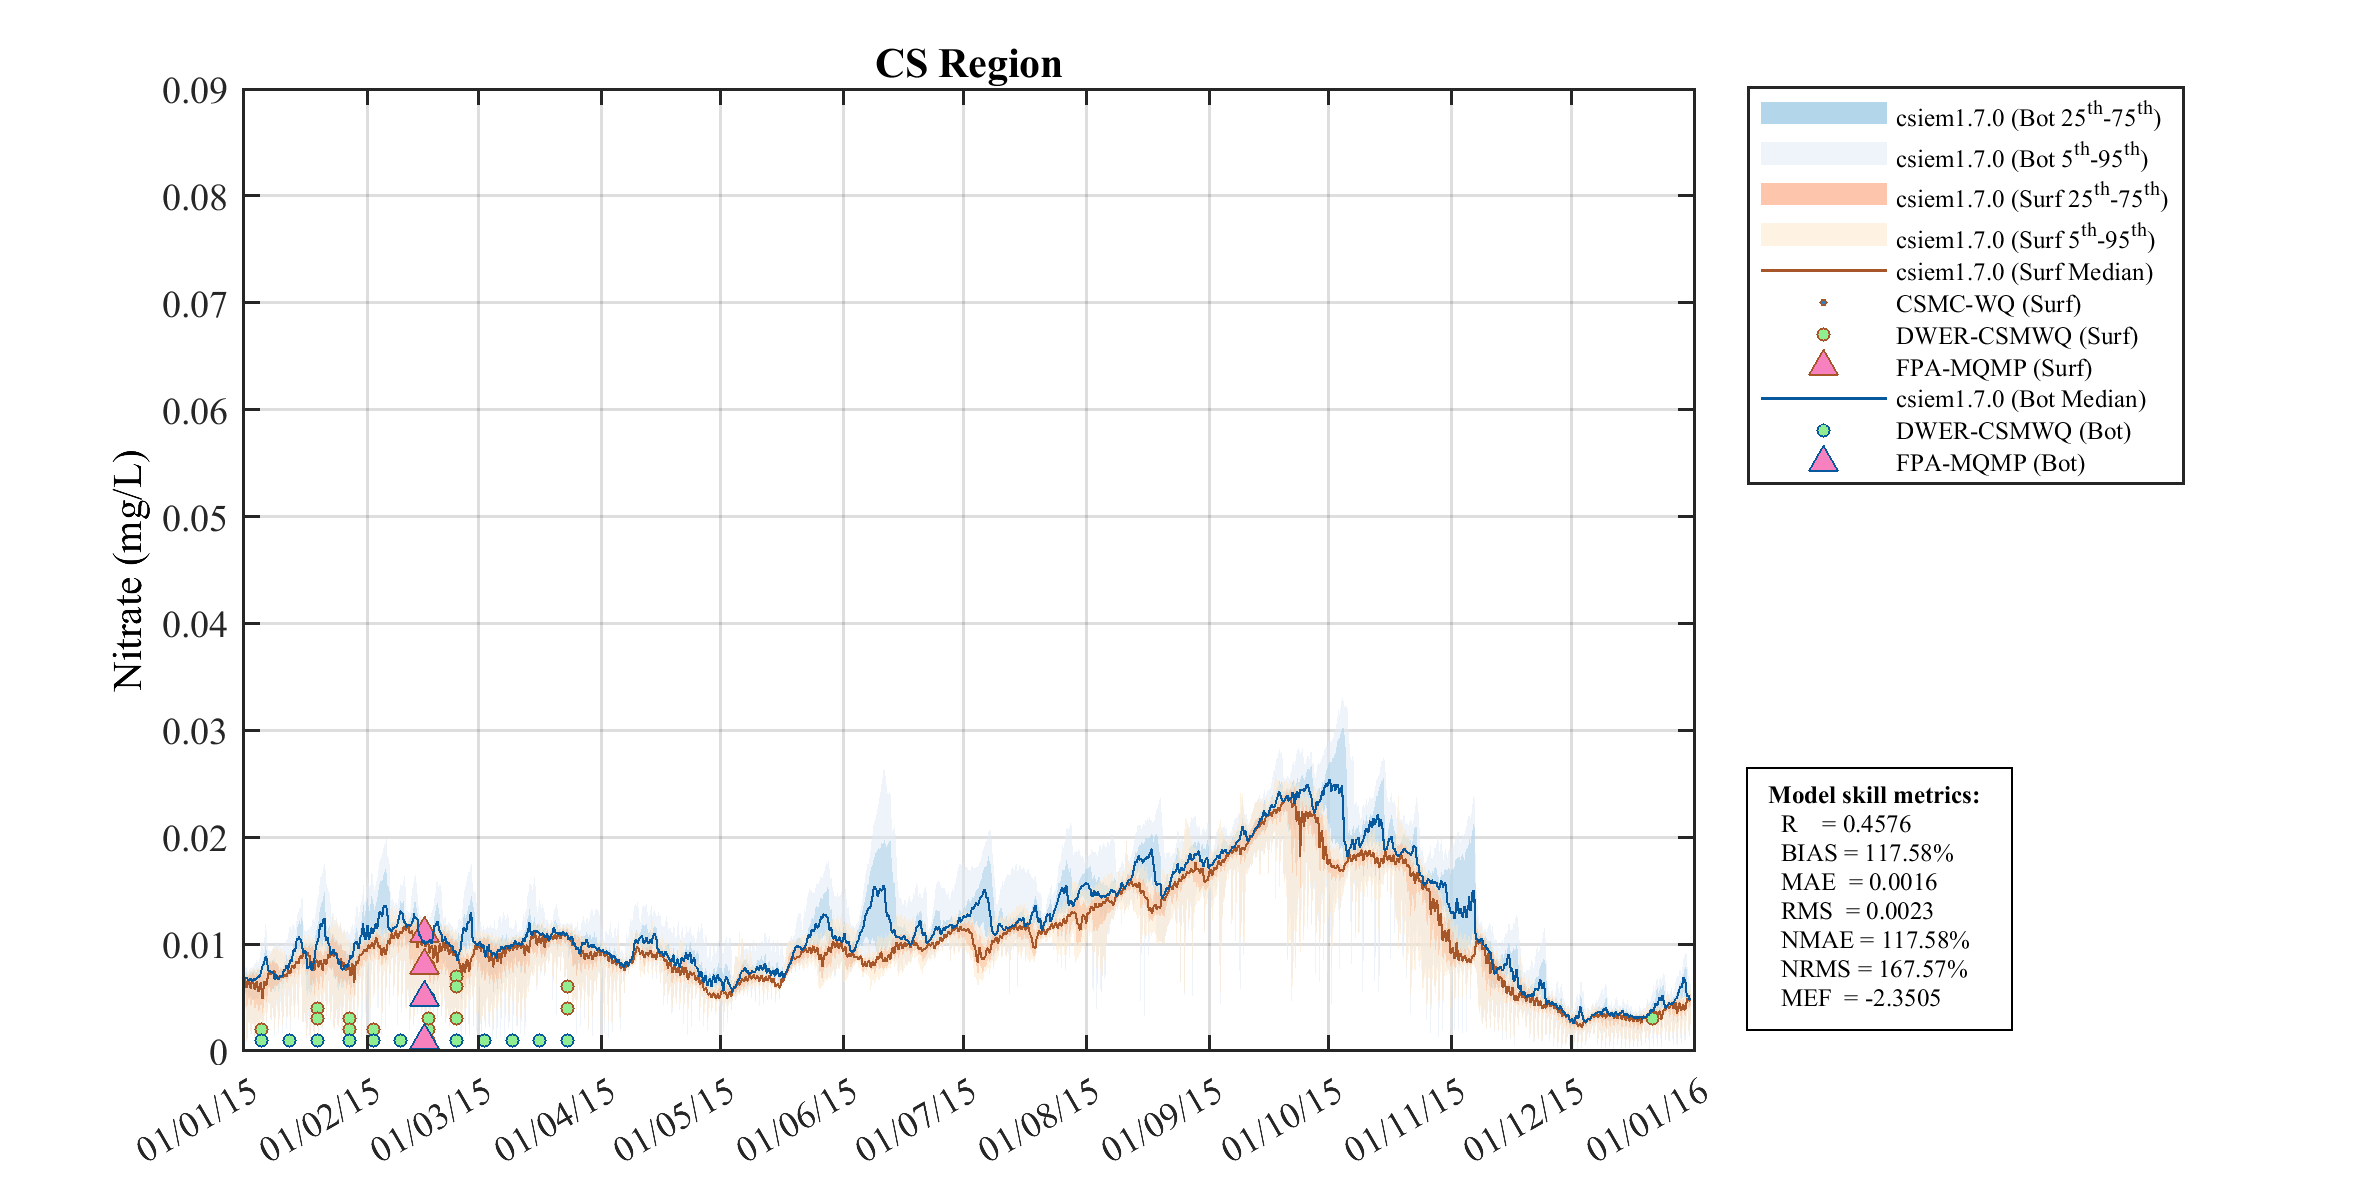
Nitrate (NO₃) (mg/L)
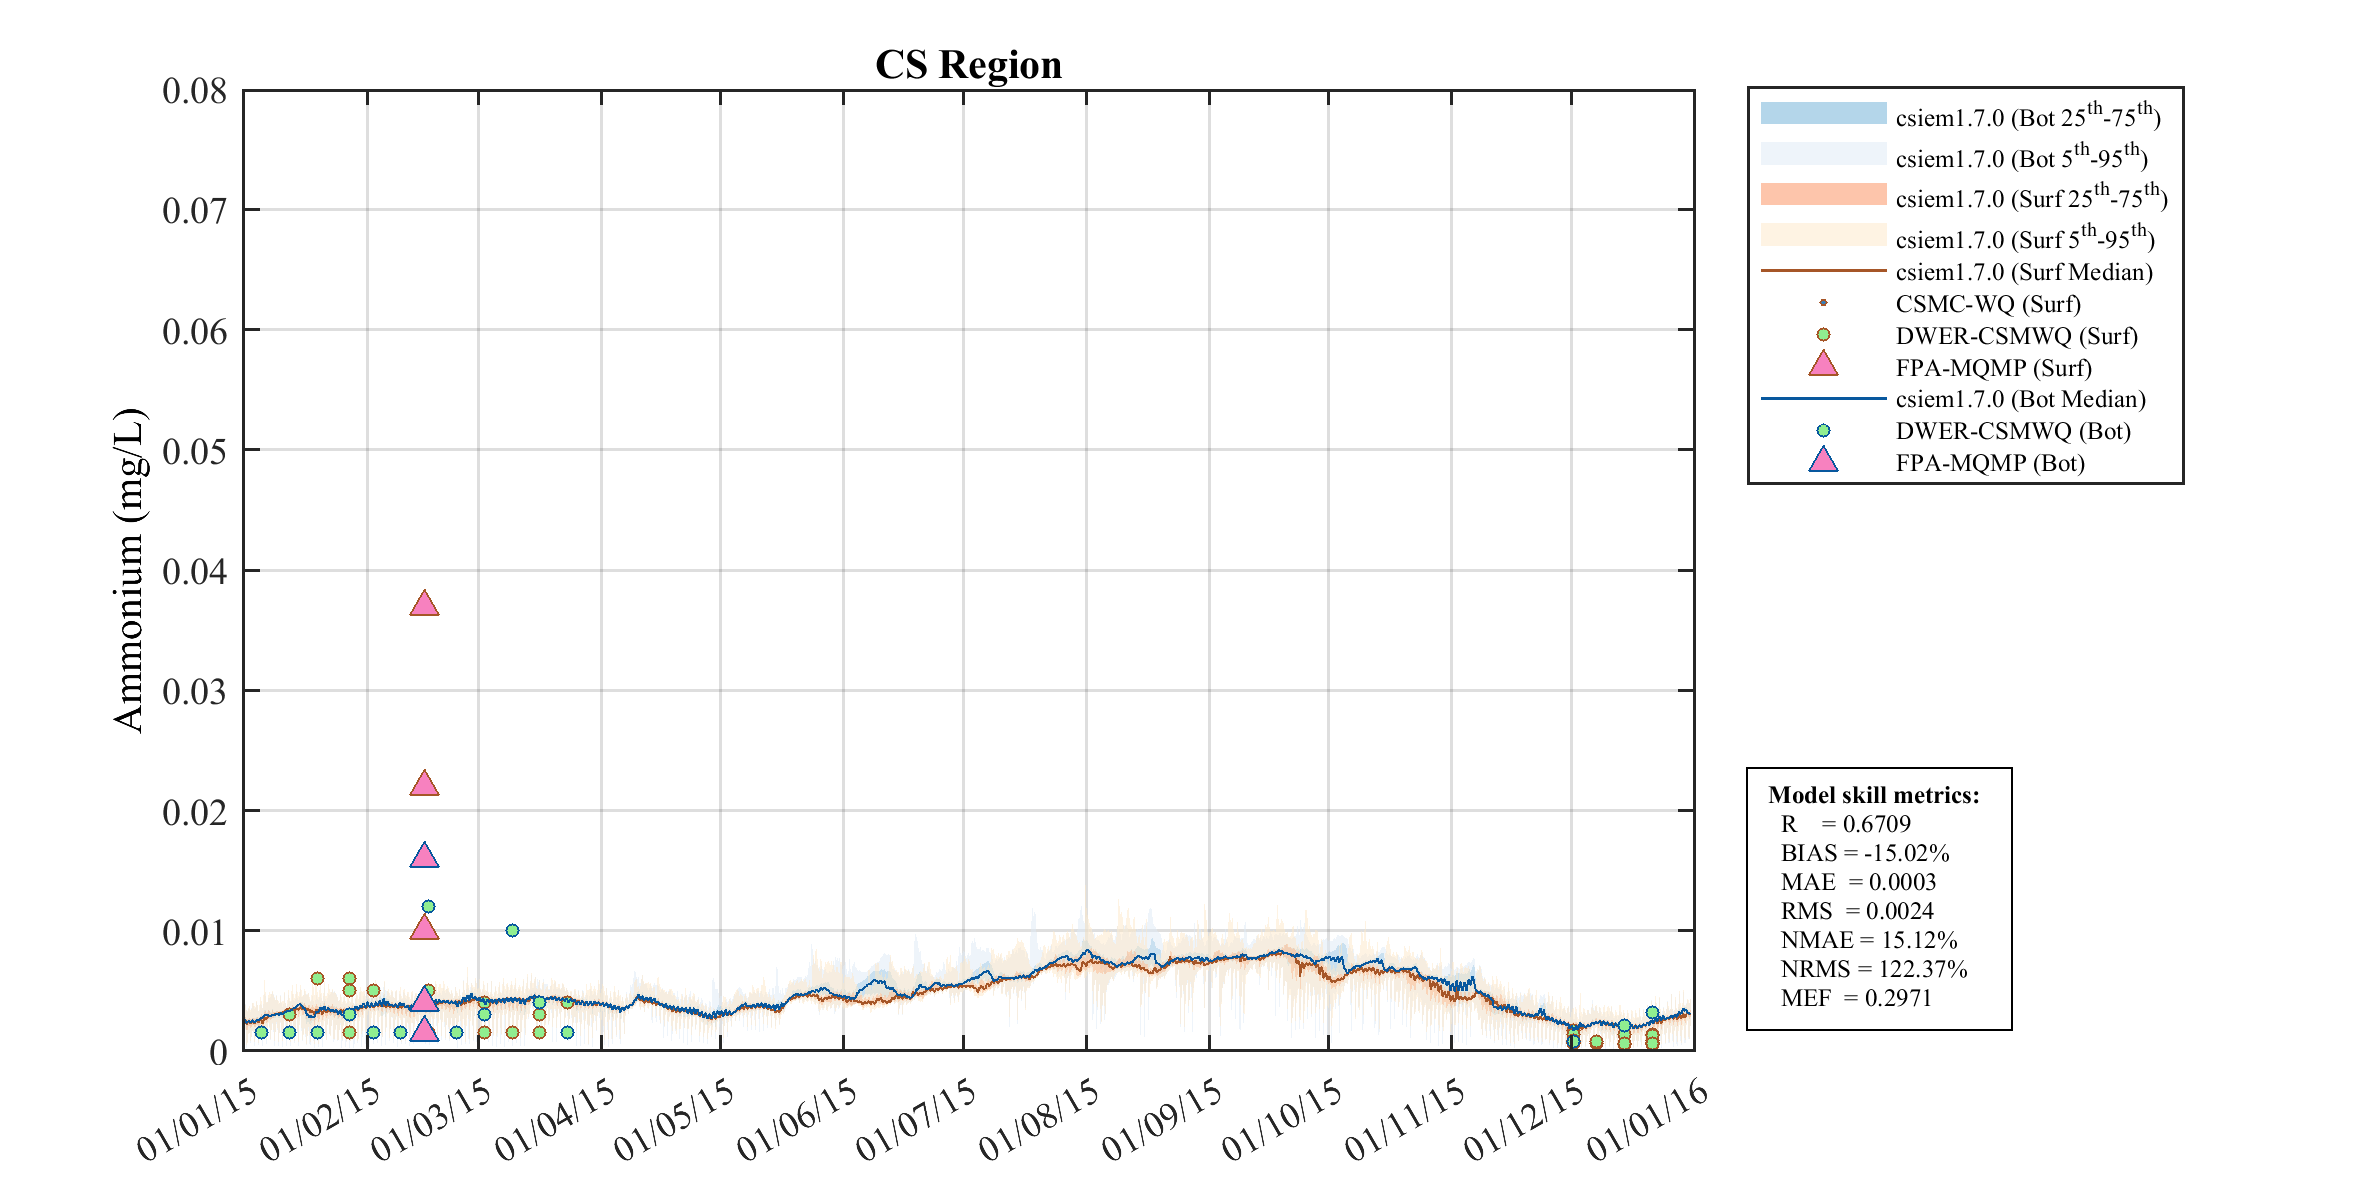
Ammonium (NH₄) (mg/L)
Phosphorus Species
Total Phosphorus (mg/L)
Phosphate (FRP) (mg/L)
Nitrogen Species
Total Nitrogen (mg/L)
Nitrate (NO₃) (mg/L)
Ammonium (NH₄) (mg/L)
Phosphorus Species
Total Phosphorus (mg/L)
Phosphate (FRP) (mg/L)
Nitrogen Species
Total Nitrogen (mg/L)
Nitrate (NO₃) (mg/L)
Ammonium (NH₄) (mg/L)
Phosphorus Species
Total Phosphorus (mg/L)
Phosphate (FRP) (mg/L)
Nitrogen Species
Total Nitrogen (mg/L)
Nitrate (NO₃) (mg/L)
Ammonium (NH₄) (mg/L)
Phosphorus Species
Total Phosphorus (mg/L)
Phosphate (FRP) (mg/L)
Nitrogen Species
Total Nitrogen (mg/L)
Nitrate (NO₃) (mg/L)
Ammonium (NH₄) (mg/L)
Phosphorus Species
Total Phosphorus (mg/L)
Phosphate (FRP) (mg/L)
Data Source & Notes
Observed nutrient data are sourced from the Cockburn Sound Management Council (CSMC) routine monitoring program, supplemented by targeted campaigns from the WWMSP projects. The CS Region aggregate polygon encompasses all sub-zones within Cockburn Sound and provides a broad overview of model performance. Individual sub-zone comparisons are available via the MARVL Viewer.